
Time & Price
Joined August 2025
- Tweets 497
- Following 375
- Followers 450
- Likes 2,701
294 Photos and videos


I'm not bull or bear on XRP. I'm reading the cycle.
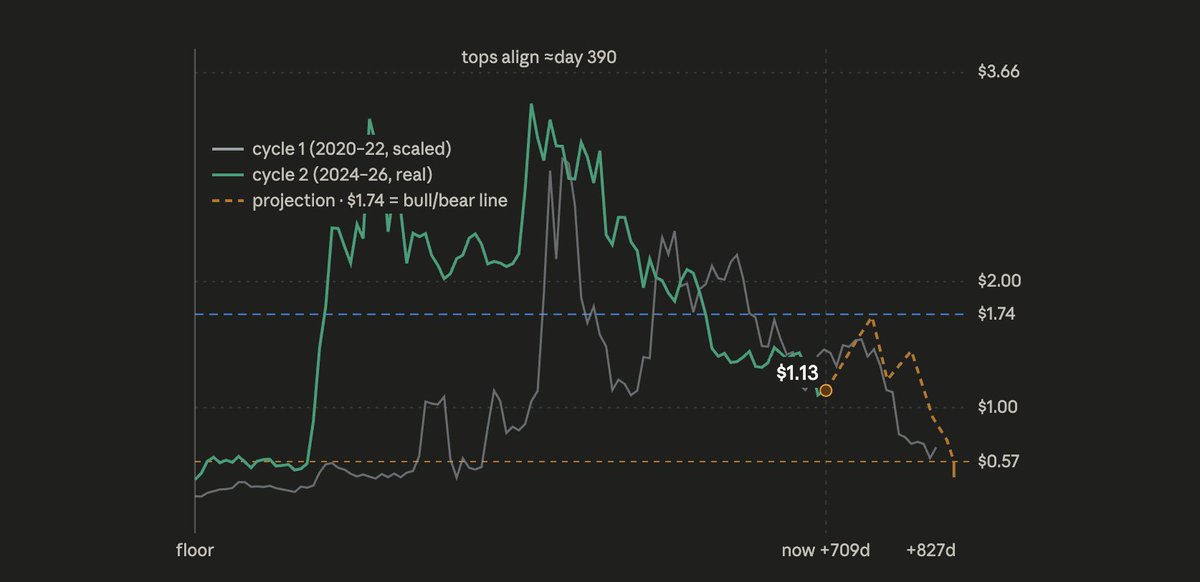
Anchored to its 2020 floor, XRP is rhyming with last cycle almost to the day same -70% drawdown at the same day count off the launch low.
Two roads from here:
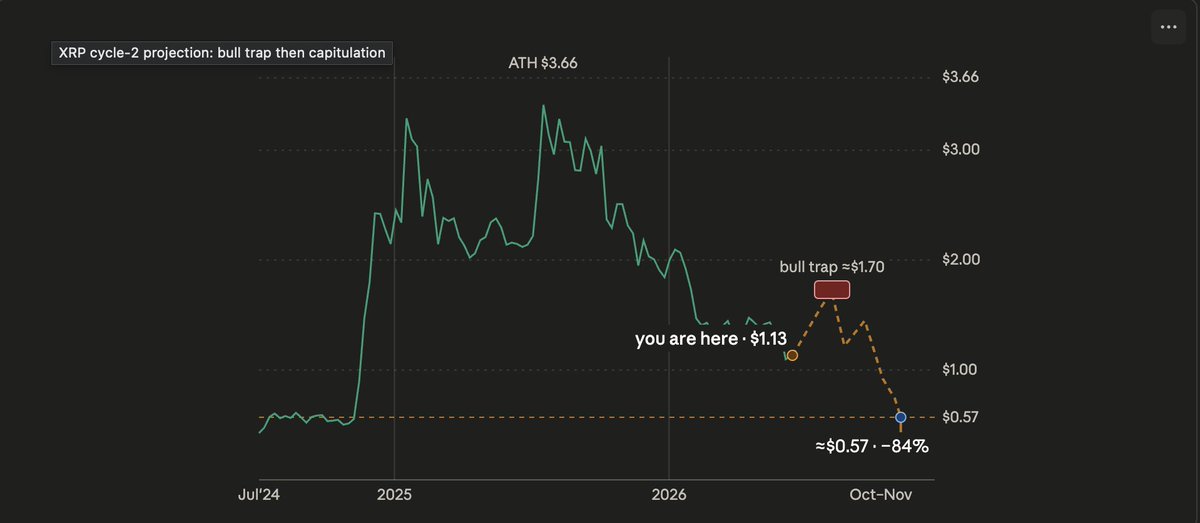
🐻 Bear: The 2021 fractal repeats: a bull trap that fails under $1.74, then capitulation to $0.57 (−84%) into Oct–Nov 2026.
Every prior XRP bear ran −85% to −97%. $0.57 would be a mild one technically.
🐂 Bull: This is XRP's first unshackled cycle (no SEC cap). Higher-lows project a floor near $0.81, the low may already be in, and the square-of-9 points up to $5.37 → $7.94.
One level decides it: $1.74.
Below = bear analog lives. Reclaim it = bulls take the wheel.
A map based on geometry 📐.

#XRP this cycle vs last cycle.
Remember how the SEC case broke the bull run.
5
148
#XRP this cycle vs last cycle.
Remember how the SEC case broke the bull run.
If this thesis is correct.
Then #XRP would have to clear the $1.70 - $1.80 area at the next attempt.
Other wise we could see .57c.
I am not saying this is what will happen. I am simply laying out a scenario based on harmonics of price and time.
1
1
261
If this thesis is correct.
Then #XRP would have to clear the $1.70 - $1.80 area at the next attempt.
Other wise we could see .57c.
I am not saying this is what will happen. I am simply laying out a scenario based on harmonics of price and time.
XRP time harmonics, part 2 👇
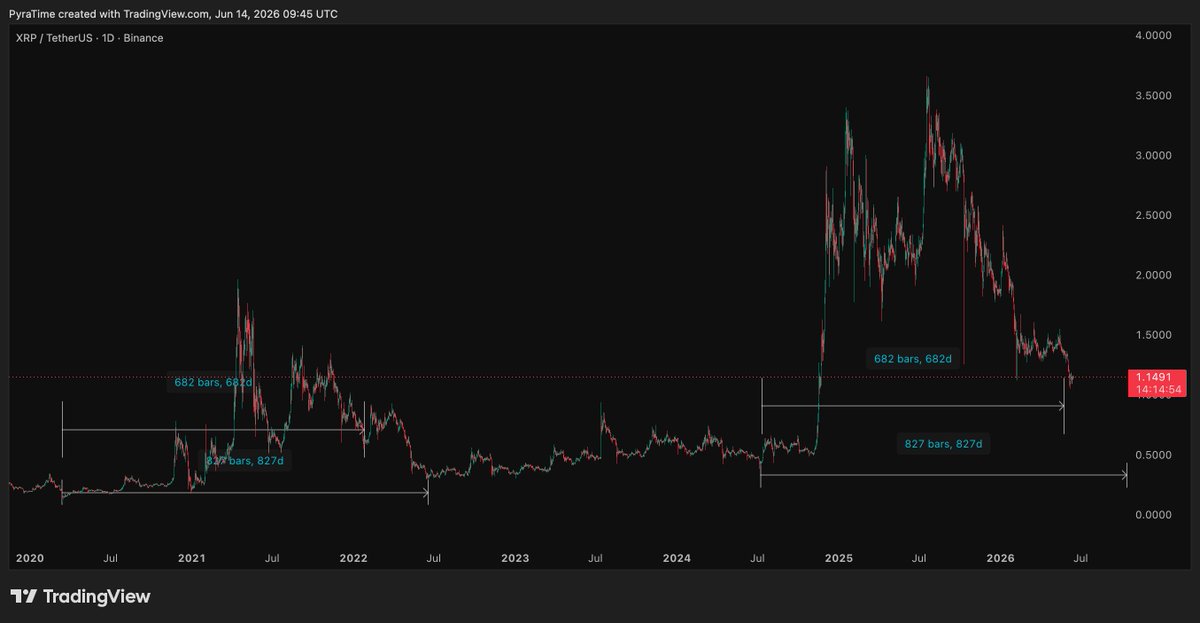
I anchored both cycles to their pre bullrun low and counted forward.
The counts line up almost to the day:
📏 680–700 days off the floor → both cycles sat -70% below their top.
2022: −69.7%
2026: −70.1%
(we just passed this mark in early June)
📏 827 days off the floor → last cycle that was the exact bottom (covid low → 18 Jun 2022, −84%).
Run the same 827 count on this cycle and it lands on 10 Oct 2026.
⏰ One year to the day after the Oct-2025 flash crash that wicked XRP ~56% ⏰
So if the rhythm holds, the analog low points to Oct-Nov 2026, not now.
The 70% mark wasn't the floor last time the real low came 4 months later.
Same beat, 3% slower this cycle. A timing rhyme, not a green light.
This also means that the bottom could come in around a window between Oct-10/Nov-5 window at around $0.57.
Brutal for long term holders if true.
NFA. 📐
10
965
XRP time harmonics, part 2 👇
I anchored both cycles to their pre bullrun low and counted forward.
The counts line up almost to the day:
📏 680–700 days off the floor → both cycles sat -70% below their top.
2022: −69.7%
2026: −70.1%
(we just passed this mark in early June)
📏 827 days off the floor → last cycle that was the exact bottom (covid low → 18 Jun 2022, −84%).
Run the same 827 count on this cycle and it lands on 10 Oct 2026.
⏰ One year to the day after the Oct-2025 flash crash that wicked XRP ~56% ⏰
So if the rhythm holds, the analog low points to Oct-Nov 2026, not now.
The 70% mark wasn't the floor last time the real low came 4 months later.
Same beat, 3% slower this cycle. A timing rhyme, not a green light.
This also means that the bottom could come in around a window between Oct-10/Nov-5 window at around $0.57.
Brutal for long term holders if true.
NFA. 📐
Jun 13
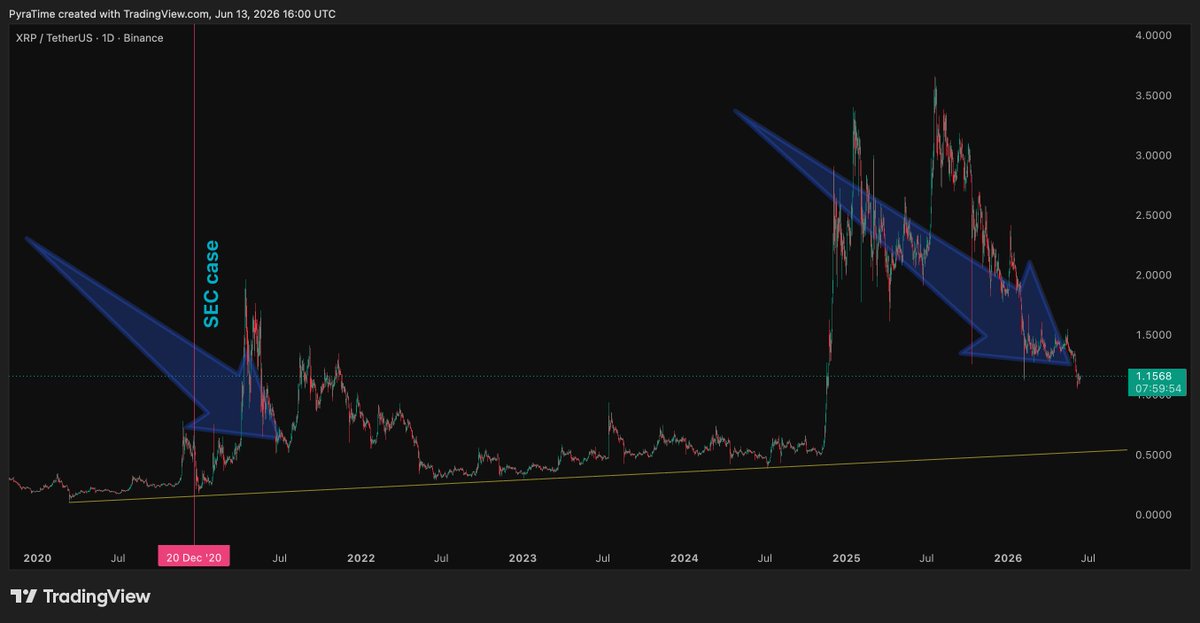
XRP cycle check: are we in the same spot as that 2021 "1st blue arrow" dip?
Both cycles ran the same script.
1yr pump → top → deep bleed:
2021: $0.10 → $1.97 → −74%
Now: $0.43 → $3.66 → −68%
Same move, bigger and slower. The vibrations are real too: the two tops are 4.26 yrs apart (the 4-year cycle), sit a clean 90° apart in price, and today's price lands right on the 135° mark off the 2020 covid low.
The catch: the 2021 dip bounced 2 months after the top. Currently, we are 11 months past this one.
By the clock we look more like the slow 2022 grind than the springy bounce.
But 2021 was a handicapped race.
The SEC suit cut XRP −78% in 35 days while BTC ran 43%.
XRP topped 210 days before BTC and got capped 42% under its old ATH, it never ran free.
This cycle the case cleared, XRP broke its ceiling (new ATH $3.66), and XRP/BTC went 1.0× → 0.32× → back to 1.0× at the top.
So the last cycle understated XRP. Same phase, bigger and slower, just later in it.
A timing rhyme. NFA. 📐
3
1
13
2,794

Jun 13
XRP cycle check: are we in the same spot as that 2021 "1st blue arrow" dip?
Both cycles ran the same script.
1yr pump → top → deep bleed:
2021: $0.10 → $1.97 → −74%
Now: $0.43 → $3.66 → −68%
Same move, bigger and slower. The vibrations are real too: the two tops are 4.26 yrs apart (the 4-year cycle), sit a clean 90° apart in price, and today's price lands right on the 135° mark off the 2020 covid low.
The catch: the 2021 dip bounced 2 months after the top. Currently, we are 11 months past this one.
By the clock we look more like the slow 2022 grind than the springy bounce.
But 2021 was a handicapped race.
The SEC suit cut XRP −78% in 35 days while BTC ran 43%.
XRP topped 210 days before BTC and got capped 42% under its old ATH, it never ran free.
This cycle the case cleared, XRP broke its ceiling (new ATH $3.66), and XRP/BTC went 1.0× → 0.32× → back to 1.0× at the top.
So the last cycle understated XRP. Same phase, bigger and slower, just later in it.
A timing rhyme. NFA. 📐
2
5
51
5,419
Jun 13
#VET Vechain is in the abyss.
I remember making cash from that 2020/2021 pump.
I haven't looked at it much over the years.
Absolutely brutal. I wonder if these coins will ever recover.
2
9
786
Jun 13
No indicator needed #LTC
I might have to start looking for long term entries soon.
1
2
11
581

Jun 12


9
564
Jun 11
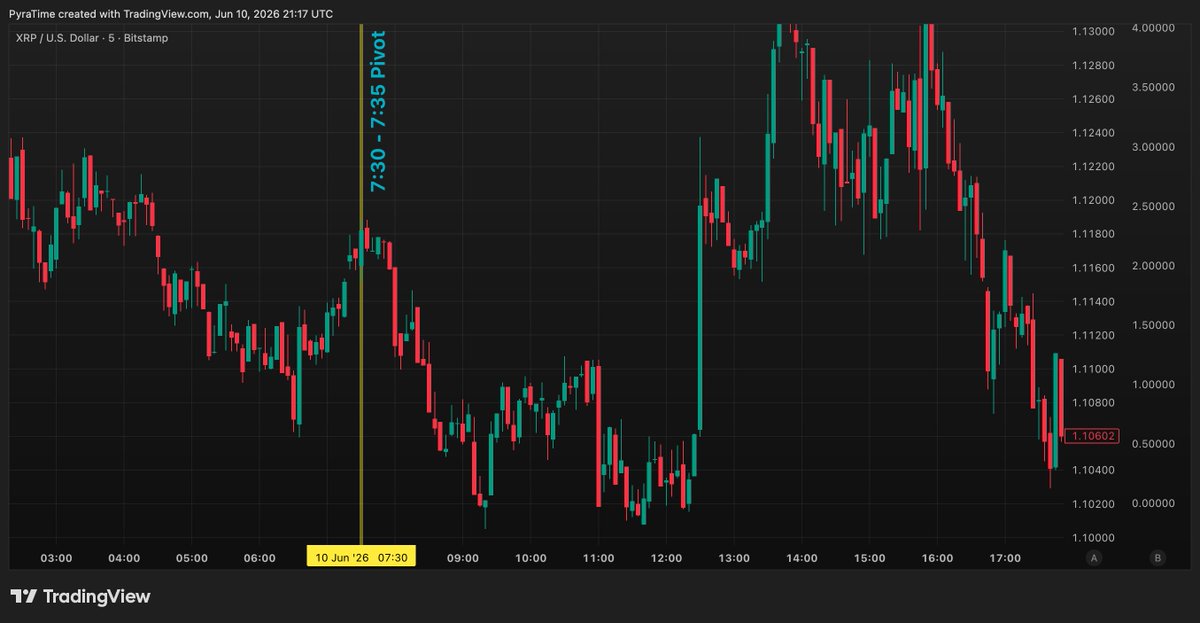
Yesterdays two main #XRP pivots.
1. 7:35 was nailed on.
2. 21:19 wasn't as percise but still signalled a swing low.
Jun 10
Tracking... looking for a sharp move with confirmation. Low confidence, but pivot possible.
1
15
1,084
Jun 10
Tracking... looking for a sharp move with confirmation. Low confidence, but pivot possible.
Jun 10
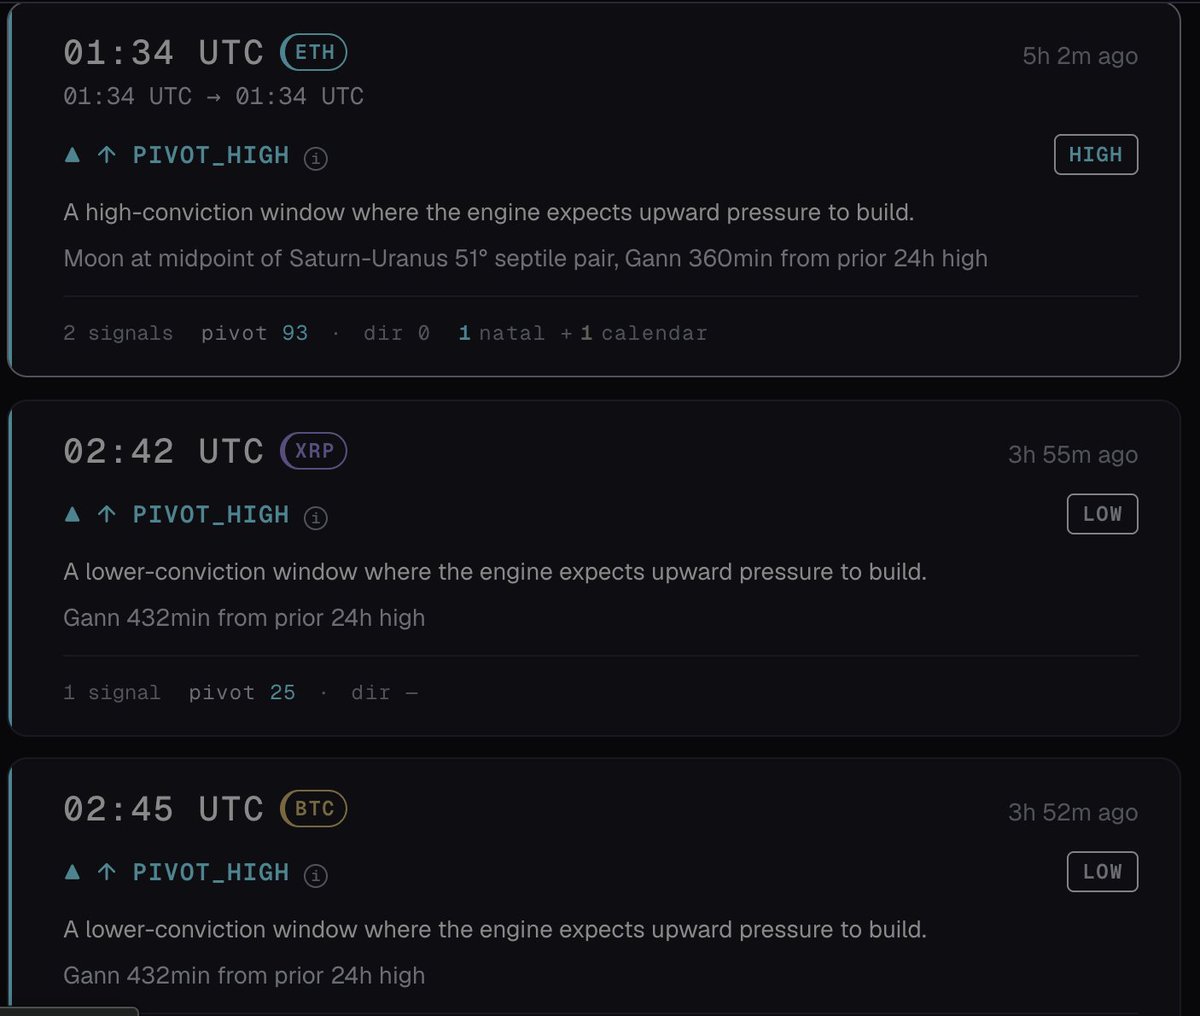
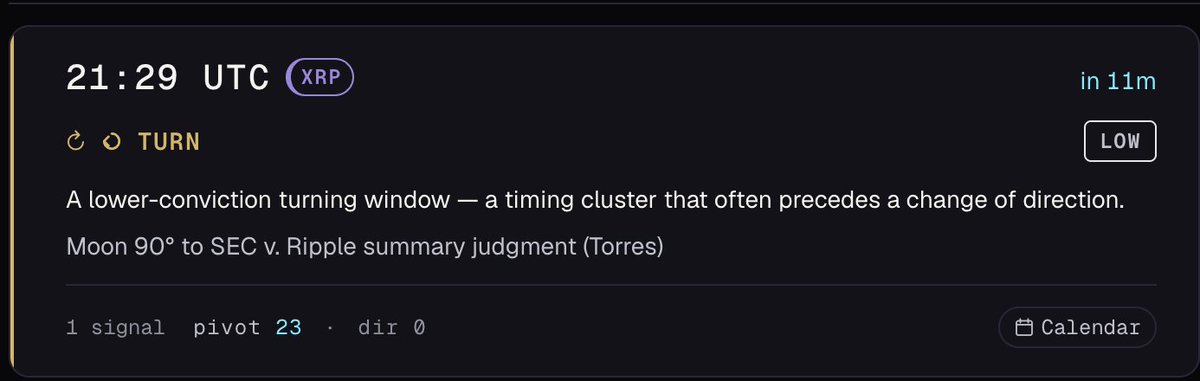
#XRP todays main pivot was.
We have one more today in 10 mins at 21:29 UTC but confidence score is lower. Caution advised.
1
2
1,715
Jun 10
#XRP todays main pivot was.
We have one more today in 10 mins at 21:29 UTC but confidence score is lower. Caution advised.
1
6
965
Jun 10
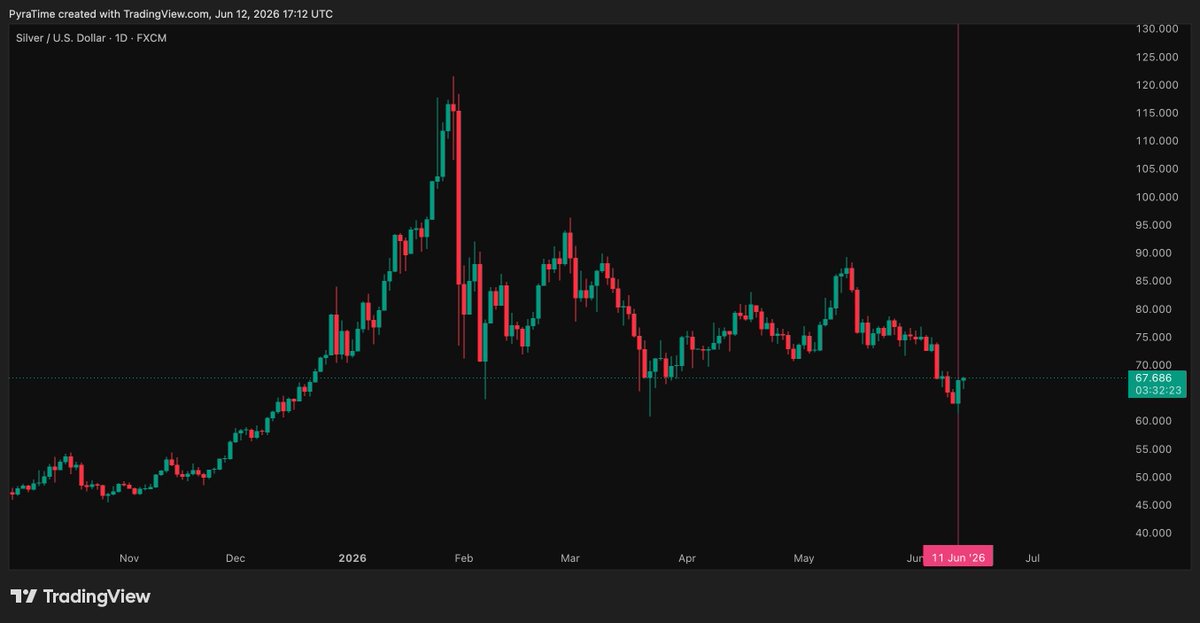
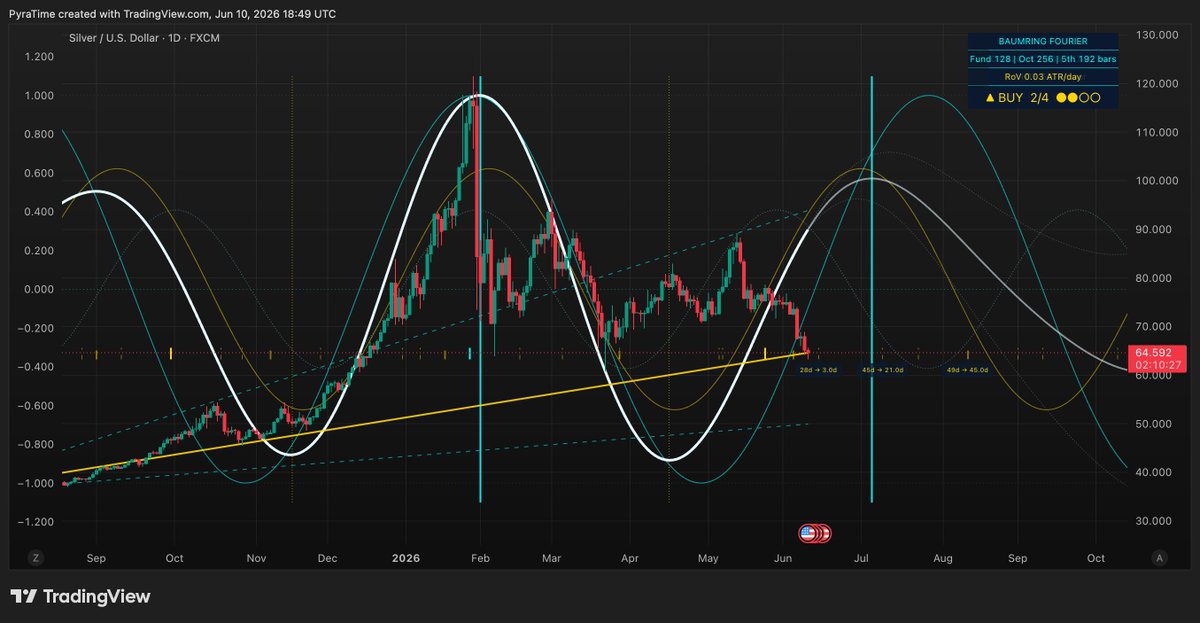
Tomorrow is a potential pivot date for Silver #XAG a cautious buy signal has appeared.
Worth tracking the for the next few days.
Highs into early July while risk on assets wain could be the play for the early summer 🤔
6
538
Jun 10
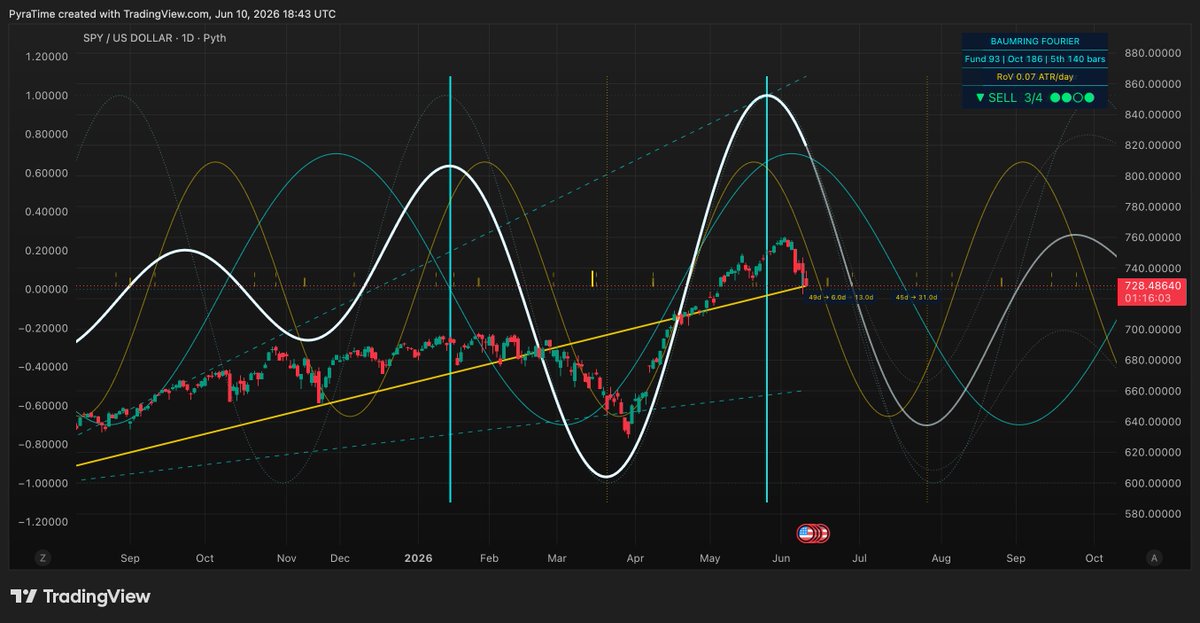
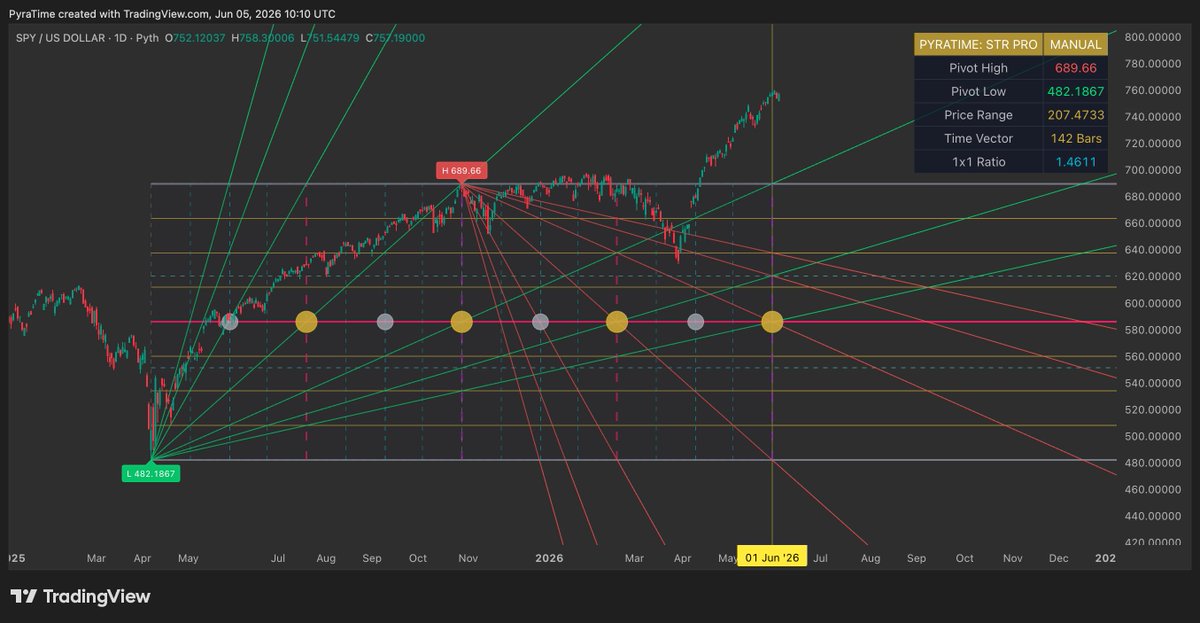
Update on the #SPY top call from last week 👇
The geometry flagged it.
Now the our new indicator based on the Fourier system confirms: SELL ★★★☆ printed at the cycle peak nodal, ~765. Price already down to ~729, testing the 1-year velocity line.
The cycle map says: down-leg into a late-July low.
Will keep track if this for you.
Jun 5
$SPY may have topped based on a geometric data from the last leg up.
🤔
What does that mean for Crypto and risk on assets?
1
1
5
601
Jun 10
*important note* - price is only 4.7% off the high and a reclaim of 765 kills the signal.
2
78
Jun 10
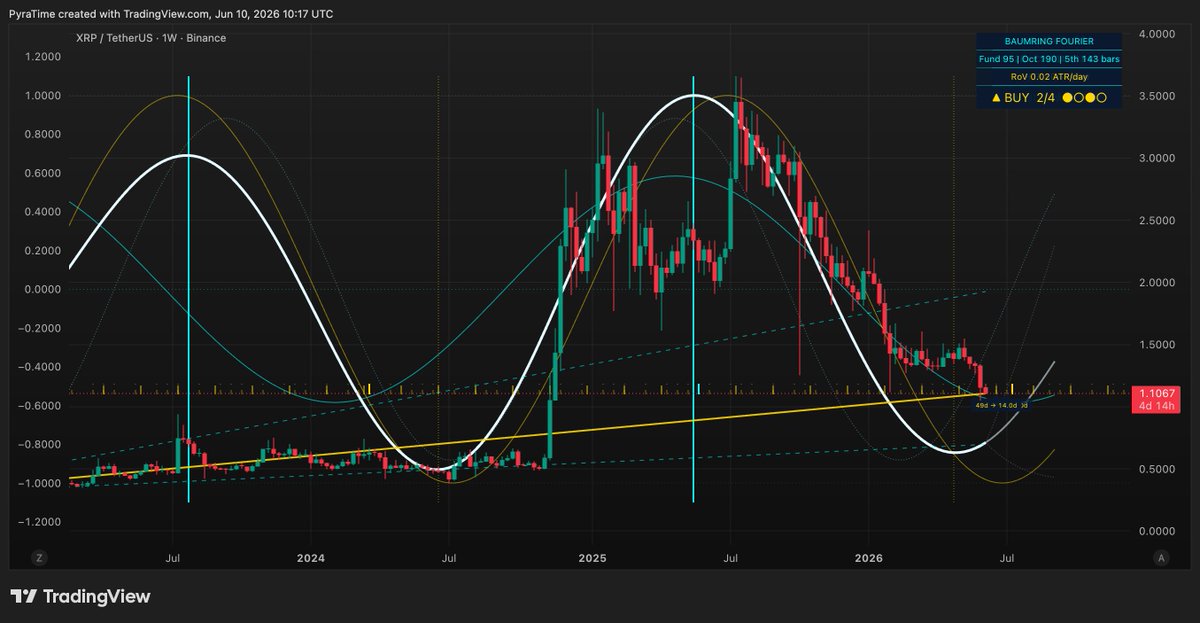
Zoomed out view on #XRP where my prognosis meets the Fourier cycle map.
My read: move up into late June, then a sharp flush into an early-July low.
The system's read: same shape, same low date. Daily composite troughs ~early July, right on a July 3 cycle hit.
The only quibble is the bounce high — the 4h wave says ~June 13–14, the 49-day Gann calendar says ~June 24. Both fit "up into late June" if the bounce is sloppy rather than clean.
Swing traders should do nothing until then. That's the position.
Not financial advice.
1
1
17
937
Jun 10
It was a pivot point alright.
Just our directional bias was off.
No trade taken. No damage done.
Onto the next one.
Jun 10
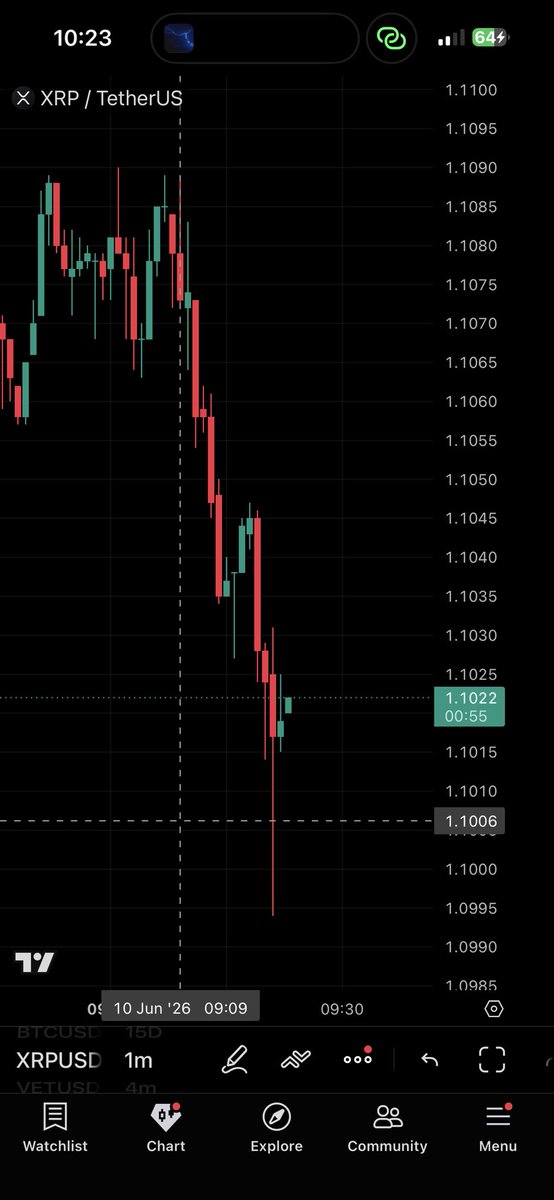
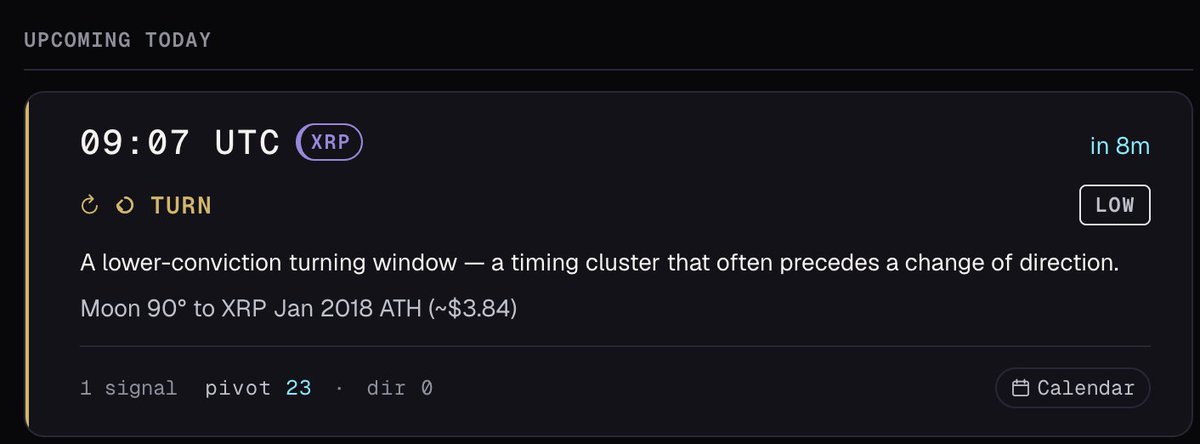
Tracking this as a possible reversal time.
Looking for confirmation before taking a trade.
Bias is looking for a long up to 1.1188
No trading until confirmation. Every trader needs a confirmation process that works for them.
8
909
Jun 10
Tracking this as a possible reversal time.
Looking for confirmation before taking a trade.
Bias is looking for a long up to 1.1188
No trading until confirmation. Every trader needs a confirmation process that works for them.
5
1,207