
Helping algo traders algo trade better. Welcome to a world where your algo trading flourishes — thoughtfully, steadily, brilliantly.
Joined March 2024
- Tweets 111
- Following 38
- Followers 12
- Likes 10
43 Photos and videos


Weekly market map: price first, timing second
Markets enter Tuesday with risk bid still alive, but the timing map says this is a week to inspect the rally, not chase it blind.
Current board: S&P 500 near 7,548 (-0.5%), QQQ near 740.82 ( 0.0%), and NVDA near $208.87 (-4.5%). That keeps AI leadership in the driver seat.
Crypto is firmer too. BTC trades near $66,355 ( 7.6%) and ETH near $1,810 ( 10.6%). The important part is location: on the ATH-anchored Square of 9, BTC is sitting between roughly $66,183 support and $66,698 resistance. That is a tight decision box, not a victory lap.
Macro is mixed. Gold is near $4,380 ( 1.0%), crude is near $80.35 (-12.0%), and DXY is around 99.47 (-0.6%). When stocks, crypto, gold, oil, and the dollar all move this aggressively, the signal is not one asset. It is liquidity repricing.
The Gann timing lens is the standout: Friday, June 19 is 256 days from BTC's Oct. 6, 2025 ATH. That is 16 squared. It also lands two days before the June 21 summer solstice, one of the major seasonal checkpoints. Translation: this is a timing window for confirmation, exhaustion, or repair. Price still has to prove it.
My read for the week: bulls want BTC above $66,698 and then $64,648. Bears want a failed reclaim and a break back under $66,183. For equities, keep watching whether NVDA and QQQ can keep dragging breadth higher.
Gann does not replace risk management. It gives you a calendar and a ruler.
If you want the full market map, cycle notes, and level work, go to quantalchemy.io
21

Jun 12
This week’s lesson:
Structure beats opinion.
A timing window can make me alert.
A Gann level can make me prepared.
But only price can confirm the trade.
That is the lane I trust: time, proportion, confirmation, invalidation.
7
Jun 11
The midpoint is the battlefield.
Above it, buyers control the active range.
Below it, sellers do.
That is why I like Gann-style range work: it turns vague market opinion into a line that can be confirmed, rejected, and backtested.
10
Jun 10
Venus-Jupiter conjunctions are appetite gauges, not automatic buy signals.
Venus = preference, valuation, willingness to enjoy risk.
Jupiter = expansion.
Together: optimism can show up, but markets still require proof.
Today's Venus-Jupiter conjunction is tight in Cancer while Mercury-Saturn is also tight.
Translation: appetite may knock, but the bouncer is data.
After CPI/PPI, ask where buyers are willing to sponsor risk:
Bullish appetite: breadth expands, yields stop rising, BTC/ETH hold retests, and S&P reclaims its 4/8 balance line.
Failed appetite: relief fades, gold and BTC stay correlated lower, and leadership narrows back to crowded names.
We break this down daily in the Quant Alchemy briefs: quantalchemy.io
39
Jun 10
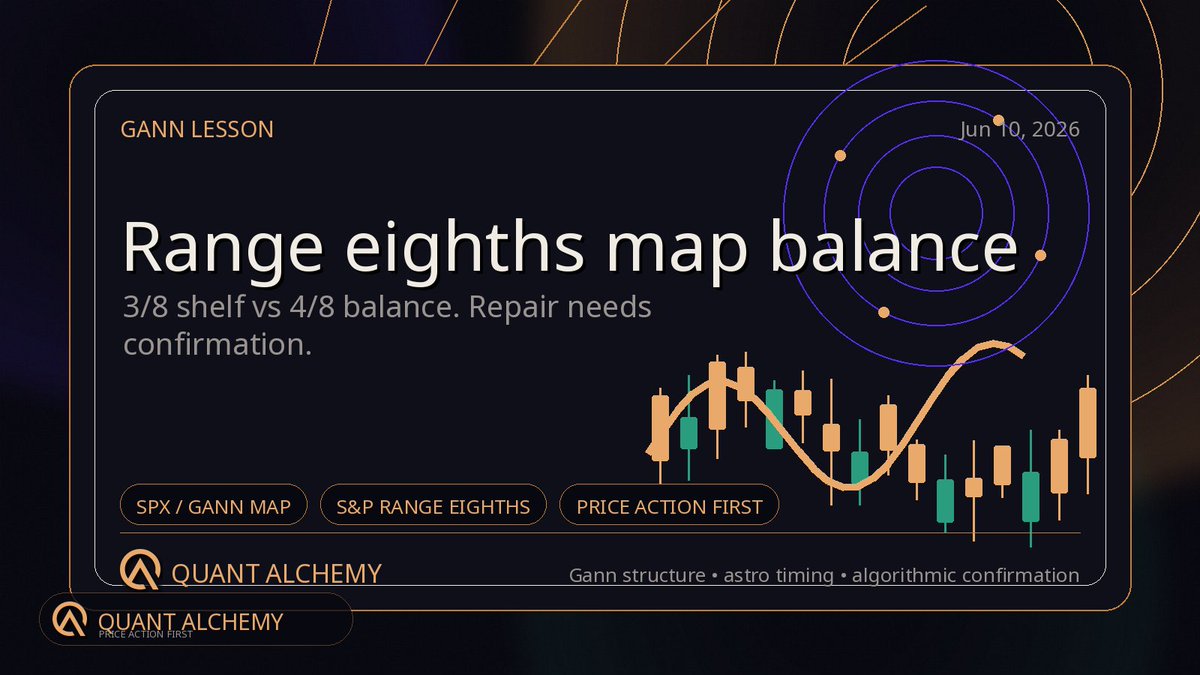
Gann Lesson: range eighths turn volatility into a tradable map.
Using the latest five daily S&P bars from today’s Quant Alchemy brief:
High: 7,605.35
Low: 7,237.85
Span: 367.50 points
Midpoint: 7,421.60
One eighth: ~45.94 points
The point is not that every eighth is magic.
The point is that proportional shelves show whether price is below balance, repairing balance, or rejecting from balance.
Current S&P read from the brief: near 7,386.65.
That puts price:
- Above the 3/8 shelf near 7,375.66
- Still below the 4/8 balance line near 7,421.60
Translation: repair, not full control.
Bull case: reclaim and hold above 7,421.60. That says buyers recovered balance.
Bear case: reject back below 7,375.66. That says downside tempo is regaining the wheel.
Map the range. Wait for confirmation. Let price vote.
I’m putting practical Gann lessons like this into the daily Quant Alchemy briefs.
Read today’s full brief and subscribe to future ones here:
quantalchemy.io/briefs/2026-…
17
Jun 10
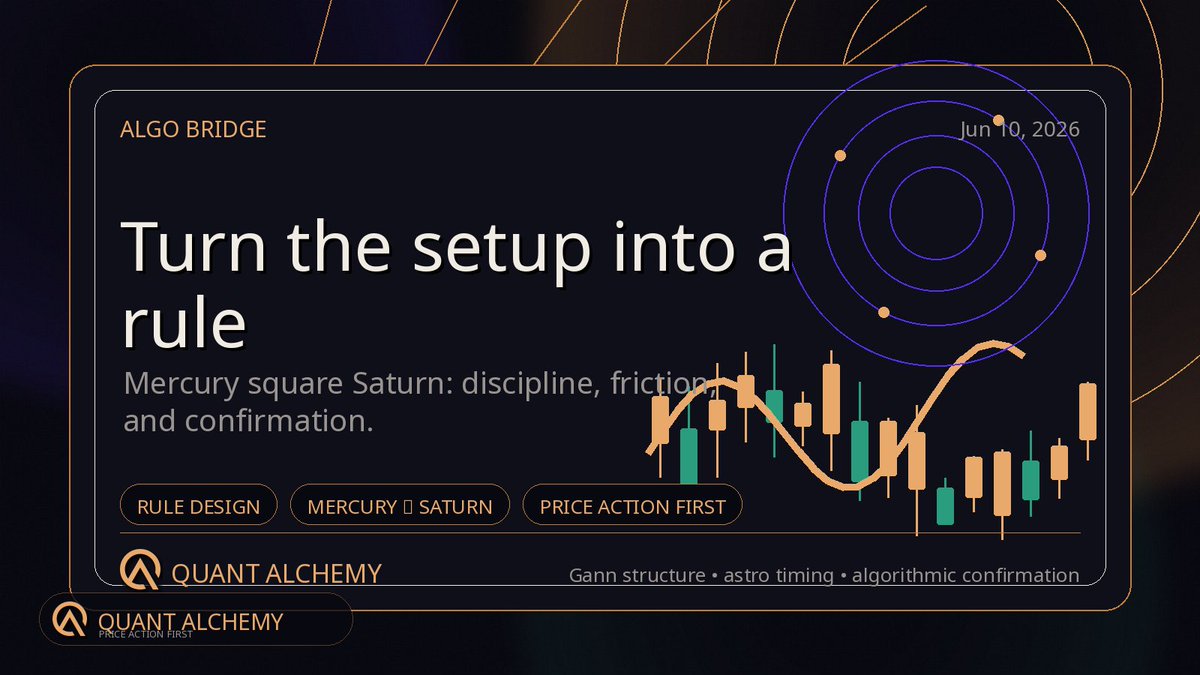
Mercury square Saturn is the cleanest trading metaphor of the week:
Slow down. Define the rule. Wait for confirmation.
The market does not owe us clarity. The rule does.
Algo version:
1. Mark the latest confirmed swing low.
2. Mark the prior range midpoint.
3. Require a close back above midpoint.
4. Require the next candle to hold it.
5. Invalidate below the swing low.
No confirmation, no trade.
This is the Quant Alchemy lane:
Gann/timing tells me when to pay attention.
Structure tells me what matters.
Price decides if there is a setup.
Would you automate this rule?
quantalchemy.io/
26
Jun 9
This is the kind of week where price can look calm right before the trap door or breakout opens.
Monday morning check: BTC is trading near $63.7K, up about 3.2% over 24h. ETH is near $1,683, up 4.0%. SOL is near $66.74, up 3.5%. Risk is not asleep.
Equities are leaning risk-on too: S&P 500 near 7,435, up 0.7%; Nasdaq near 25,960, up 1.0%; QQQ 1.3%; VIX down around 12.8% to 18.76. 10Y yield holding around 4.53%, DXY just under 100. Oil near $90.97 and gold near $4,363 keep the macro backdrop hot.
BTC is the cleaner read for timing this week. The Square of 9 map from the prior $126,210 ATH has BTC pressing the lower part of the wheel. The old $63,975 level is now the first decision shelf. Reclaim and hold above it, and the next tests are $66,015, $67,565 to $68,257. Lose it, and the bigger downside magnet remains the $59,992 zone, basically the $60K psychological line.
That does not mean predict. It means prepare.
The week ahead is a confirmation window: watch whether equities can hold their risk-on tone while BTC repairs back above $64K. If BTC lags while SPX and Nasdaq push, crypto beta is weak. If BTC reclaims $64K, then $66K becomes the first real market structure test.
My rule: do not worship the level. Watch the reaction. A clean reclaim, compression, and higher low is useful. A wick through a level with no follow-through is just liquidity doing its job.
For Quant Alchemy, this is exactly why time, price, volatility, and market structure belong in one dashboard. The level matters less than the behavior around it.
See the tools and market framework at quantalchemy.io
47
Jun 4
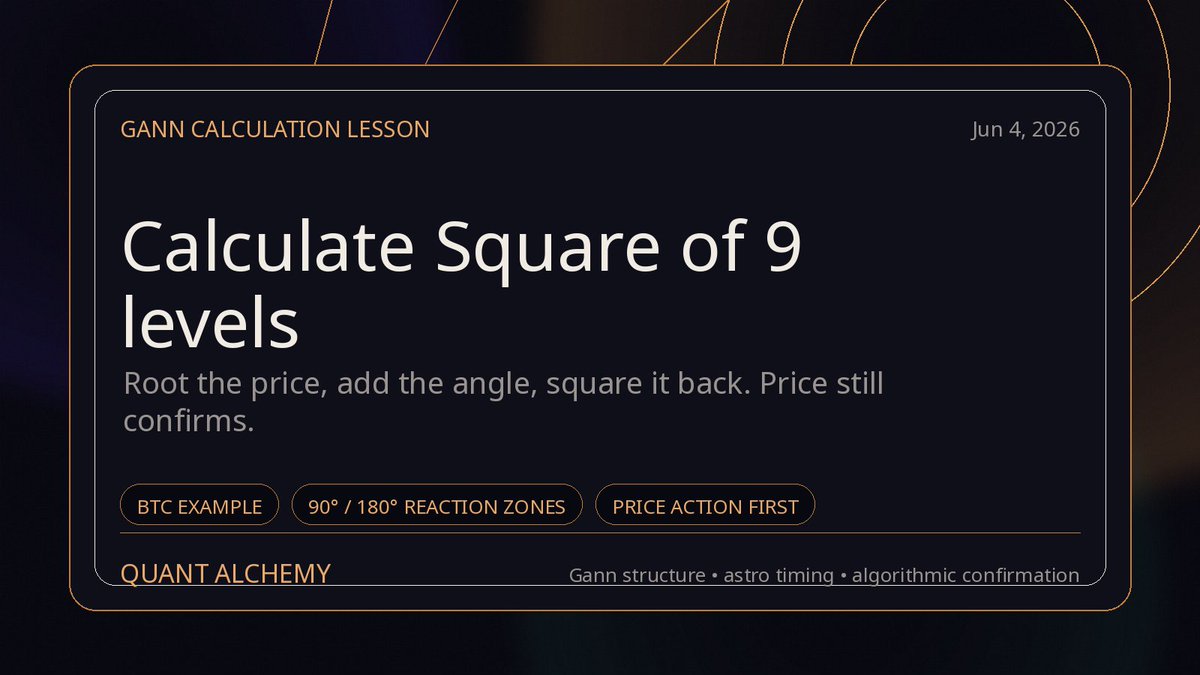
Gann Lesson: how to calculate Square of 9 reaction levels
The Square of 9 looks mystical until you reduce it to the actual math.
It is just a way to translate price into angular relationships.
Quick method:
1. Pick one anchor price.
2. Take the square root.
3. Add or subtract the angle increment.
4. Square the result back into price.
5. Only care if the level lines up with real market structure.
In today’s Quant Alchemy brief, BTC was near $67,127.
Square root of 67,127 ≈ 259.09.
For the common quarter-turn shortcut:
- 90° = add/subtract 0.5 in square-root space
- 180° = add/subtract 1.0 in square-root space
That gives a rough BTC lattice:
-180° ≈ $66,610
-90° ≈ $66,868
Anchor ≈ $67,127
90° ≈ $67,386
180° ≈ $67,646
Those are not magic lines.
They are attention zones.
If one of those levels also overlaps a prior high/low, VWAP, volume shelf, liquidation cluster, or options strike, then I care more.
If price slices through with no reaction, I care less.
That is the discipline:
Gann gives the map. Structure gives the context. Price gives the verdict.
Read the full market brief Gann lesson here:
quantalchemy.io/briefs/2026-…
29
Jun 3
Gann Lesson: Square of Nine and the BTC 70k shelf
Yesterday’s Quant Alchemy brief had BTC near $69,556, testing the $70k psychological shelf.
Today BTC is lower, near $67.1k on a quick live check, which makes the lesson more useful — not less.
The Square of Nine is not a prediction machine. It translates price into angular relationships so you can build a repeatable map, then force price action to confirm or invalidate it.
Simple ladder:
1. Anchor one meaningful pivot or live price. Do not cherry-pick five anchors until one works.
2. Take the square root of price.
3. Add/subtract 0.25 for 90°, 0.50 for 180°, or 1.00 for 360°.
4. Square the result back into price.
From yesterday’s BTC anchor near $69,556, the rough upward levels were:
- 90°: $69,688
- 180°: $69,820
- 360°: $70,084
Those levels mattered because they clustered around the obvious $70k shelf.
Now that BTC is closer to $67.1k, that old $69.5k–$70.1k zone shifts from “support shelf” to “overhead reclaim test.” A fresh live-price map around $67,114 gives nearby attention levels around $67,244, $67,373, and $67,633 above — with $66,985, $66,855, and $66,597 below.
None of those are trades by themselves.
The rule is:
Build the map → look for confluence → wait for acceptance/rejection → define invalidation before sizing.
Price action is the judge. Gann geometry is the map.
I’m putting this framework into the new Quant Alchemy briefs so traders can see the level, the context, and the confirmation logic together:
quantalchemy.io/briefs/2026-…
38
Jun 3
Weekly Market Map: BTC, SPX, and the June 19 Time Window
BTC is sitting in a very narrow geometry box while everyone argues narrative.
Current snapshot: BTC is near $71,690, down about 2.5% from the prior daily close. The intraday range is roughly $71,480 to $73,875, with volume near $31.3B.
S&P 500 is near 7,574.58, basically flat at about -0.07% on the day, with an intraday range of 7,562.61 to 7,585.49. Equities are not confirming panic yet. Crypto is the one testing structure.
The BTC map is clean.
From the October 6, 2025 ATH at $126,210, price is now about 43.2% below the high and 238 days into the cycle. On the Square of 9, BTC is sitting between 87 and 88 full rotations below the ATH.
87 rotations: $71,964
88 rotations: $71,428
Current: ~$71,690
That is the battlefield.
A reclaim above $71,964, then $72,226, would put bulls back above the near-term rotation band. If that holds, the next upside levels I am watching are $73,848 and $75,768.
A loss of $71,428 keeps pressure on the tape. Below that, the next supports are $70,363, $69,564, and $67,470.
The calendar matters too, but only as context.
Fib 233 days from the ATH landed on May 27. The next major count is June 19, which is 16 squared, 256 days from the ATH, right into the solstice window. That does not predict a trade. It tells me when to pay closer attention.
My rule stays simple: time windows create awareness. Price creates confirmation. Risk creates the trade.
For this week, I am watching whether BTC accepts back above the 87 rotation level or loses the 88 rotation level. Until then, the range is the signal.
Price action is the judge. Gann geometry is a map, not a guarantee.
Build the map, define the trigger, automate the discipline at quantalchemy.io
69
May 27
If this week feels like a decision point, that is because the tape is running into one.
Bitcoin is trading near $76.4K, up from the low-$68K Square of 9 map we built earlier this cycle and now pressing directly into the Fib 233 time confluence on May 27. That matters because time counts tend to show up when price is already leaning, not when the market is asleep.
The S&P 500 is sitting near 7,473, still elevated, but the bigger macro backdrop has not magically simplified. We are still operating inside a midterm-year environment where strength can persist longer than expected, but timing windows deserve more respect than the average trend chaser gives them.
From the Quant Alchemy Square of 9 work, the market has already reclaimed the old $67,565 and $63,975 support region and is now leaning into the next decision band. The near-term upside reference is still $78,923. If that level starts accepting, the bigger harmonic magnet remains $99,389, which is why the $100K zone is not just a psychological headline level. It has actual geometric weight behind it.
Today is where the timing gets interesting. May 27 is the Fib 233 count, and the next larger timing marker does not arrive until June 19, which is 16 squared. That makes this zone useful for judging whether the market is preparing for continuation, hesitation, or a more meaningful stall.
The practical read is simple. If BTC can hold structure and keep pressing toward $78,923, then this timing window may just be a checkpoint on the way higher. If price starts rejecting hard into this zone, then traders should stop pretending time counts are random background noise.
This is the real use of Gann-style timing. Not prediction. Attention.
Price action is still the final arbiter. Time just tells you when to care more.
If you want market structure, Sq9 levels, and timing-window context without the fluff, start at quantalchemy.io
20
May 19
Bitcoin is pressing into a time and price confluence that deserves more respect than the average weekly candle gets.
BTC is trading around $76,955, almost exactly on top of a prior Square of 9 upside objective near $76,692. The next rotation above that sits near $78,923. That is the zone I care about this week, because if price accepts above it, the conversation shifts fast toward higher harmonic targets instead of another range chop narrative.
Tomorrow, May 19, is not just another date on the calendar. It marks 15², or 225 days from the October 6, 2025 BTC cycle high. In Gann work, those square counts matter because time often sets the stage before price reveals intent. One week later, May 27 brings the 233 day Fibonacci count. Two important clocks are ticking inside the same short window.
Equities are sending a different message. The S&P 500 is sitting near 7,139, while the broader midterm year script still argues for caution. Historically, late April often begins the tougher stretch in midterm years, and that risk window can extend deep into summer. Translation: crypto may have a cleaner tactical setup than equities here, but cross-market volatility is still very much in play.
For BTC, the levels are straightforward. Hold above the upper 76K area and bulls can start hunting 78,923, then 99,389 over time. Lose acceptance back under the breakout zone and the market may force a retest before the larger move resolves.
This is where traders get paid for patience. Not for predicting every tick, but for knowing which numbers matter when time and price start rhyming.
If you want market structure, Gann timing, and cleaner trade maps, start at quantalchemy.io
24
May 13
If you're interested in the coming Krown AI product that coming, I've added a progress page so you can follow along.
krong.ai/progress
9
May 12
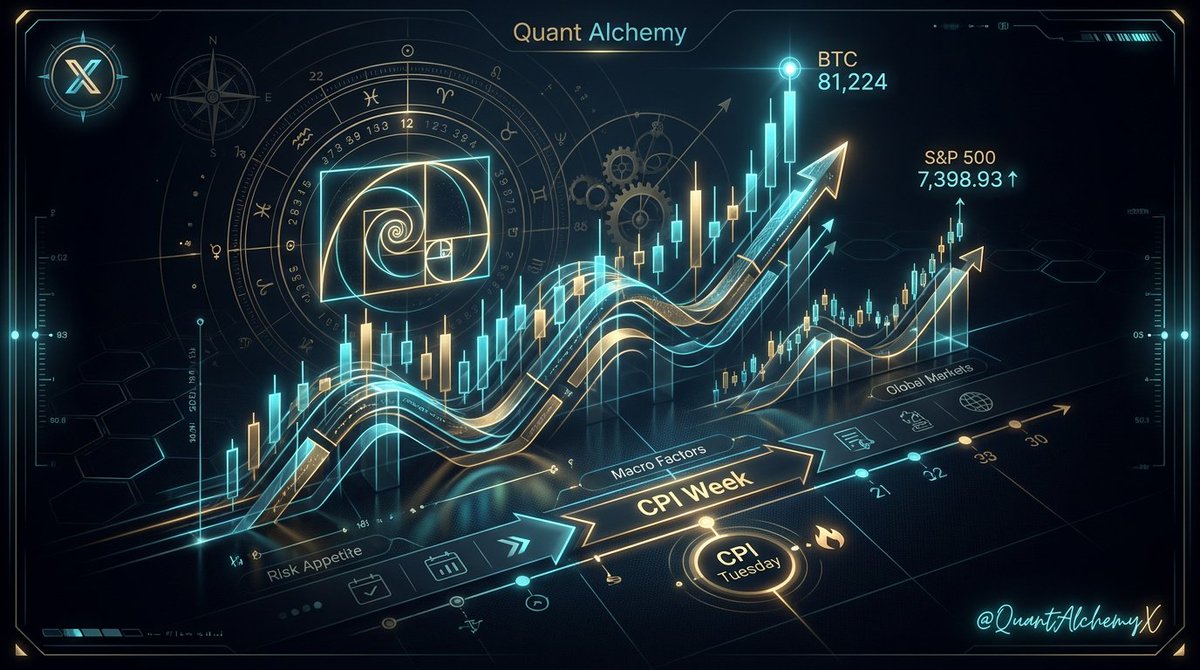
Bitcoin is pressing the first real decision zone of the week, right as inflation day walks onto the stage.
BTC is trading near $81,224 this morning, after opening the week above $82K before cooling slightly. That keeps price pinned just under a major Square of 9 level at $81,374, which matters because reclaimed resistance often turns into the next launchpad. If bulls hold that area, the next levels I care about are $87,179 and then $93,184.
Meanwhile, the S&P 500 finished its last cash session at 7,398.93, still hovering near record territory. Risk appetite has not broken. It has broadened.
This is where the week gets interesting.
Tuesday brings April CPI at 8:30 AM ET. In other words, one inflation print lands directly on a market that is already stretched higher in both crypto and equities. If CPI comes in soft, liquidity could chase the breakout trade and push BTC through that $81,374 magnet fast. If CPI surprises hot, the first question is whether BTC can defend the upper $78K to low $79K region instead of slipping back into failed breakout territory.
From the timing side, May is not just another calendar month. Quant Alchemy's Gann calendar marks May as a stabilization window, and May 19 sits 225 days from the October 6, 2025 BTC high, a 15 squared time count with real confluence. That makes this entire stretch worth respecting, especially if price starts accelerating into next week.
My base case: this is a trend continuation market until price proves otherwise. BTC above $81,374 keeps momentum in play. BTC below $78,923 opens the door to a deeper shakeout. S&P strength says the macro tape is still helping, but Tuesday decides whether that tailwind gets stronger or stalls.
Watch the levels. Respect the timing. Let price action be the arbiter.
If you want more cycle work, Gann timing, and real-world market tools, start at quantalchemy.io
32
May 11
Krown AI in the last 14 days:
- auth shell
- billing foundation
- quota display
- account widget
- brand theme
- analyze flow improvements
- image loading fixes
- data model work
- model execution work
Not saying this to cosplay startup momentum.
I just think there’s real value in showing the build streak while it’s actually happening.
Still early. Still rough in places. But it’s becoming a real product, not just an idea with a landing page.
Join the wait list.
krong.ai/
18
May 7
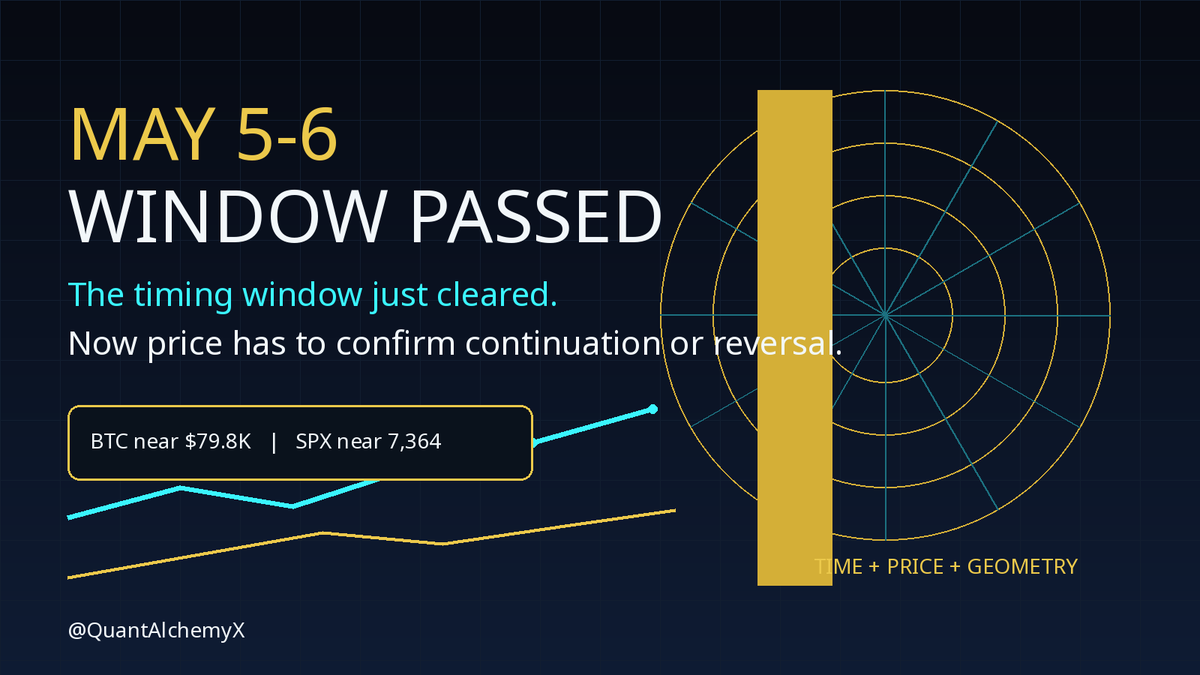
The May 5-6 Gann date just passed, and this is where most traders get it backwards.
These aren't prophecies. They're timing windows.
A window marks acceleration, exhaustion, or trend shift. But price must confirm.
Current setup:
- BTC: ~$79,825, probed low $80Ks
- SPX: ~7,364
Both moved through the window without a clean impulsive break. That matters.
BTC levels to watch:
- Fail to reclaim $81.5K–$82.5K → rotation back to ~$79K support
- Reclaim with conviction → May 5-6 was a pause before continuation
SPX same idea:
- Hold above breakout expand → trend intact
- Slip back under → near-term character change
In Gann work:
Time tells you when to pay attention.
Price tells you what to do.
quantalchemy.io quantalchemy.io
19
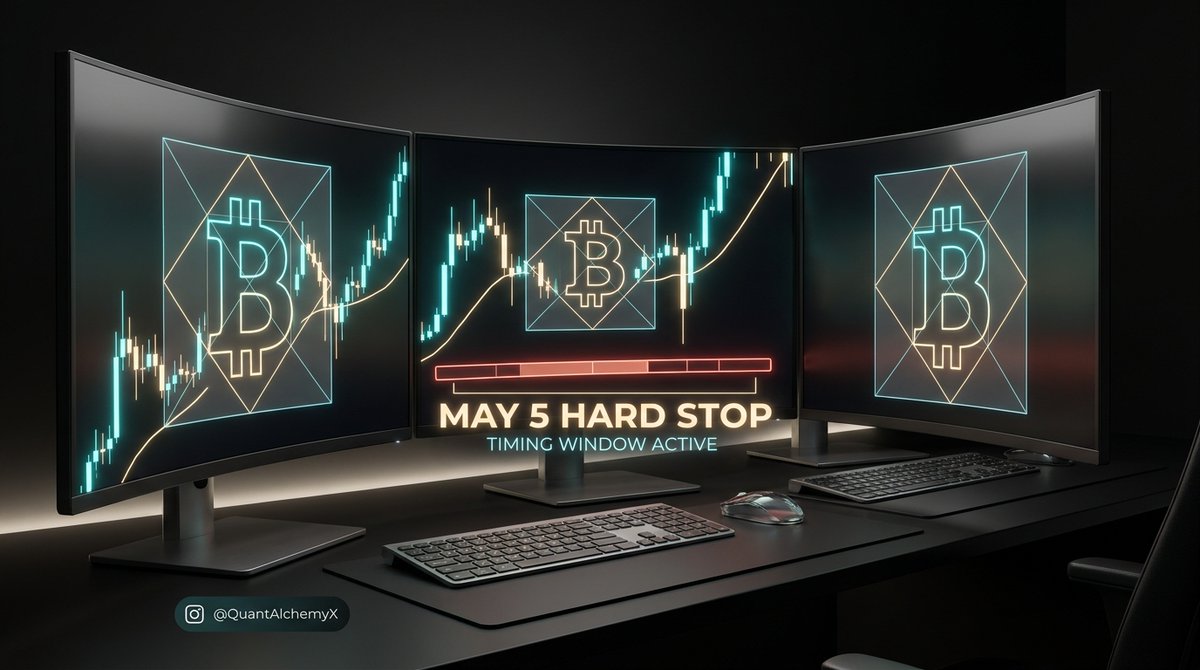
May 5
Markets are entering a timing window that matters more than the headlines.
BTC is trading near $79.9K this morning, right on top of a major Square of 9 level at $78,923, the 20 rotation marker from the 2025 high at $126,210. That matters because the next upside harmonic sits near $81,374, with another larger magnet at $87,179. On the downside, $74,492 and $72,325 are the first levels I would respect if momentum fades.
Meanwhile, the S&P 500 is sitting around 7,230 after pushing fresh highs last week. That looks strong on the surface, but the calendar is getting interesting. Late April is historically where the midterm-year drawdown tends to begin, with the average decline running about 17.3 percent over roughly 115 days. That does not guarantee an immediate drop, but it does argue against complacency.
This week also lines up with a May 5 to May 6 Gann mid-season window. Add Pluto retrograde on May 6, and you have the kind of backdrop where structure can shift fast. I am not interested in prediction theater here. I am interested in levels, timing, and confirmation.
For crypto, the key question is simple. Can BTC hold above the 20 rotation zone and expand toward $81.4K plus, or does it reject and pull back into the mid $70Ks?
For equities, the question is whether buyers can keep squeezing new highs, or whether this becomes the first real crack in the post April momentum.
Price action is still the final arbiter. But this is one of those weeks where geometry, timing, and macro are all starting to rhyme.
If you want market structure, timing work, and tools built for traders instead of tourists, keep an eye on quantalchemy.io
20