
Assessing Market Action with Indicators and History
Joined July 2008
- Tweets 5,176
- Following 131
- Followers 21,135
- Likes 1,123
498 Photos and videos


1
2
37
3,302
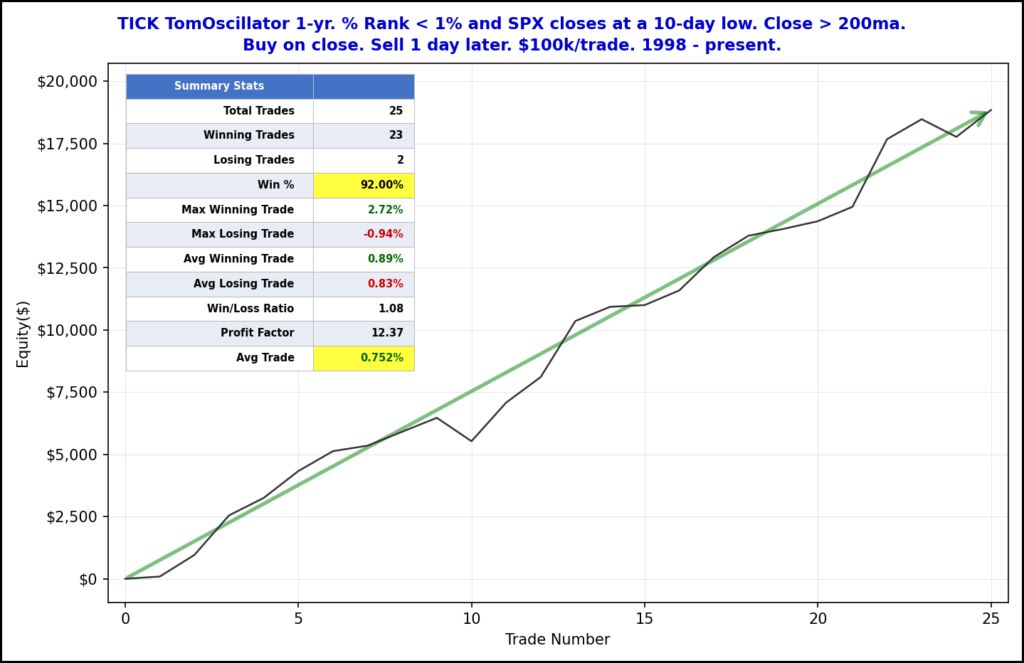
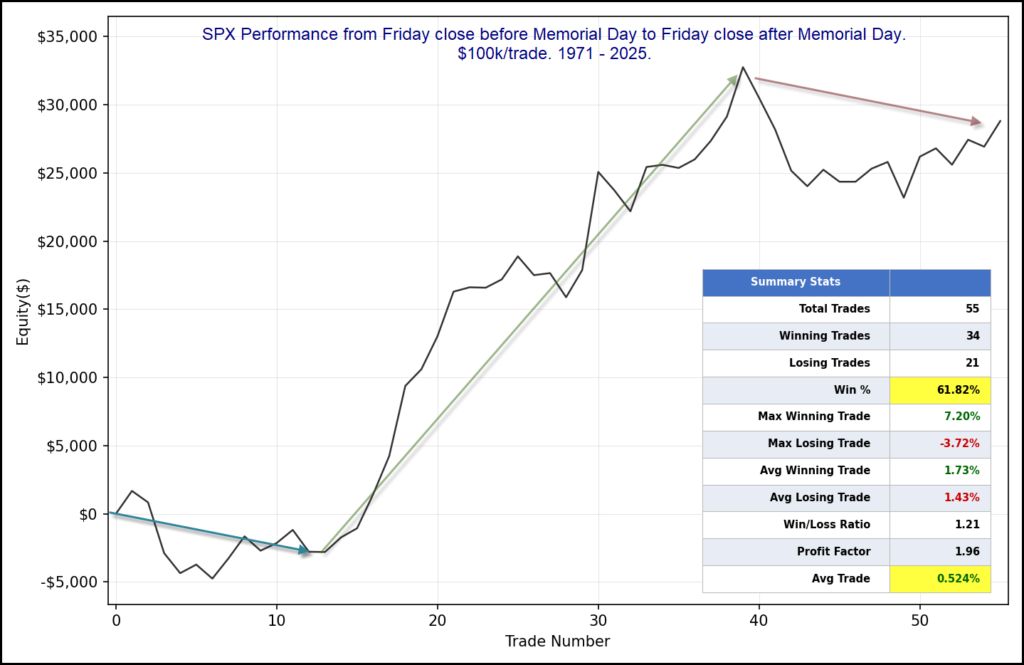
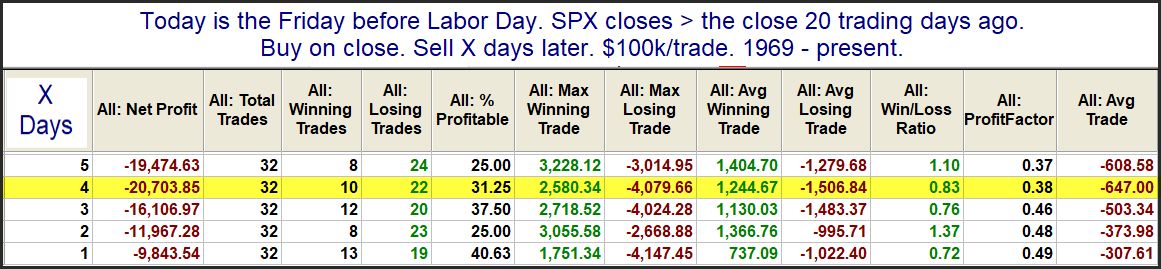
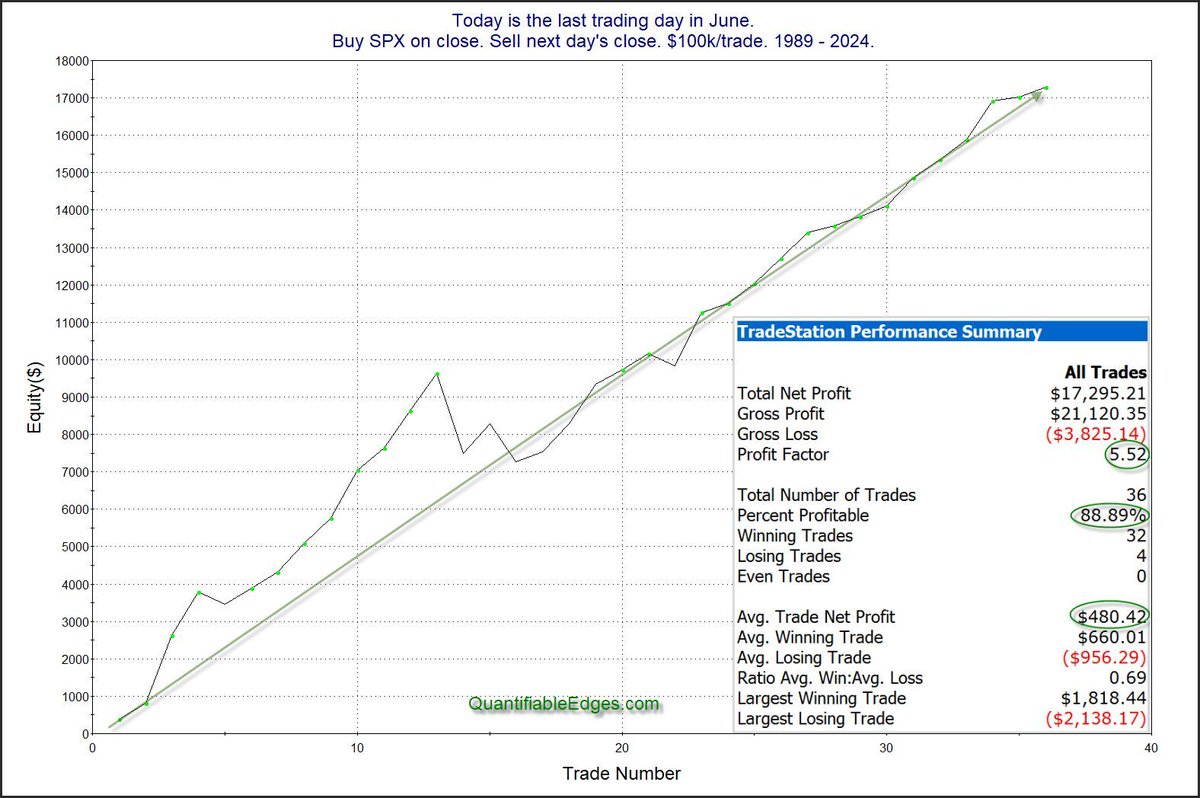
Memorial Week History And The One Day That's Been Consistent
quantifiableedges.com/memori…
$SPX $SPY
1
1
10
2,076
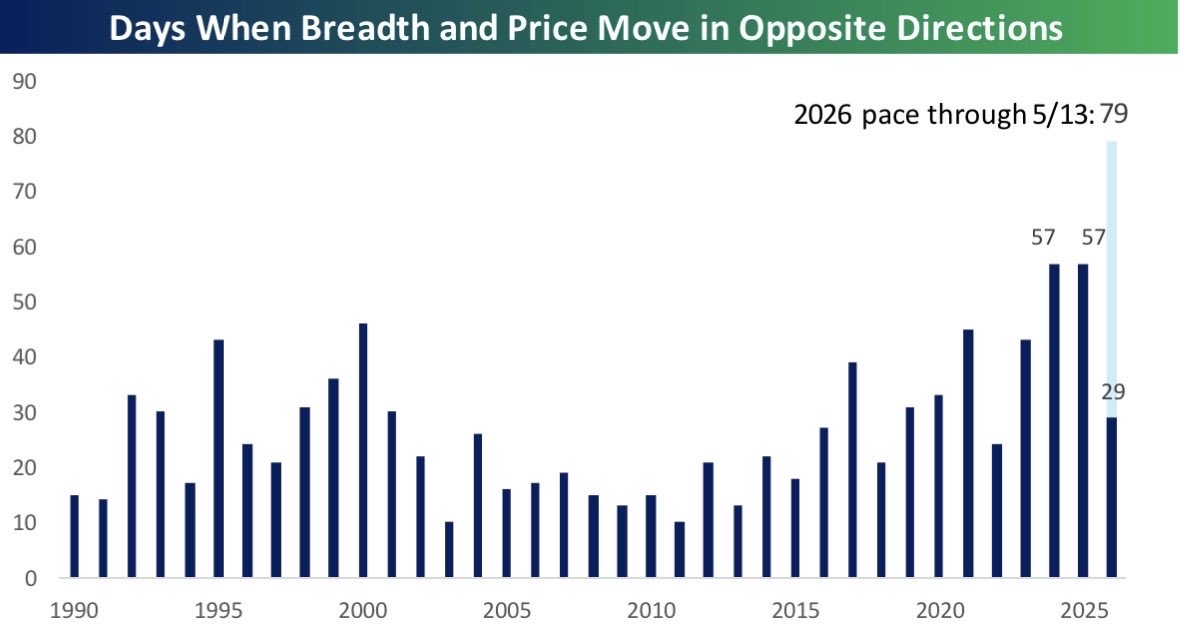
Inspired by @bespoke x.com/bespokeinvest/status/2… I examined # days $SPX direction diverged from SPX adv/decl for every rolling 100-day period 1957-now. Yesterday 5/18/26 was the 32nd day in last 100 that breadth diverged. (15 days up on bad breadth, 17 down on good breadth). Highest reading ever.
May 18

S&P 500 breadth and price are on pace to move in opposite directions on 79 trading days this year, which would easily be a record since 19990. $SPY
2
1
10
2,779
Quantifiable Edges retweeted

May 18
The 2026 NAAIM Founders Award papers are now posted!
Search the full library (2009–2026): naaim.org/programs/find-a-wh…
#NAAIM #FoundersAward #InvestmentResearch #ActiveManagement

1
3
1,868
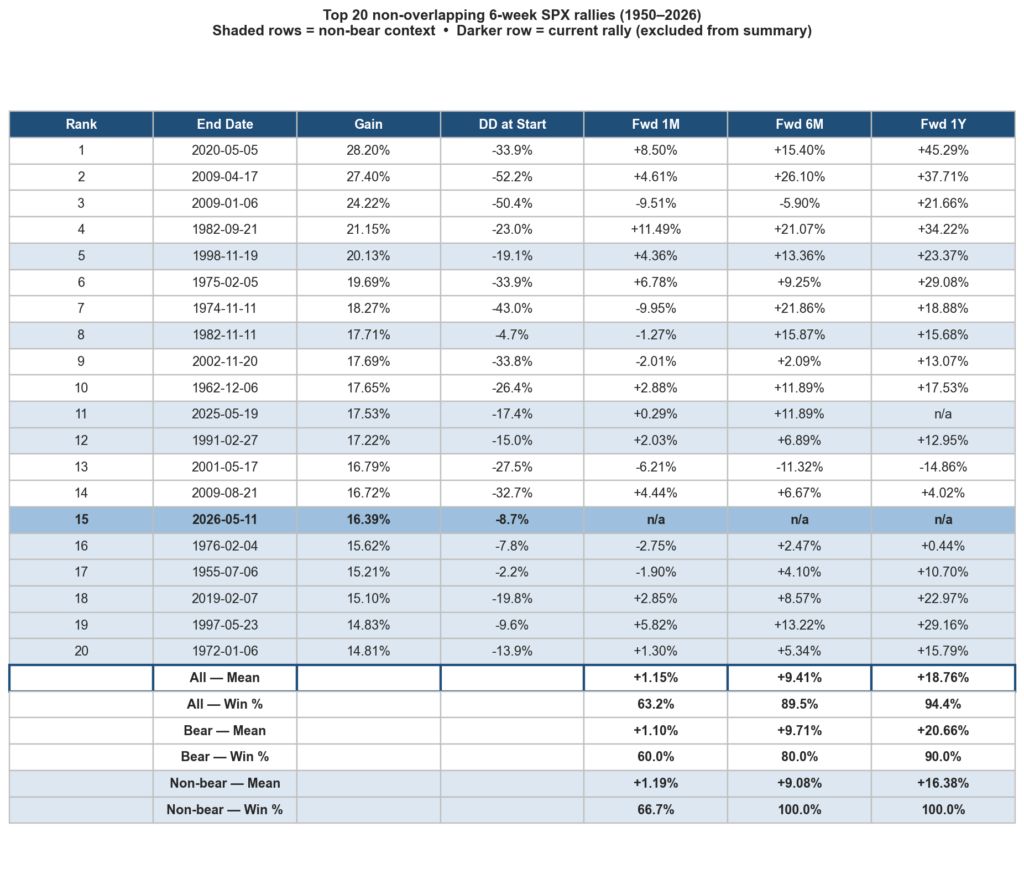
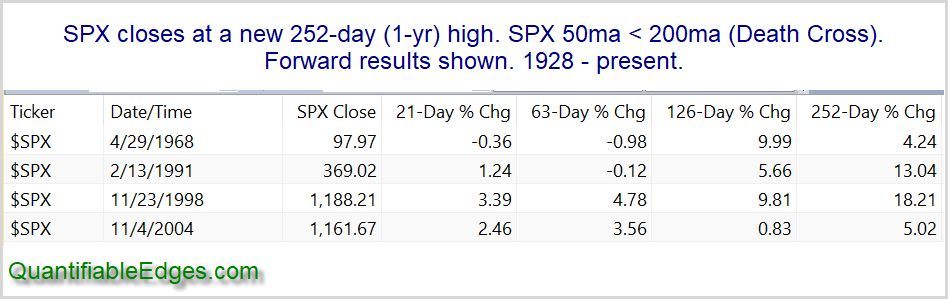
A Historical Look at the Top 20 6-week $SPX Rallies Since 1950
quantifiableedges.com/a-hist…
$SPX $SPY
2
21
3,840
Quantifiable Edges retweeted

May 14
May 11

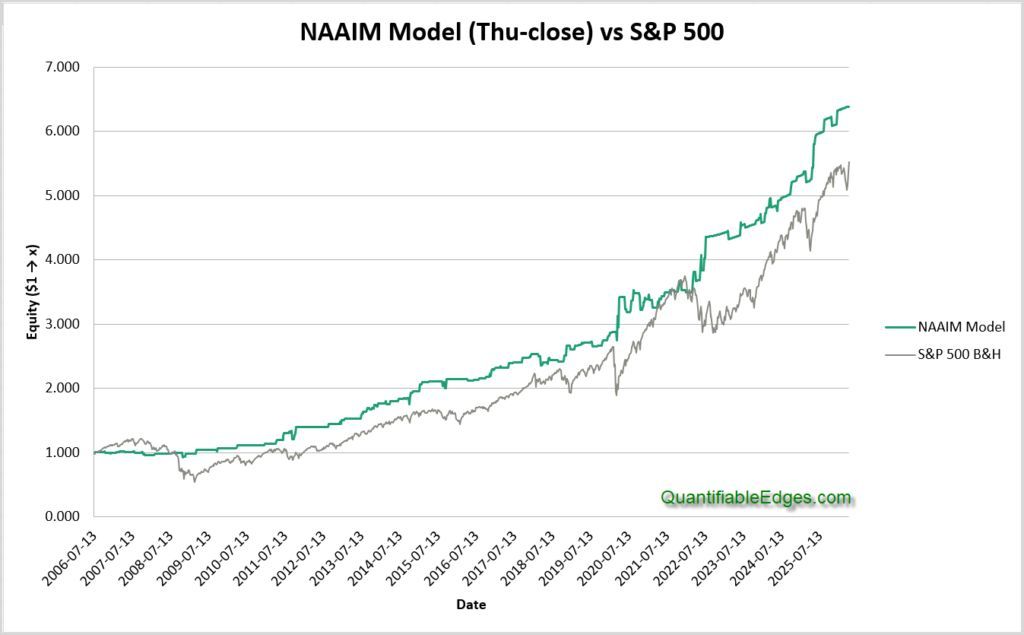
Low drawdowns caught my eye in @QuantifiablEdgs' NAAIM study, so I ran the numbers myself.
The strategy: Go long for 1 week if any of these 3 sentiment triggers hit(I paraphrase the conditions):
Condition 1. NAAIM investors are very pessimistic, but becoming less pessimistic week-on-week.
Condition 2. NAAIM investors are more optimistic than average, and becoming meaningfully more optimistic month-on-month.
Condition 3. NAAIM investors are very optimistic to the point of being leveraged long.
Here's what I found:
- Condition 1 is true only 3-4% of the time, but works fairly consistently with a Calmar ratio > 2/3, which is huge. I would describe this as the rebound after a crash that occurs around the same time as breadth thrusts.
- Condition 2 is true 3-4 times more often than Condition 1, and also works well, but is also more susceptible to data mining. Changing the thresholds (see Rob's article) from 80 and 15 to something else tends to make the results worse.
- Condition 3 does not work as well as Conditions 1 and 2, but is profitable, and compliments the other conditions.
One final comment: Actionable high-Calmar ratio alpha is rare. The performance of such strategies tends to degrade once they are disclosed, so trade with care. All in all, an excellent study.
1
2
2,145
3
2
21
6,059
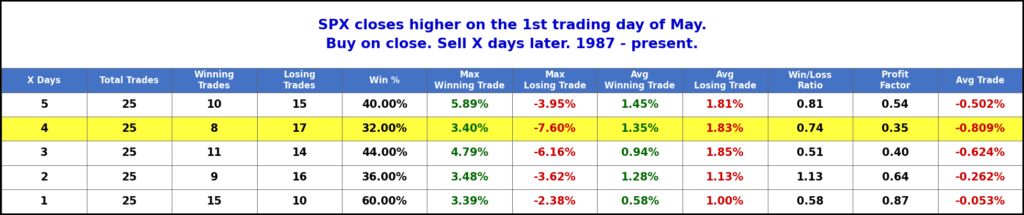
A Strong Start to May Has Often Been Followed by a Short-Term Dip
quantifiableedges.com/a-stro…
$SPX $SPY
1
14
2,670
I'll be going on the NAAIM Confidential podcast in about 30 minutes to discuss a model I built based on the NAAIM Survey, as well as the recent "Scranton Party" Market Rally. Join me here: youtube.com/watch?v=Kzx9... @NAAIM_Official
1
4
1,940
1
6
2,131
Marsten Parker gave a presentation to the Australian Technical Analysts Association a couple of days ago showing how Claude Code can be used in conjunction with Realtest. Exciting possibilities for research! youtube.com/watch?v=RJHz3Kge…
2
2
16
4,784
5yr bond rates closed Feb at the lowest level since Oct of 2024. They are now at the highest level since July of 2025. When rates move that quickly, it makes for a tough market environment.
15
2,259
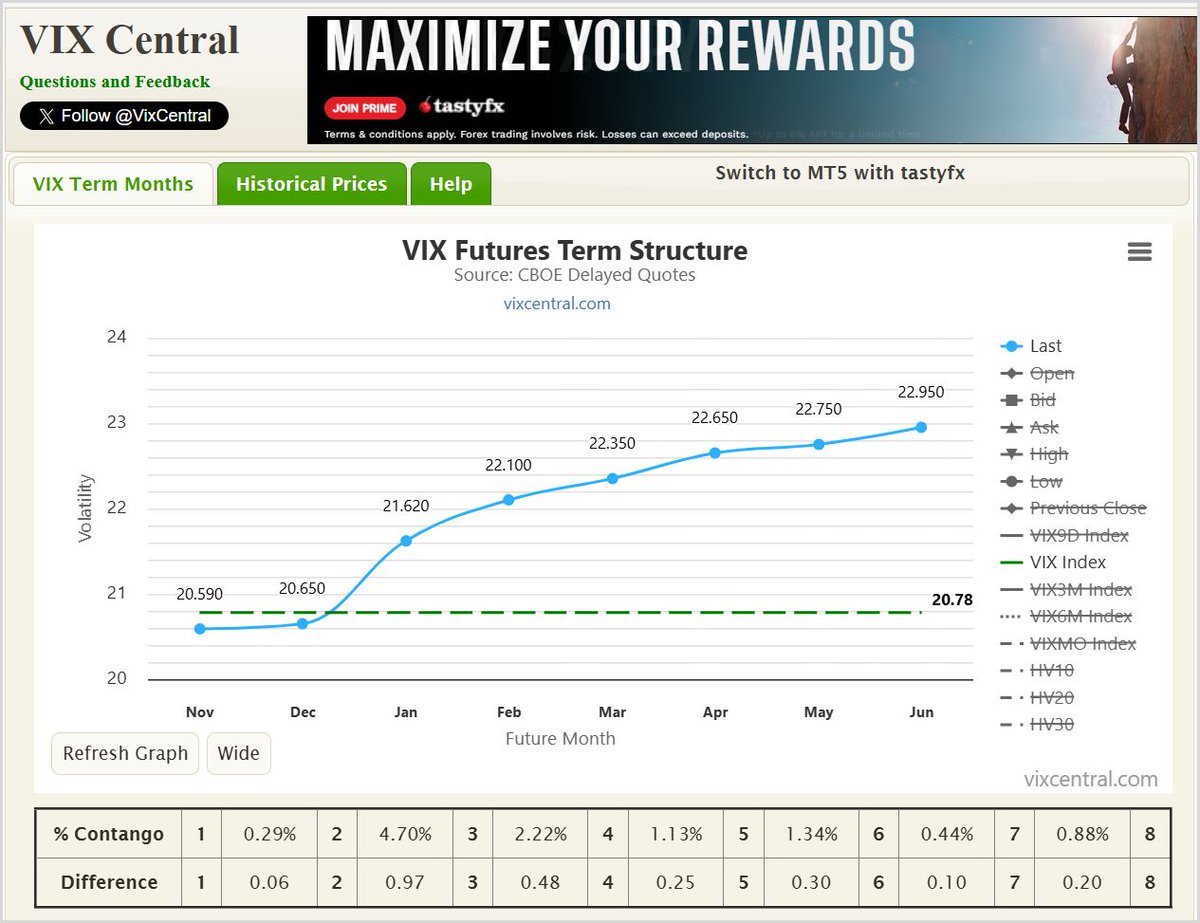
Massive $VIX option trades occurred at 10:11am this morning 100k May 47.5 strike calls and 100k Aug 55 strikes. Most likely a spread trade. For perspective, there was less than 13k Aug 55s open interest before trade went off. Someone making big volatility bets.
2
9
2,195
$VIX reached 28.57 earlier - a little below October high of 28.99. Still no 29 since April tariff tantrum.
11
2,150
6
2,416