
493 Photos and videos


RAF retweeted

Apr 30
Introducing ◉RD Partner Collections 🤝
One of the fundamental issues in the Ordinals space has been that creators were never treated as equal partners by the major marketplaces.
Incentives never truly aligned.
◉RD attempts to change that.
We share 1% (min. 1000 SATS) from our 2.5% fees on every sale with our partners.
There are no additional fees for partnered collections.
Buyer and seller fees always stay the same, whether the sale is from a partnered collection or not.
While this may not be a meaningful amount today, it is about aligning ecosystem incentives for the long run.
If you are interested in becoming a partnered collection, please find details 👇
120
139
560
36,468
RAF retweeted
Mar 13
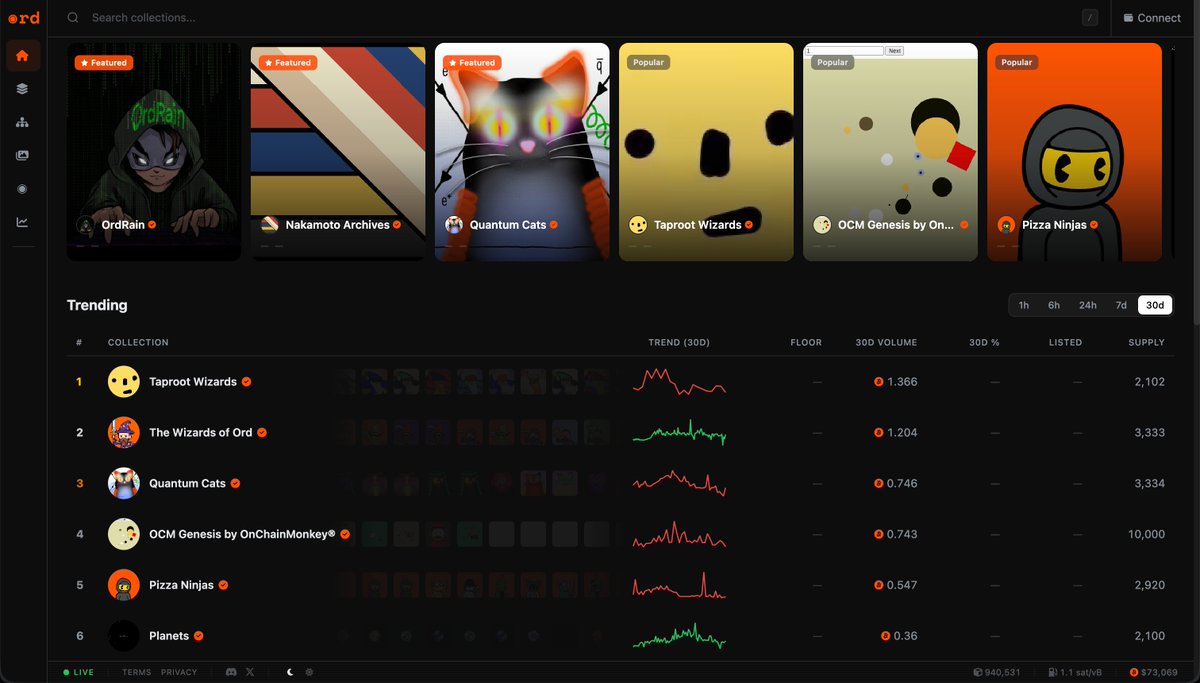
◉ Collector focused
◉ Protocol native
◉ Fully onchain collection data
◉ Indexer and explorer
◉ Open source
…and a lot more
◉RD
274
271
1,100
77,131

🔥 NEW FEATURE 🔥
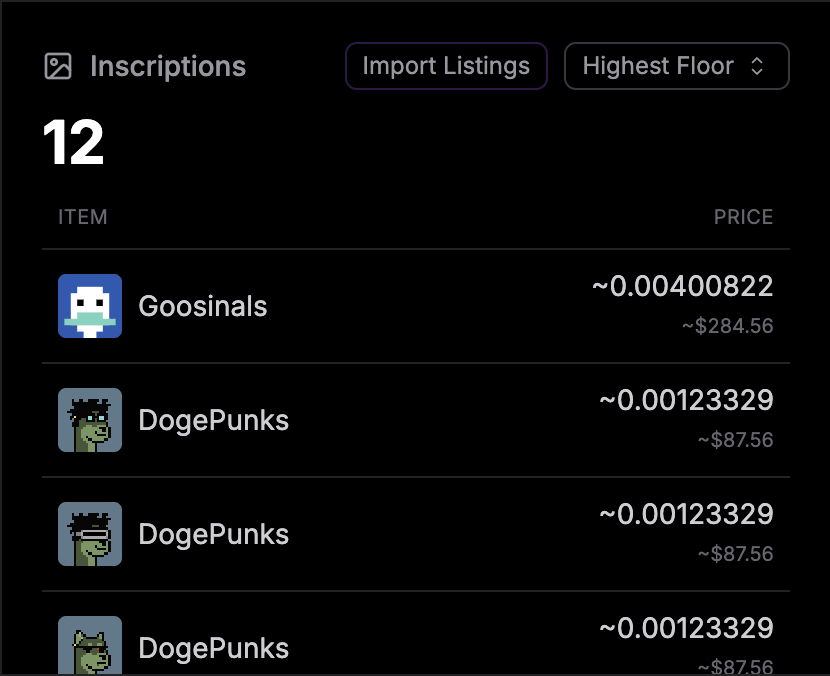
Import all your current listings from Magic Eden is now live on the wallet page.
Just sign in, go to your wallet, and click "import listings" from the inscriptions preview!
5
1
37
1,524
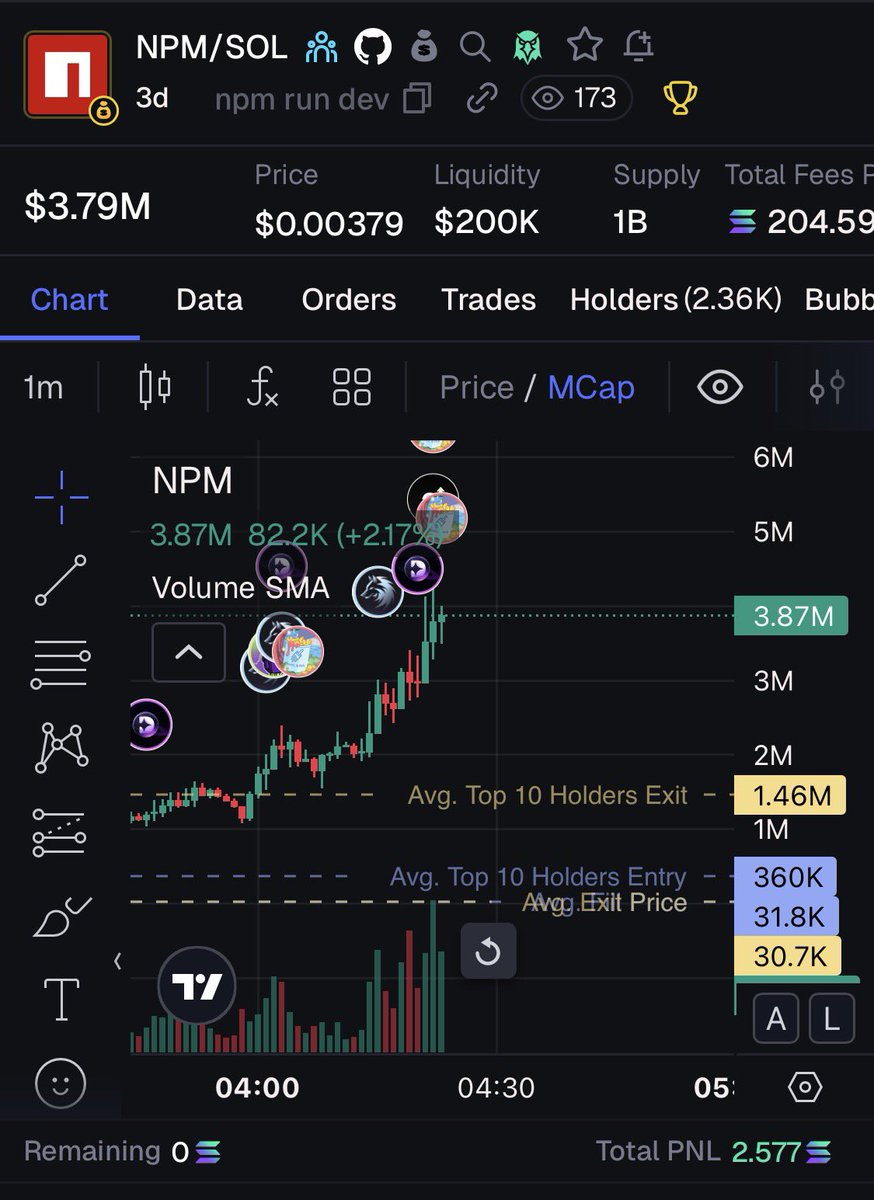
SYSTEM.autogenerate_collection
supply: finite
structure: ordinal_sequence
trait_layer.1: first → base_form
trait_layer.2: second → mutation
trait_layer.3: third → anomaly
rarity:
common < uncommon < rare < mythic
distribution := non_uniform
palette:
indexed, not named
low_index → stable tones
high_index → chromatic drift
rule:
each token inherits order
higher ordinal = lower predictability
mint until entropy > threshold
25
8
60
6,062
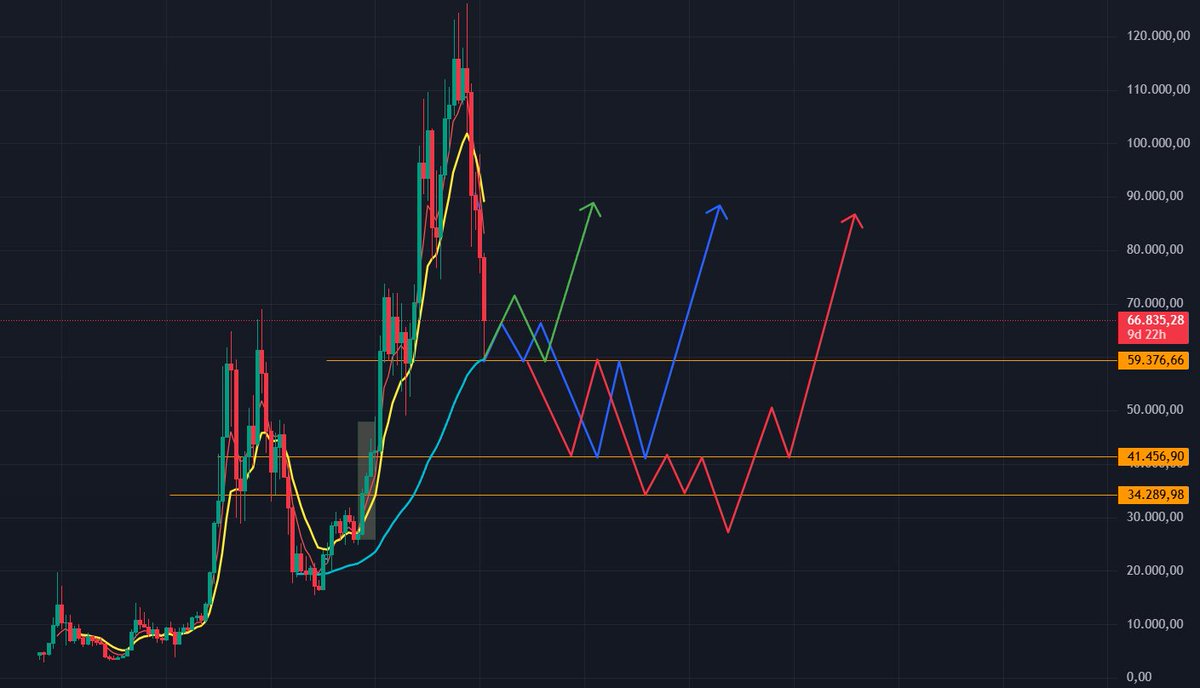
Bitcoin Bear Market Outlook – Multi-Scenario Technical Analysis
As in every bear market cycle, my analysis outlines three potential macro scenarios for BTC, based primarily on monthly structure, key horizontal levels, and the 60-month EMA, as shown on the chart.
Best Case Scenario (Green)
BTC continues to consolidate within the current macro range for several months, allowing price to fully reset momentum and sentiment.
In this scenario, price respects the Monthly EMA 60 as dynamic support, followed by a strong bullish reaction driven by renewed demand and volume expansion.
This would represent a textbook high-timeframe pullback within a broader structural uptrend, with no loss of macro market structure.
➡️ Technically: higher-low on HTF, EMA 60 holds, trend continuation.
Regular Case Scenario (Blue)
BTC initially reacts from the Monthly EMA 60, but instead of an immediate continuation, it enters a prolonged distribution / consolidation phase between approximately $60k–$80k.
After several months of choppy price action:
Price loses the $59k support
BTC transitions into a controlled bearish trend
A proper volume accumulation phase develops at lower levels
This sets the foundation for a new macro impulsive leg once sellers are exhausted and demand re-enters the market.
➡️ Technically: EMA reaction → range → support breakdown → accumulation → trend reversal.
Worst Case Scenario (Red)
A major external catalyst (macro shock, systemic risk event, or crypto-specific black swan) triggers:
A sharp breakdown below $59k
A panic-driven sell-off, potentially pushing BTC below $40k
This would likely be followed by:
Capitulation
Rapid liquidity absorption
A violent upside acceleration as weak hands are flushed and long-term capital steps in
➡️ Technically: liquidity sweep capitulation → V-shaped or compressed recovery.
Key Levels & Corrections from the Chart
A couple of technical clarifications to improve precision:
EMA 60 Monthly
This level is correctly identified as the primary macro mean reversion zone
Historically, reactions here are rarely clean V-bounces time consolidation is more likely than immediate continuation
$59k Level
This is not just horizontal support
It also acts as a range midpoint and HTF acceptance/rejection level
A monthly close below it is far more important than intramonth wicks
Sub-$40k Scenario
If reached, expect high volatility and compressed time structure
Historically, these zones are accumulation opportunities, not prolonged bear ranges
Your projections are consistent with cycle behavior, and the logic behind each path is technically sound.
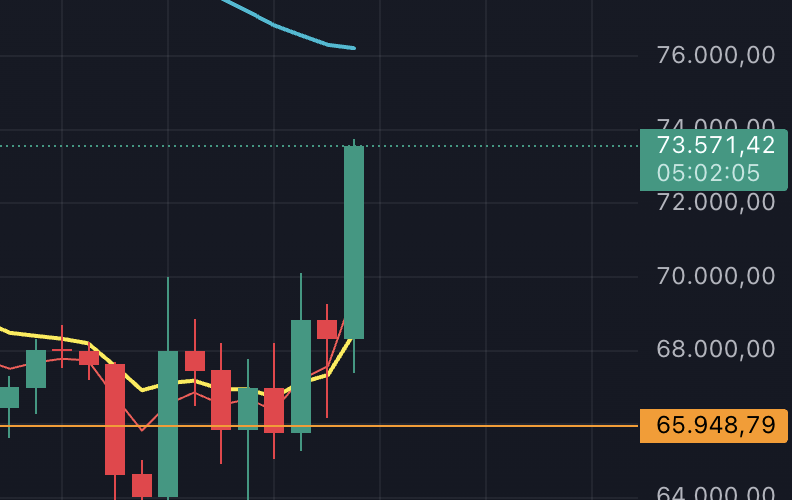
Personal Strategy
Below $60k, BTC becomes my only true DCA zone.
I am not interested in chasing strength — I prefer deeper retracements to optimize long-term entries.
So yes…
Lower prices = better positioning.
5
21
1,771


The most winning move I’ve made in my Web3 journey was meeting people who share my same interests and values, and who are focused on building generational wealth together
This is our scan calendar from the last 30 days. We’ve literally outperformed the market.
This is SOLMAFIA.
11
1
37
1,244
This is an alpha. Onestly

Guide to set up moltbot or tokens? All ive done so far is #1 had claude walk me through locally installing moltbot on my pc
#2 install chrome extension from openclaw
#3 make some markup files telling it to search latest posts on x, dexscreener, birdeye, pumpfun, etc,
#4 analyze the volume. price swings, mcap minimum, time since launch, to give me entry prices.
#5 python trading bot to execute the trades with basic shit stop loss/profit % etc.
3
17
1,349