
Global Stock & Futures Trading Insights | Analysis, Strategies & Edge Tools | FREE/PREMIUM Indicators | Discord.gg/7tWKTTFnJk | #NQ #Gold
- Tweets 14,285
- Following 245
- Followers 10,006
- Likes 22,783

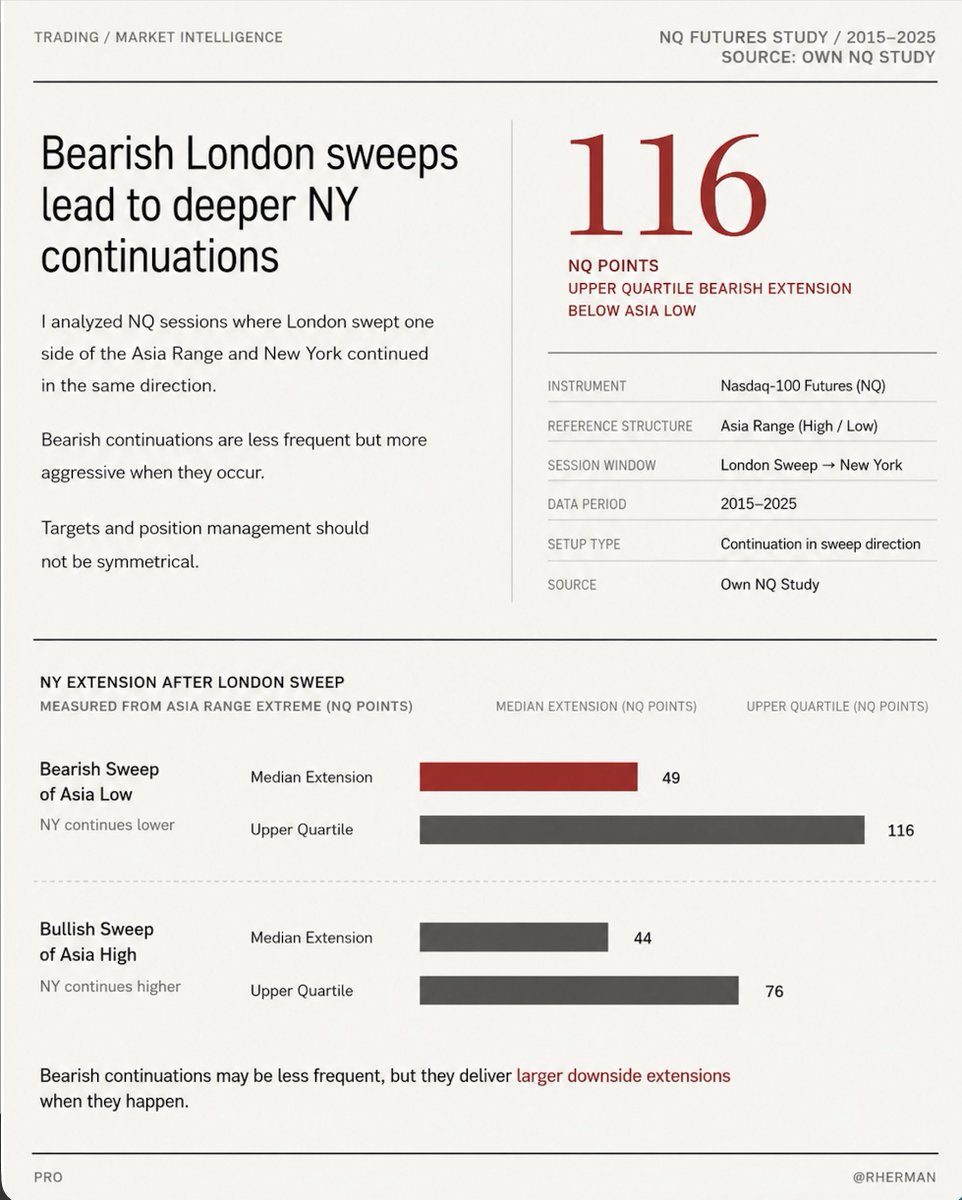


ALT Bullish and bearish London sweeps - historical data on NQ

ALT Mechanical 2R with iFVG during Initial Balance (NQ)

ALT Ania, London and New York study - Historical backtested data on NQ by Herman Trading.
ALT 2R mechanical trade entry on NQ towards the more probable side using iFVG

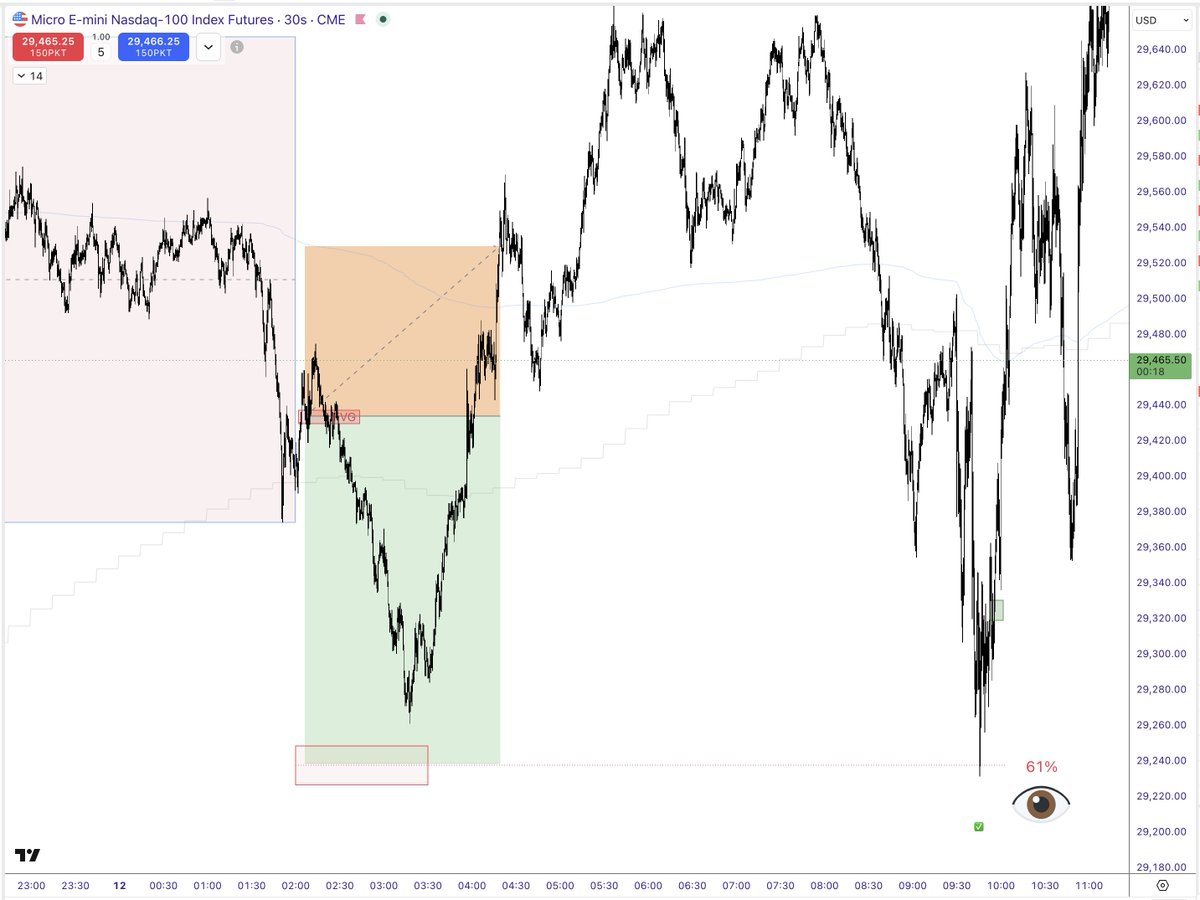
ALT A textbook setup - NQ trading with probabilities.
ALT 63068 average adverse point. NQ historical backtested data on NQ for London session and false breakout.
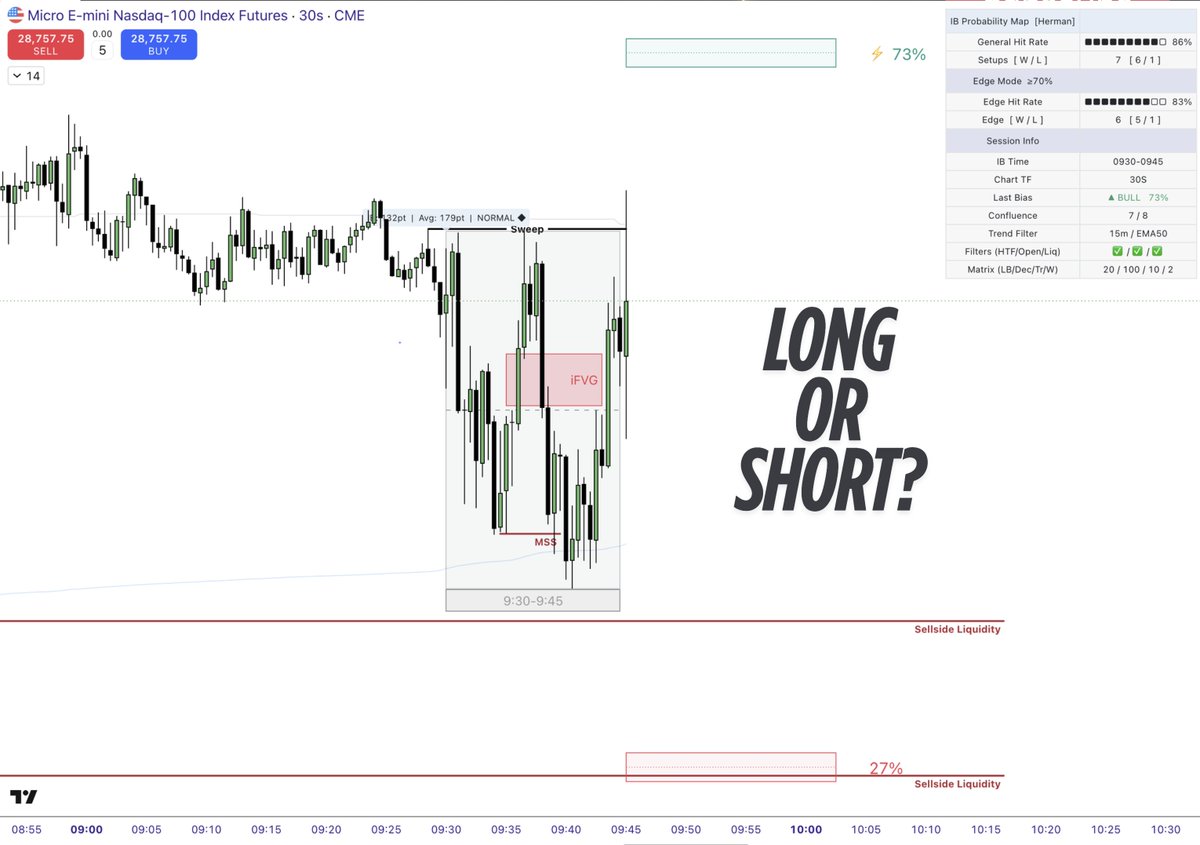
ALT TradingView indicator showing probabilities - 73% for the LONGS on NQ during New York Session.
ALT NQ study - Asia and London session Historical backtested research 2015-2015. 87-89% price revisited original direction after pullback 25% pullback
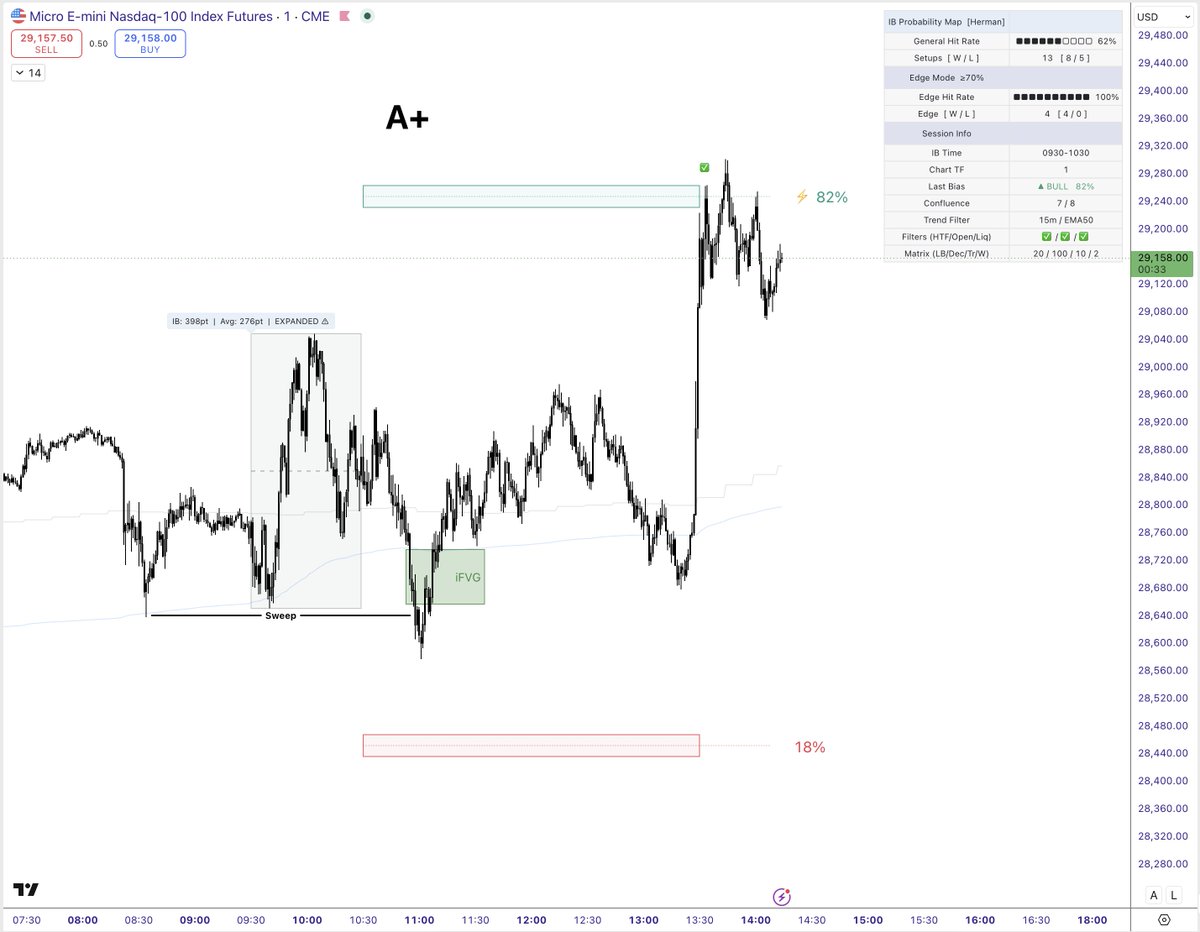
ALT Intelligent Balance - Trading View indicator by Herman Trading showed 82% for LONGS on NQ New York Session.
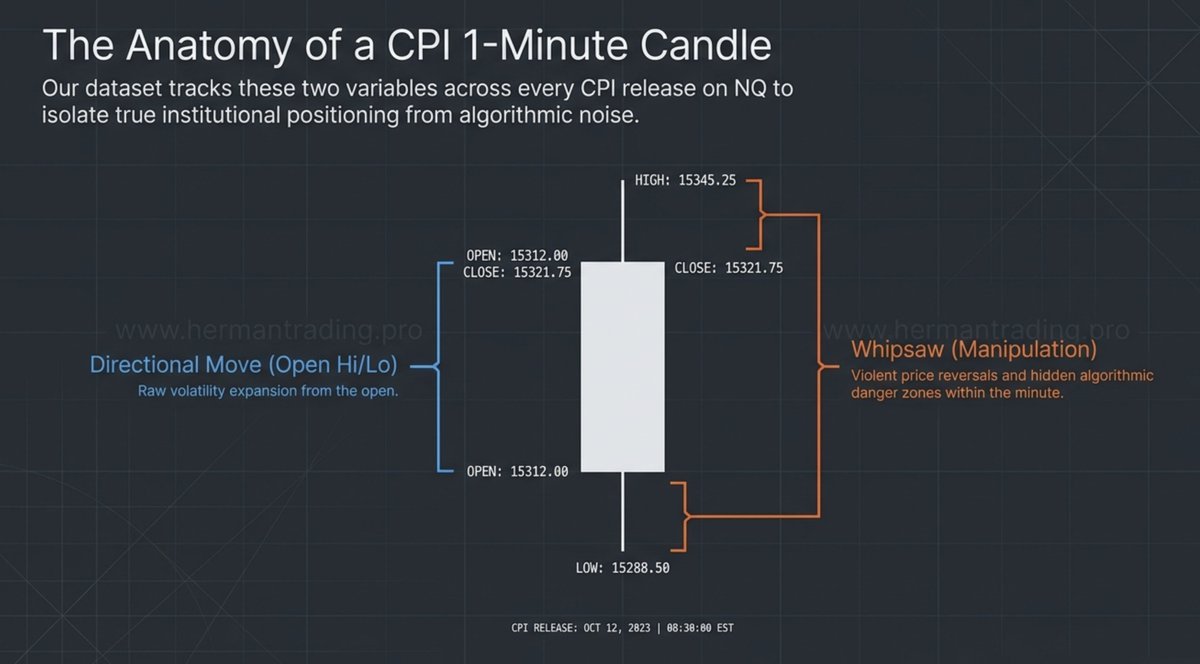
ALT CPI red folder news data and stats for NQ
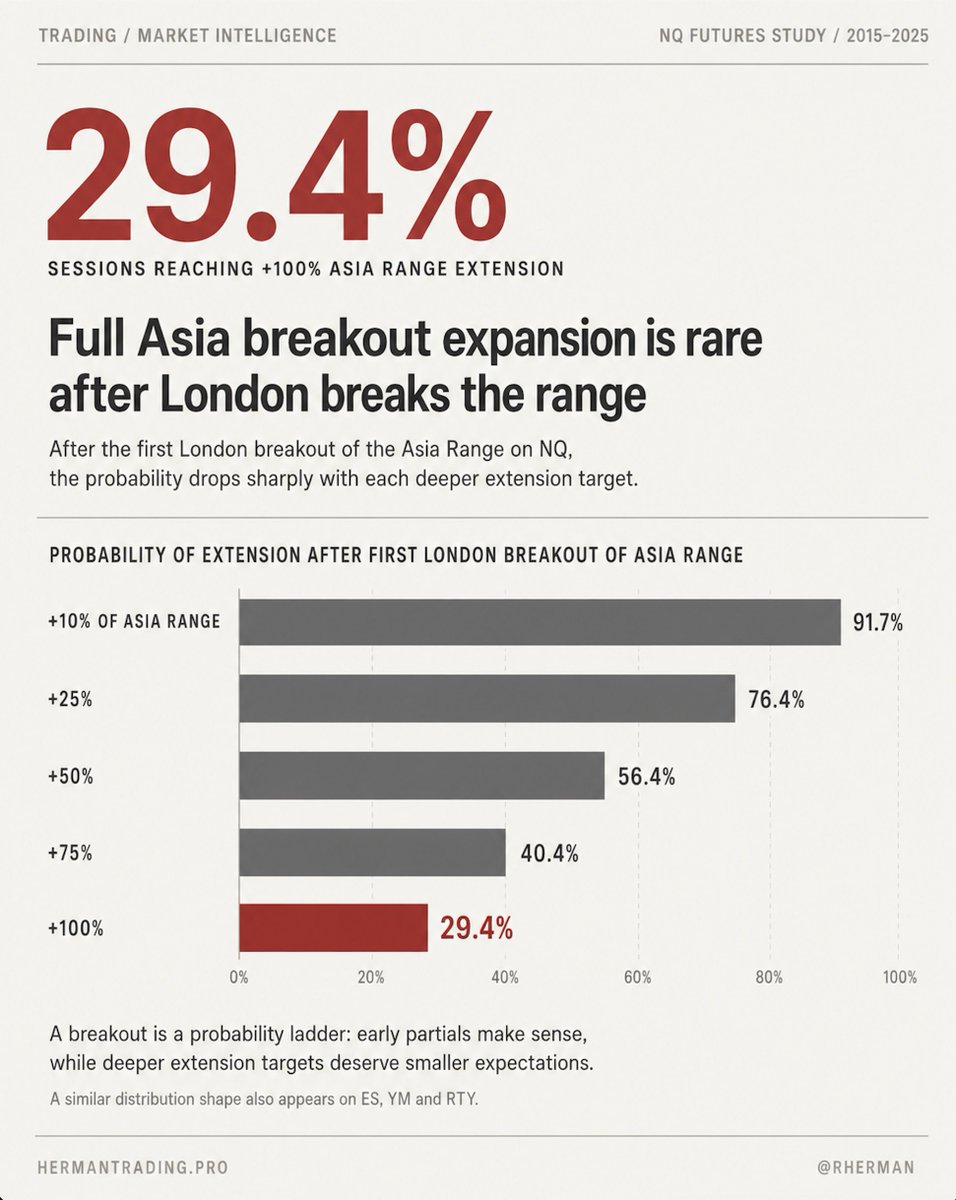
ALT Backtested Historical Data on Asia/London session 2015-2025. 91.7% Breakouts are doing to at least 10% od Asia range.
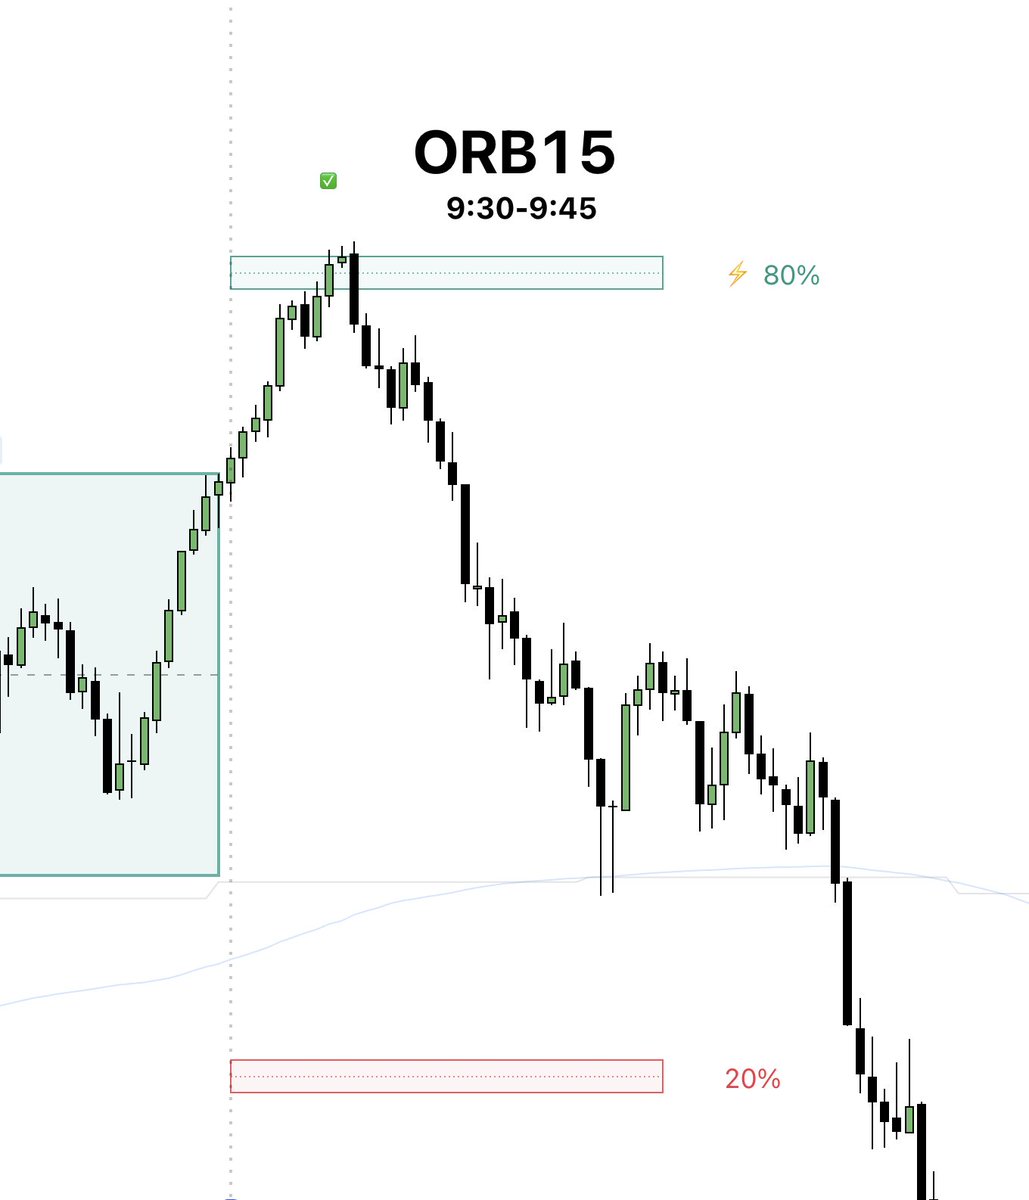
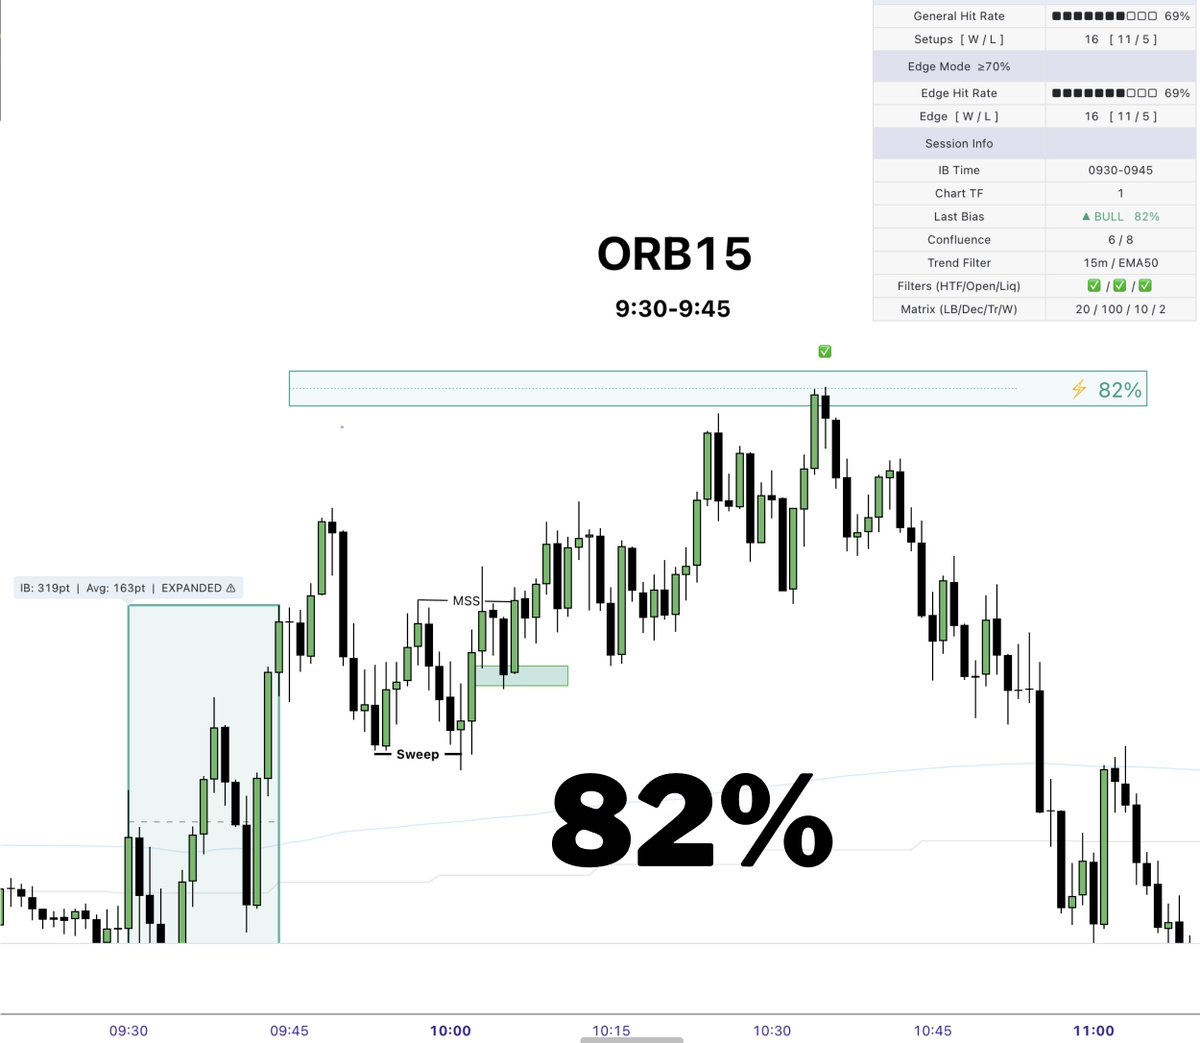
ALT Trading View indicator (Intelligent Balance) showing 80% probabilities for longs on NQ

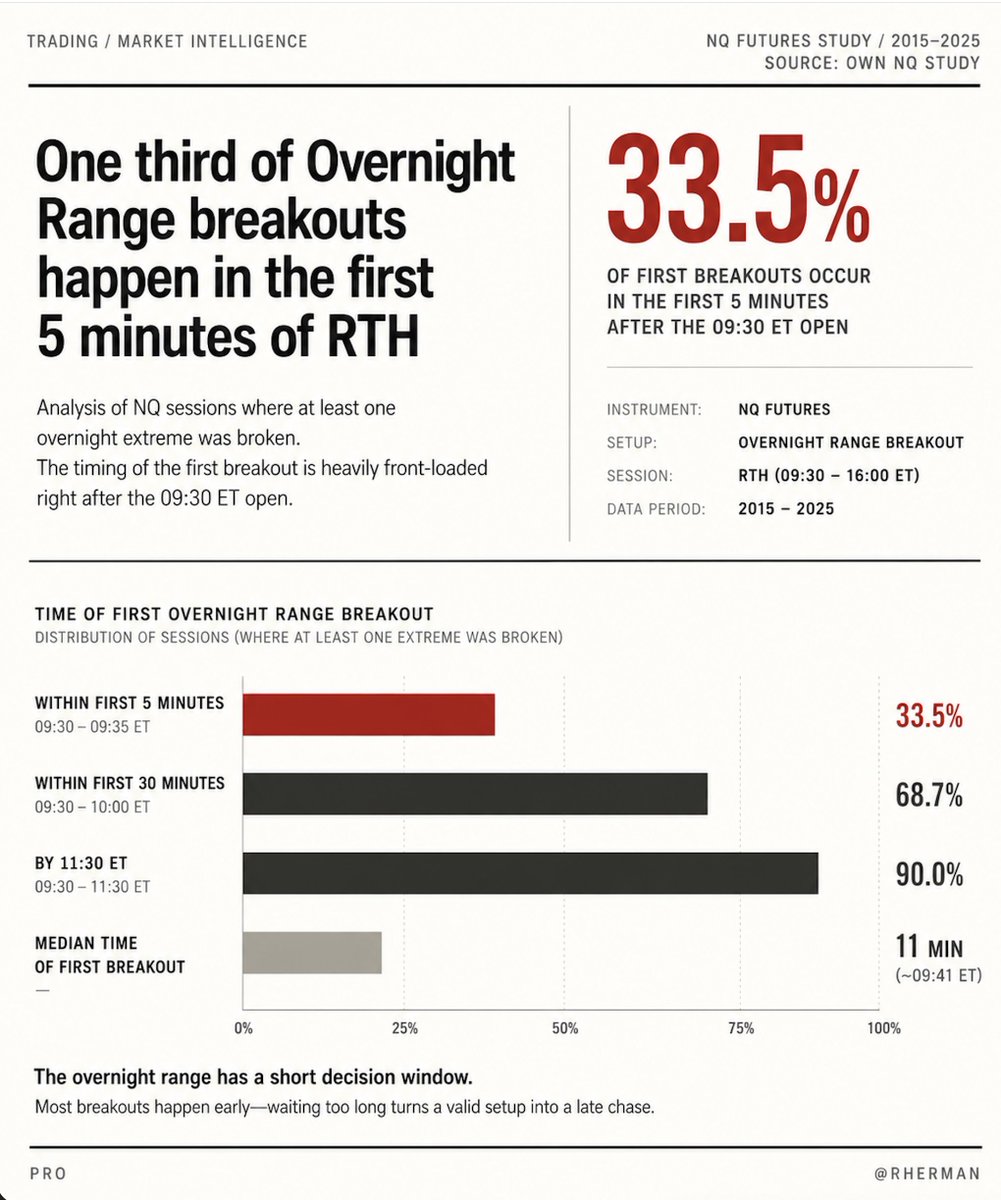
ALT Overnight Range statistical data on NQ studied by Herman Trading

ALT NQ statistical bias 96%, trade entry with iFVG - basic ICT concept.

ALT A company offering everything you need to launch your own prop firm in as little as 10 days.

ALT PDH and PHL historical backtested data on NQ. 77.4 PDH Model.
