
1,890 Photos and videos


Pinned Tweet

Jan 27
Bitcoin will never be the same again — courtesy of @Coredao_Org. ⚡️🔶
What was once a passive, stagnant store of value is being transformed into a fully unlocked, productive asset.
Through CoreDAO, @Bitcoin evolves beyond simply being held or traded. It becomes usable, composable, and economically active without compromising its security.
The world isn’t ready for the bitcoinification of decentralized finance.

7
15
108
3,781
Raymond 🔶🔊 retweeted
Sundays are a good reminder that markets eventually quiet down, but execution doesn't.
When the noise fades, people start paying attention to different things. Not promises, but products. Not narratives, but progress. Not who talked the most, but who kept building. 🏗
That's why bear markets can be surprisingly useful. They make it easier to see which teams are still moving forward when there are fewer reasons to chase attention.
With Monopoly World still ahead and the broader @Realitymeta ecosystem continuing to develop, $RMV remains one of the projects I'll be watching closely. 👀

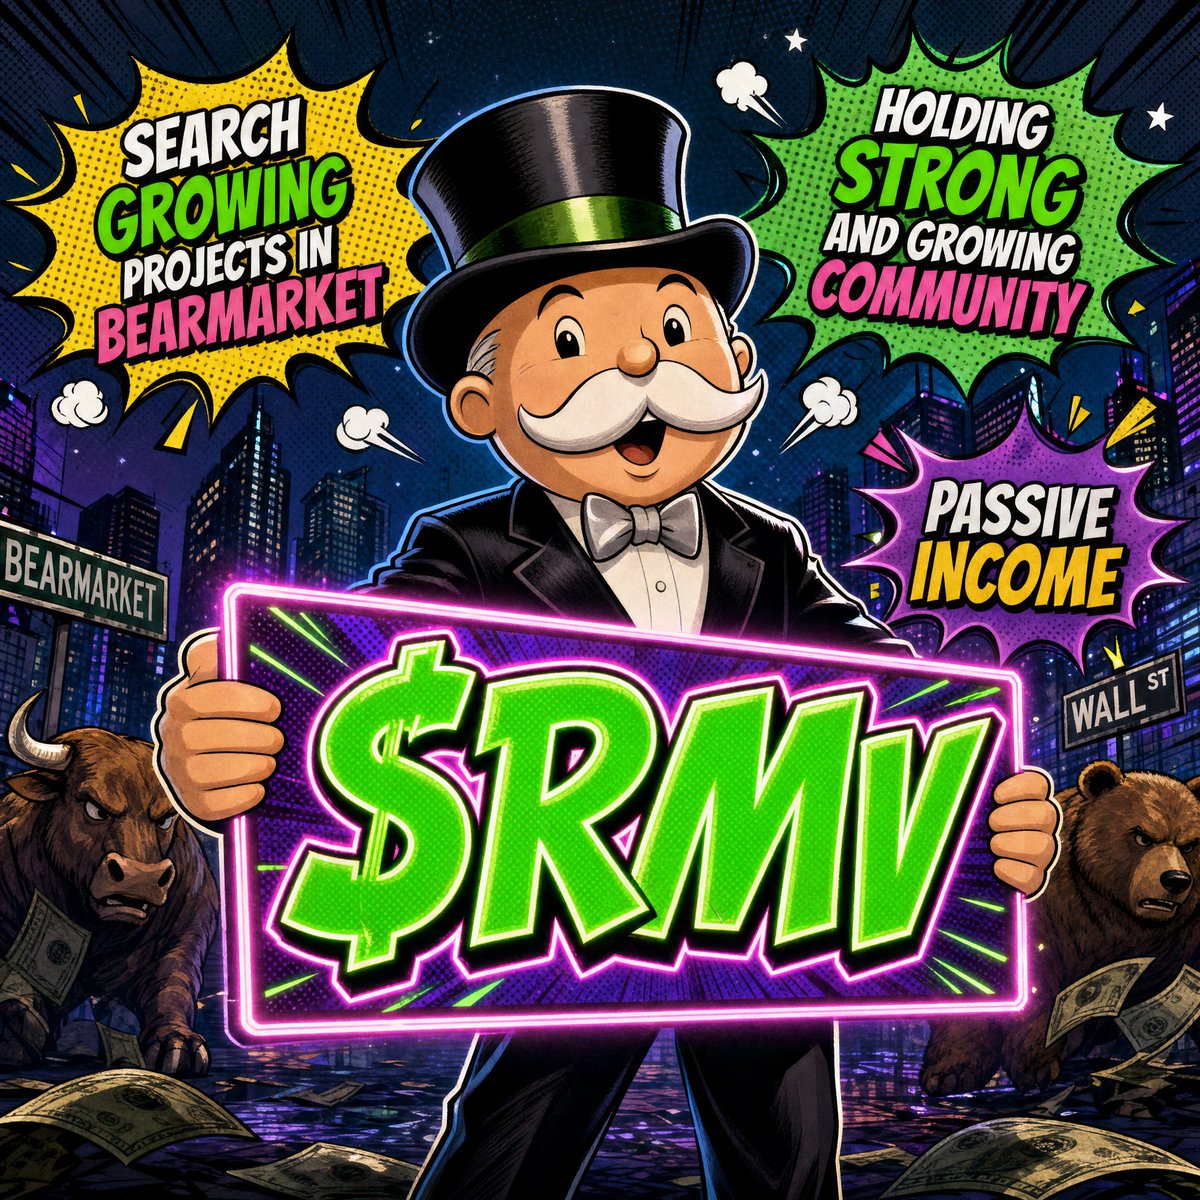
Bearmarket 🐻 RULES ‼️
- find Project with active Team
- find an active Community
- a stable growing Chart
- working product
- Doxxed Team and registered company
Here comes $RMV @Realitymeta , soon with a huge #MONOPOLY Smartphone Game and passive income 👀
NFA DYOR
#RWA #GAMING

3
9
37
Raymond 🔶🔊 retweeted
One thing I think people underestimate about the @Realitymeta ecosystem is how interconnected everything is. 🌐
A lot of projects launch a game.
Others launch NFTs.
Others build a token economy.
But they're often treated as separate products.
What's interesting about Reality Metaverse is that the pieces appear designed to reinforce one another.
The upcoming Monopoly World launch is a good example. 🎲
Most people see another game entering the ecosystem.
What they may not be considering is how new players can affect everything around it.
More players means more attention.
More attention means more activity.
More activity can create greater visibility across the ecosystem, from Country, City, and Landmark NFTs to wNFTs and the broader $RMV economy.
If that plays out, @_MonopolyWorld won't just be a game launch.
It could become one of the clearest examples of how growth in one part of an ecosystem can benefit everything around it. 📈
3
3
27
592
Raymond 🔶🔊 retweeted

Jun 12
AI that treats you like an adult.
Uncensored. Unbiased. Unfiltered.
Everything you can do with AI. Now private.
6
4
40
513
Raymond 🔶🔊 retweeted

5 Aug 2022
A public chain that is not decentralized enough cannot accommodate geopolitical contradictions, nor can it become the standard bearer of the new global order. #CoreDAO
1,036
4,182
14,481
Raymond 🔶🔊 retweeted
Jun 11
Doctors, lawyers, therapists, journalists, founders, investors.
The more sensitive the work, the more privacy matters.
Everything you can do with AI. Now private.
1
5
36
588
Raymond 🔶🔊 retweeted
Jun 12
One thing I've been thinking about lately is how little we actually own online. 🤔
We own our homes. 🏡
We own our cars. 🚘
We own our clothes. 👕
But most of the digital experiences we spend thousands of hours in are built around assets we don't truly control.
Skins. 🎨
Items. 🛒
Land. 🏞
Progress. 📊
They're often tied to platforms that can change the rules at any time.
That feels increasingly out of place in a world where more of our lives are moving online. 📱
I think the next phase of digital experiences will be less about access and more about ownership.
Not just playing in digital worlds.
But actually having a stake in them.
That's one of the reasons the @Realitymeta ecosystem continues to capture my attention.
Whether it's virtual property, geo-location experiences, digital assets, or the broader vision being built around ownership, it all points toward the same question:
What happens when people can truly own a part of the digital experiences they spend time in? 👀
It's a question I think becomes increasingly important as more of our lives move online.
$RMV
9
3
42
253
Raymond 🔶🔊 retweeted
Jun 11
Most people focus on price. 📈
Fewer people focus on what price is responding to.
What I find interesting about the observations shared here is that $RMV appears to be behaving differently from much of the broader market.
If an asset is beginning to move in line with liquidity expansion while also showing resilience during liquidity contractions, that's not something to ignore.
Not because it guarantees future performance.
But because it may suggest a deeper relationship forming between liquidity, utility, and market behavior.
Worth watching closely. 👀
Jun 11

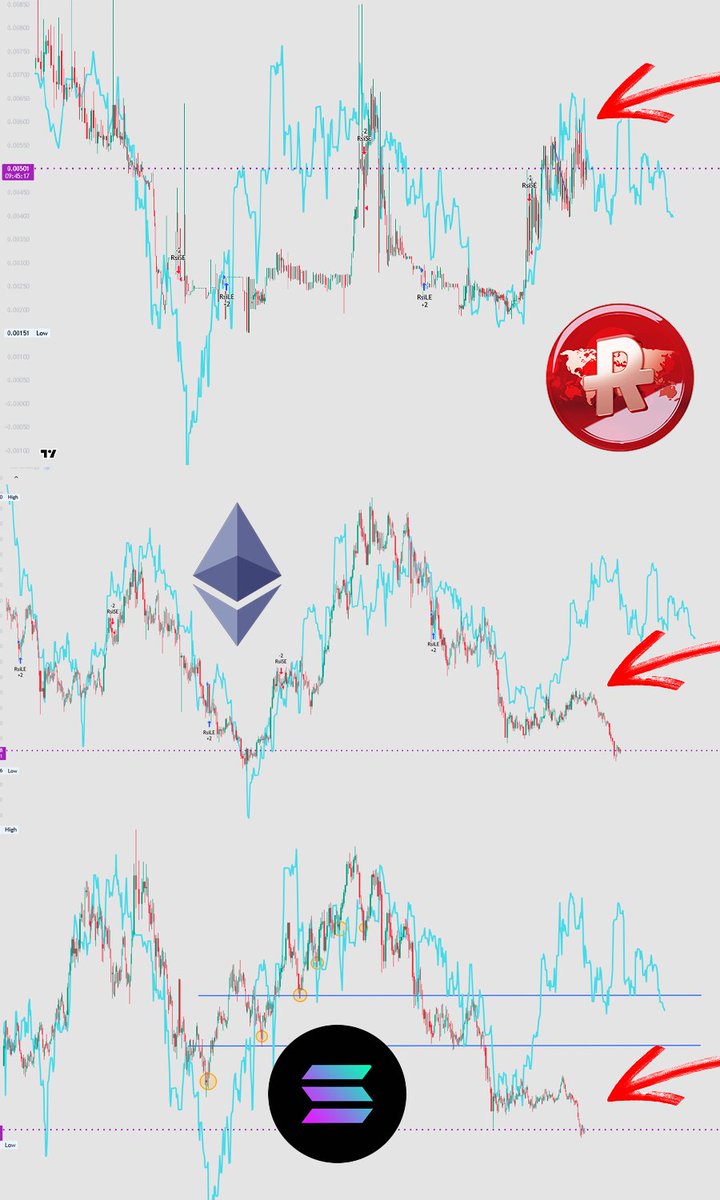
🚨 I got quite a few questions about the Global Net Liquidity chart and $RMV.
So I put this visual together.
The blue line shows Global Net Liquidity.
Top: $RMV
Middle: $ETH
Bottom: $SOL
What stands out to me is that while $SOL and $ETH, like most of the market, only saw a relatively modest move before stalling, @Realitymeta actually moved exactly to what Global Net Liquidity would suggest.
Of course, there could be multiple reasons for that.
🕵️ RMV isn't listed on the major exchanges yet, which in my opinion may result in less short-term market distortion. (manipulation)
🛠️At the same time, the project has strong utility, growing adoption, and a major wNFT event on the horizon. Those fundamentals can create additional strength.
🧐Another interesting observation is what happens during liquidity pullbacks.
When Global Net Liquidity dips, RMV appears to hold up better than both ETH and SOL, with noticeably shallower drawdowns.
🫡 One chart doesn't prove anything.
But it is fascinating to see that while much of the market seems disconnected from Global Net Liquidity, RMV has started behaving almost exactly how the liquidity cycle would suggest.
And even during the dips, RMV has shown relatively shallow drawdowns compared to ETH and SOL.
Definitely something worth paying attention to.
5
3
35
458
Raymond 🔶🔊 retweeted

🎙 Monthly AMA | 16th June, 13:00 UTC
Join us live and earn 200 VIP Points!
👉 realitymeta.io/events/ama/45
1
2
3
228
Raymond 🔶🔊 retweeted

“If justice truly existed, prisons would be filled with politicians, not the poor.”
- Niccolo Machiavelli

97
3,785
10,975
120,070
Raymond 🔶🔊 retweeted

Jun 10
My beliefs: Retweets are notifications, not endorsements. Constructive dialogue leads to better outcomes. Bitcoin is hope and economic empowerment for everyone. Every good-faith effort to strengthen the network should be welcomed.
1,129
1,167
10,964
643,714
Raymond 🔶🔊 retweeted
Jun 10
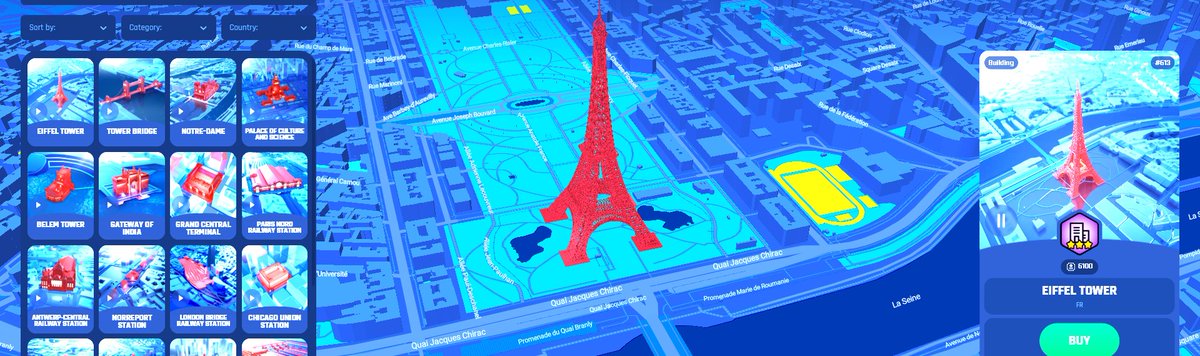
What stands out to me isn't just the AAA ambition. 🎮
It's the idea of transforming the real world into a living game map. 🌍
Every city already has landmarks.📍
Every community already has players.🚶♂️
Every journey already has destinations worth discovering. 🧭
Geo-location gaming feels inevitable to me because it builds on behaviors people already have.
But the missing piece is a system that connects those experiences to ownership and progression.
That's the vision behind @Realitymeta's geo-location ecosystem.
The potential here goes far beyond launching another Web3 game. 🌍
$RMV

1/1 REAL WORLD IS THE NEXT FRONTIER IN DIGITAL SPACE
People will go outside, walk miles, and spend real money when a game is tied to the real world around them. Geo-location gaming isn't a trend. It's a category. And it's still in its early stages.👇
11
4
39
447
Raymond 🔶🔊 retweeted
Jun 9
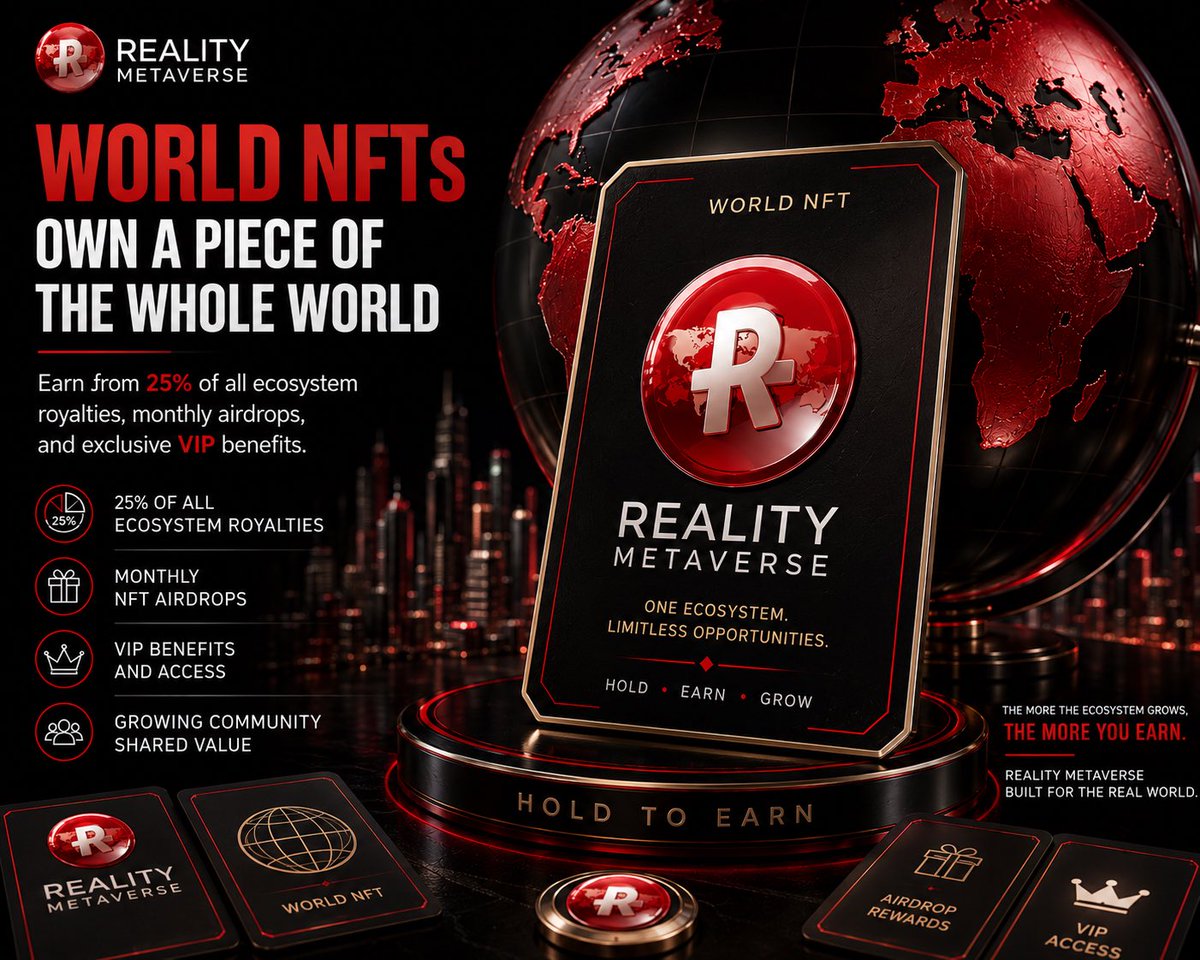
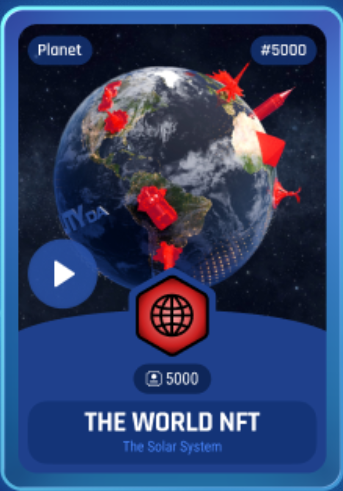
Really impressed with how @Realitymeta is approaching World NFTs. 👏
Giving holders a share of 25% of ecosystem royalties creates strong alignment between the platform and its community as it grows.
Instead of chasing the performance of individual assets, holders can simply participate in the broader $RMV ecosystem while benefiting from monthly NFT airdrops and VIP perks. 🌎
It's an interesting model that rewards long-term participation and community growth. Looking forward to seeing how it develops with the Monopoly World global launch. 🔥
$RMV
NOT "JUST ANOTHER" NFT
1/3 Most NFT projects tie your yield to one location's performance.
World NFTs (wNFT) in the $RMV ecosystem work differently.👇
7
4
38
592
Raymond 🔶🔊 retweeted
2/2 $RMV is building its flagship AAA geo-location game right at the centre of it backed by one of the world's most recognised gaming brands and a studio with 30M downloads.
The real world is the next frontier. 🎩
#RMV #RealityMetaverse #Web3Gaming #HoldToEarn
1
2
5
194
Raymond 🔶🔊 retweeted
1/1 REAL WORLD IS THE NEXT FRONTIER IN DIGITAL SPACE
People will go outside, walk miles, and spend real money when a game is tied to the real world around them. Geo-location gaming isn't a trend. It's a category. And it's still in its early stages.👇
2
3
9
1,493