
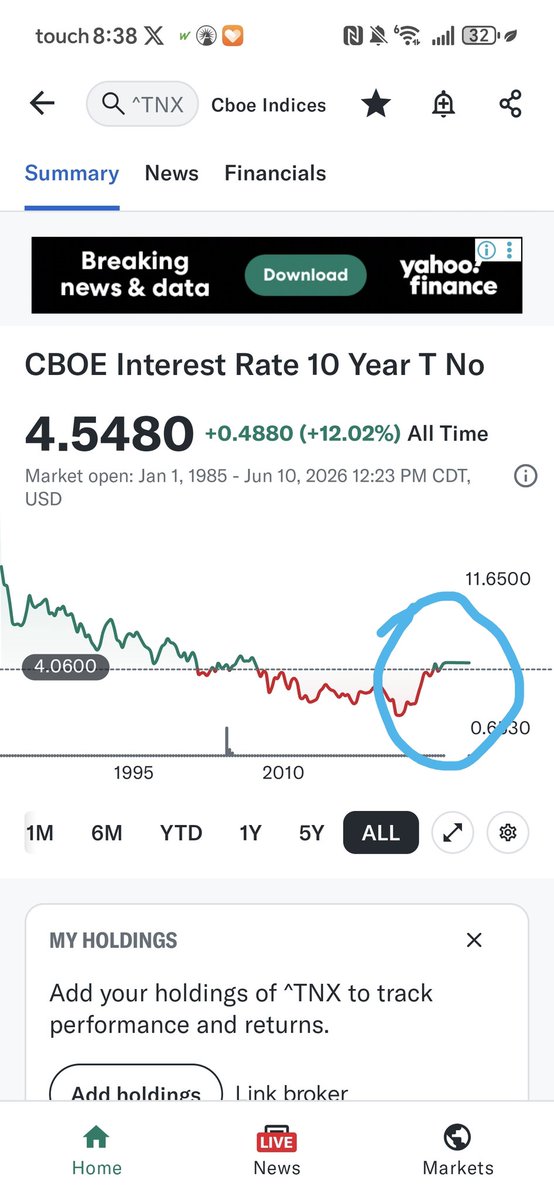
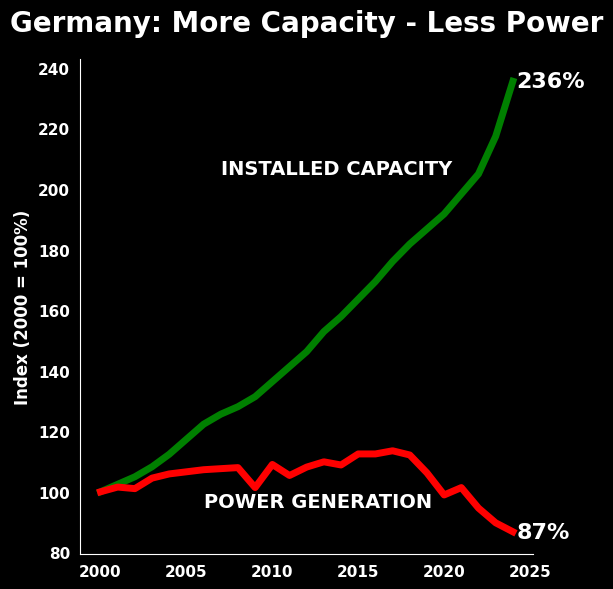
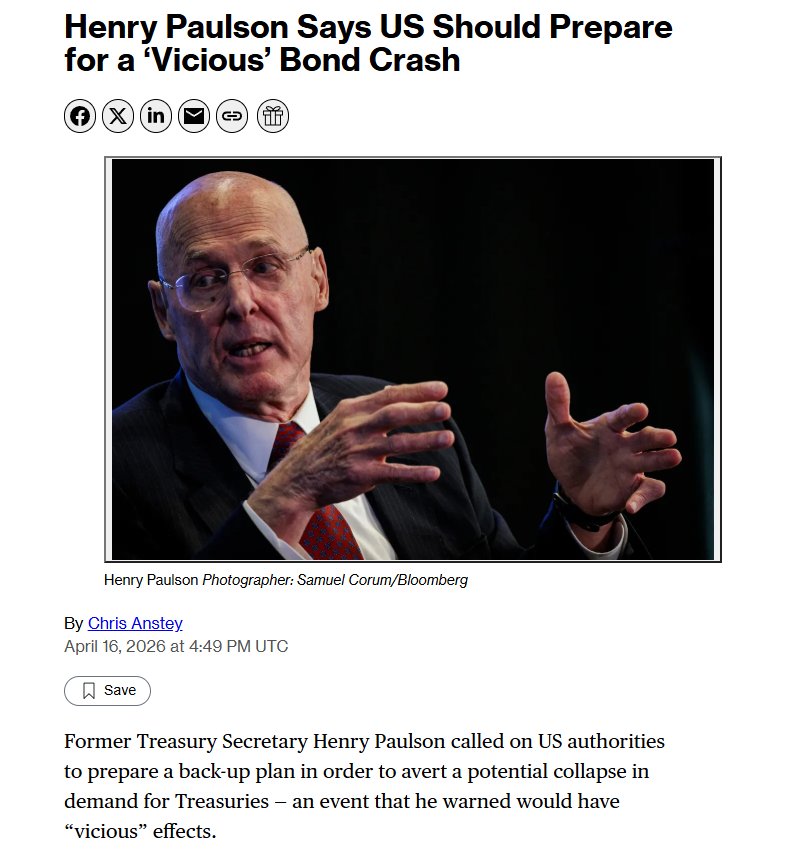
the coming global bond market collapse. In time for the mid-term election. Japan will lead.
Joined January 2021
- Tweets 19,366
- Following 1,894
- Followers 925
- Likes 67,179
87 Photos and videos


Pinned Tweet

14 Nov 2024
I think long term rates are being manipulated by the small number of players that control almost 90 percent of the volume. Another Liz Truss back in 2022. They want Trump to be tied up with problems before he begins.
1
2
11
710
11h
Reuters believes that China offers a better sovreign bond than the US.
China bonds emerge as surprise haven as Iran war reshapes portfolios reuters.com/world/asia-pacif…
19
12h
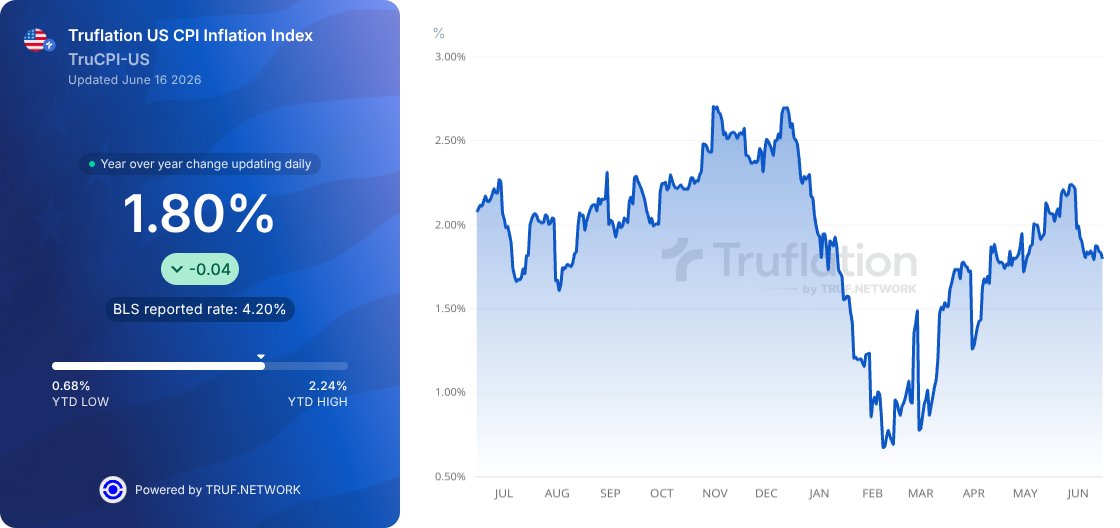
Today’s inflation reading in real time from Truflation.

🇺🇸 Truflation Daily US CPI is 1.80% YoY today, ⬇️ -0.04%.🇺🇸
Claim FREE CREDITS NOW and explore more bit.ly/4tjSiBF
23
phx_reader retweeted

Jun 15
BREAKING: Jean Jethro Alexandre, a Haitian national, sentenced to 10 years in prison for stealing more than $58 MILLION in false claims through Medicare, Medicaid, and private insurance.
Alexandre used the money to purchase luxury cars and a $2.5 million mansion.
Following his sentence, he will be handed over to ICE for deportation.
But Democrats said this never happens?!

358
2,242
6,818
98,315
phx_reader retweeted

Jun 15
"I'm gonna be the dirtiest doctor ever. I'm gonna poison them slowly." - Ahmet Kerem Korkaya, a Turkish medical student who researched breast cancer and immunology.
Korkaya is one of the 8 indicted last week by the Feds for terrorizing the University of Michigan & surrounding areas.

Jun 14

StopAntisemitism has obtained and confirmed the names and photos of all 8 terrorists arrested and indicted by the Federal Government this past week resulting from violent campaigns against U Michigan Jews and allies.
The eight include:
Paige Elizabeth Feyock, 26
Jonathan Hongru Zou, 22
Colin Hunter Weger, 24
Mariam Muhammed Odeh, 24
Ahmet Kerem Korkaya, 28
Amatullah Aliasgar Hakim, 21
Zainab Aliasgar Hakim, 23
Alexander Matthew Sepulveda, 23
They are facing 5-25 years in prison, with fines up to $250,000.

318
4,817
11,251
292,409
19h
A good idea from the Netherlands!
Dutch children are unusually happy and healthy. Is it because of the Avondvierdaagse? | Health & wellbeing | The Guardian share.google/8OzvZ1WixwI7RCT…
16
19h
Does 1% interest rates a bid deal?
Bank of Japan hikes rate to 31-year high - CNA channelnewsasia.com/east-asi…
21
21h
SpaceX rally adds $165 billion to Musk fortune, pushing net worth to record $1.3 trillion – Firstpost share.google/KXryjYiBxyHL3ZM…
14
phx_reader retweeted

Jun 15
There are 193 countries in the world. 177 of them receive US taxpayer money from Congress.
177 of 193
Elon is not the problem.
Congress is wasting our money.
We have $39 trillion in debt and a $2 trillion annual budget deficit.
Our foreign aid budget should be $0.00
234
2,346
8,843
221,999
phx_reader retweeted

Jun 15
What a remarkable outcome: the world's largest ever oil supply disruption failed to create a major energy crisis.
The IEA said 2026 shock was worst than 1973, 1979 and 2022 together. And yet, the cost of oil, natural gas, electricity and coal never surpassed the previous peaks.
377
811
5,247
942,810
Jun 15
BLS vs Truflation CPI numbers.
This exact divergence is what makes the current macroeconomic debate so intense—and why so many private investors are pulling their hair out watching the Fed respond to "old" or flawed data.
Right now, the gap between the two is staggering: the BLS has official year-over-year CPI at 4.2%, while Truflation’s real-time index is sitting way lower, down at 1.84%.
Truflation is showing that inflation has essentially been crushed, while the government's data screams that an emergency rate hike is needed. This massive disconnect comes down to how the data is gathered, and the biggest culprit is housing.
The Lag: How the BLS Measures Housing
Housing makes up roughly one-third of the official BLS Consumer Price Index. To calculate it, the BLS uses a metric called Owners' Equivalent Rent (OER).
Instead of looking at real-time home sales or new leases, the BLS literally surveys homeowners and asks a hypothetical question: "If you were to rent your home today, how much do you think it would rent for?"
Because the BLS only surveys these households once every six months, the data takes forever to move.
The BLS Reality: The high inflation numbers we are seeing from the government right now are heavily skewed by real estate and rental spikes that actually happened 6 to 12 months ago. It is a rearview-mirror metric.
The Truflation Reality: Truflation scrapes over 15 million data points daily from real-time sources like Zillow, Trulia, and real transaction data. It captures what someone signing a lease today is actually paying. When real estate cools, Truflation registers it instantly.
Weighting and Data Collection
The differences stretch beyond housing into how information is physically processed:
45
Jun 14
Goldman Sachs is expecting the Fed to raise rates by year end. ! Th3 US has the lowest small business hiring since 2020 and the lowest in 10 years, less than 9% of small businesses are expecting to hire employees over the next three months.
Anything to fight Trump's policies.
Goldman Sachs exec says traders right on Fed rate hike bets By Investing.com share.google/ak2IXZSN2oRlltk…
55
phx_reader retweeted

Someone told them she was Jewish, so a mob of Muslim men tore her clothes off while they beat her with sticks and poles, using their hands to rape her over and over again.
Still think they belong in the West?
249
3,886
16,029
609,933
Jun 14
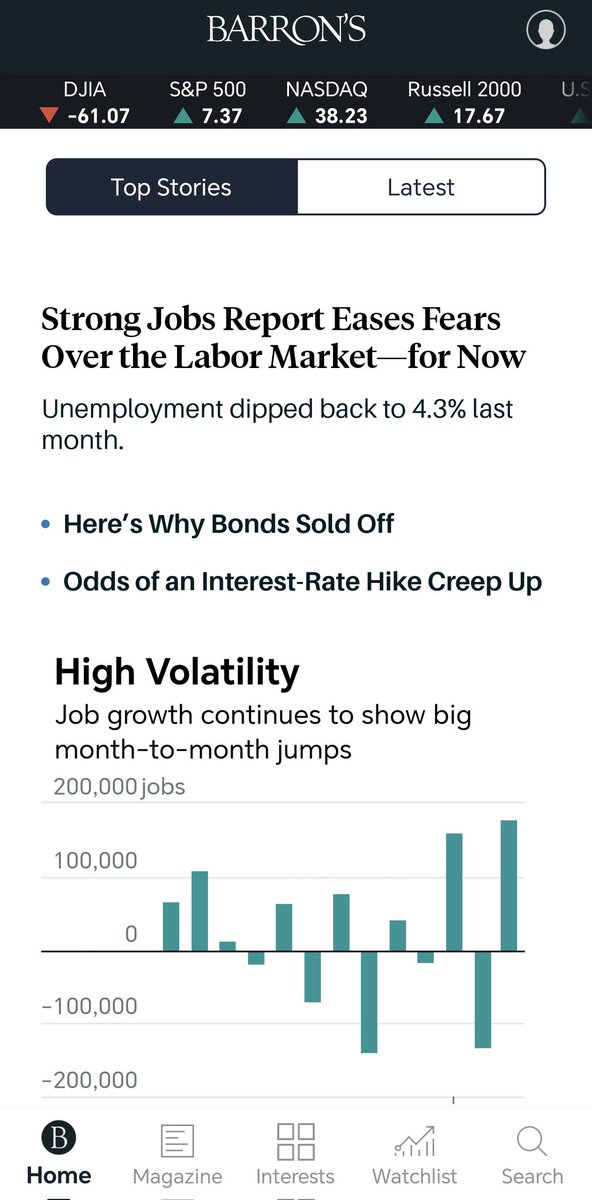
Now they want Kevin Watch to answer their questions, instead of allowing him to lead.
Source: Barron's
share.google/i5Ivah3XG4R9IEq…
14
Jun 14
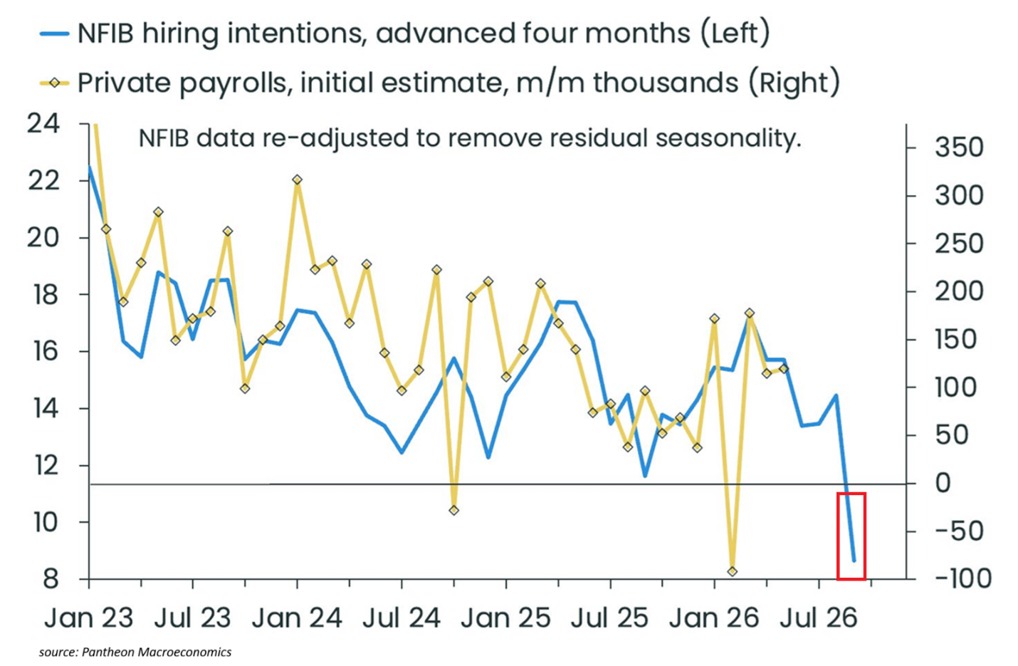
Interest rates must come down to preempt a showing job market.

The US job market is showing further signs of weakness:
Only 9% of small business owners said in May that they plan to hire over the next 3 months, the lowest since May 2020.
Excluding the 2020 pandemic, this is the lowest reading in 10 years.
Small business hiring plans have trended lower over the last 6 months.
Historically, this has been a leading indicator for nonfarm private payrolls by roughly 4 months.
This comes as small firms account for ~46% of all US private sector employment and suggests that private payroll growth could turn negative as early as Q3.
Hiring demand among small firms is weakening.
1
50
Jun 13
No rate cuts for Trump, according to Janet Yellen, the oke that borrowed short term when the 30 year bond was yielding 1.25%.
Source: The Edge Singapore
share.google/QH11ZcfuEQDR3uw…
39
phx_reader retweeted

Jun 13
از تمامی براندازان عزیز تقاضا دارم، یکبار برید متن 14 ماده ای رو بخونید و دیگه از کلمه توافق استفاده نکنید.
این اسمش تسلیم نامه است.
دارن تسلیم میشن، توافق کجا بود؟؟؟؟
بعد به زانو در اومدن اونها، نوبت ما میشه و فراخوان و خیابون و انتقام 50 هزار جاویدنام ما.
#جاویدشاه
42
274
2,747
58,651
Jun 13
No wonder the war on Russia.
Russia Confiscates $7.6Bln in Assets in Largest Nationalization Yet - The Moscow Times share.google/AV2GTLIIvOAvGao…
18
Jun 12
Janet Yellen the lady that held both the Treasury and the Fed is saying no rate cuts and no way out, so she wants the full collapse of the US?
Source: The Edge Singapore
share.google/xELcRJbtqqVkIkd…
16
Jun 12
India is desperate to raise US dollars to save the Rupee from further deterioration. They are asking overseas Indians to buy bank issued Indian bonds.
What happened to BRICKS, i thought they are replacing the US dollar with their own currencies!!
India sees $3 bln debt fundraising rush as yields slump after RBI moves, bankers say | Reuters share.google/9N8mvWEj4JwO0zF…
31