
⚙ Quantitative models for leading U.S. & global macro indicators ⚠ U.S. Recession probability models ⏱ S&P 500 market timing 🌐 Geopolitical risk analysis
Joined October 2016
- Tweets 3,246
- Following 414
- Followers 8,788
- Likes 264
903 Photos and videos


Jun 12
Real average hourly earnings — the eight-month leading edge of NASDAQ-100 returns — has rolled back to the zero line, and the signal it governs just armed. That threshold is a coin flip: 50% probability of negative returns eight months out, with the chart projecting the index roughly -12% by December 2026. Read it as a yellow flag, not a red one. The kill zone sits lower — past -1 (67% odds) and especially below -2, where no reading has ever failed to precede losses. R²=0.265 is loose in aggregate, but the fit tightens precisely where it bites: the downside. Why? Negative real wages erode household demand first; consumer-facing revenue fades next; forward earnings follow them down; and only then does the multiple-rich NASDAQ-100, leaning hardest on those out-year estimates, reprice. Households first, megacaps second. The clock has started; the wallet, not the tape, is keeping time. join.recessionalert.com/
1
16
1,825
Jun 11
Two panels of the same chart disagree, and the disagreement is the story. The aggregate global "recession" search index reads ~30 — calm, unremarkable. Beneath it, the G7 diffusion count sits at 3-4 on a 3-month window. That breadth has printed only three times in two decades: 2008-09, 2020, 2022-23 — each cresting at 5-6, each preceding a global recession. The aggregate smooths a calendar month; the diffusion catches a cluster. The cluster is honest. The per-country panels resolve it. Japan, Germany, Italy spiked together late-2025, UK and France behind — search led, GDP followed. On May 29, StatCan confirmed Canada first: Q4 2025 -1.0% annualized, Q1 2026 -0.1% — higher imports, fifth straight quarterly capex decline of -0.7%. Capital Economics: trade-induced — tariffs and the Iran-war oil shock landing on net importers first, where the prior three clusters started. The US panel stays calm. S&P 500 firms harvest 40% of revenue offshore. The aggregate is the panel that lies to you.
12
1,509
Jun 10
No argument that the doom takes are overstated and the tape deserves respect.
Two issues with "the smart money isn't buying," though. It's circular, since you're reading positioning off price direction and every sell is someone else's buy. And the price you're reading is the paper market, which has decoupled from physical this whole episode, refiners paid $30-40 premiums to landed barrels while futures stayed subdued. So the futures tape isn't even a clean read on the molecules, let alone on who's informed.
The driver isn't mysterious either: the Hormuz war-premium is unwinding on reopening signals. Plausibly lower from here, but that's a headline-binary, not a verdict. Worth watching whether physical converges down with paper or stays bid.
Jun 10

I am reading so much doom and gloom about oil inventories running out in 10 days and this is generational buy opportunity.
To which my question is this . This most sophisticated funds, managers , traders with access to the most expensive data in the world are not buying the market . Why ???????
Because very clearly the data does not warrant it. There are a few possible reasons why oil keeps sinking ;
1. A deal is incoming that opens the straight
2. Demand destruction
3. Shipping is exiting straight dark
4. Oil supply ramping up to fill supply gap
All or some of the above may or may not be true . What is 100% true is the smartest most informed are not buying it . That is all that matters. Don’t overthink the why . And please don’t repost the doomed tweets because they clearly are bait and not factual .
Until the smart ones stop selling and start buying , it’s best to read between the lines rather then imposing your beliefs on market . It will turn out to be a lot cheaper
3
1
4
2,243
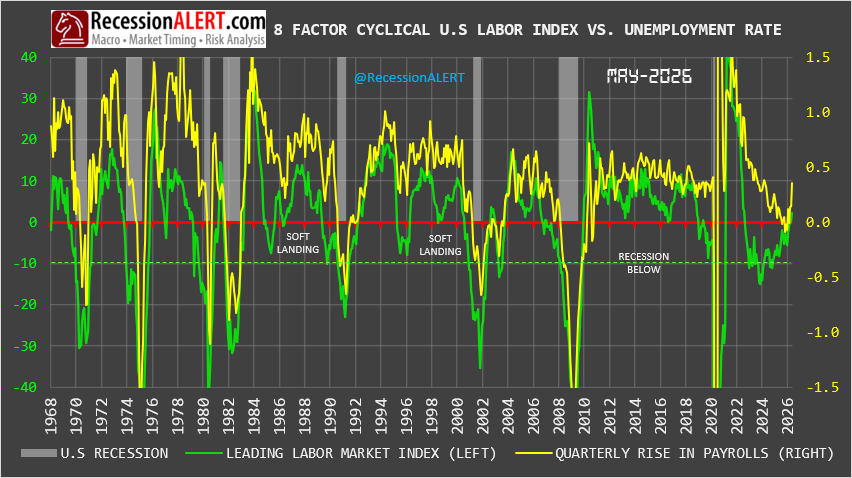
Recoveries don't announce themselves on the front page — they start in the plumbing, and the plumbing here is factory hours. The 8-factor cyclical labor index bottomed at -8.18 in May 2025 — an excursion that, in every prior modern cycle (1970-2020), sat inside a recession bar. This one did not. Instead it has climbed from December's -5.50 to 2.19 across five accelerating months, implied recession probability has collapsed from the mid-60s to 0.00%, and headline unemployment is pinned at 4.3%. Factories find a floor, hours extend before headcount, overtime absorbs the next marginal shift, openings rise, hiring follows — and the index captures that sequence eight months ahead of coincident payrolls, corroborated by ISM Manufacturing 54.0, JOLTS openings 7.6M, and May NFP 172k. Just 3 of 8 components have turned positive yet — the lead is narrow — but a soft landing confirmed at the leading edge is a different rate path, a different risk regime, and a different bill for anyone still positioned for the recession that never came.
2
5
16
1,681
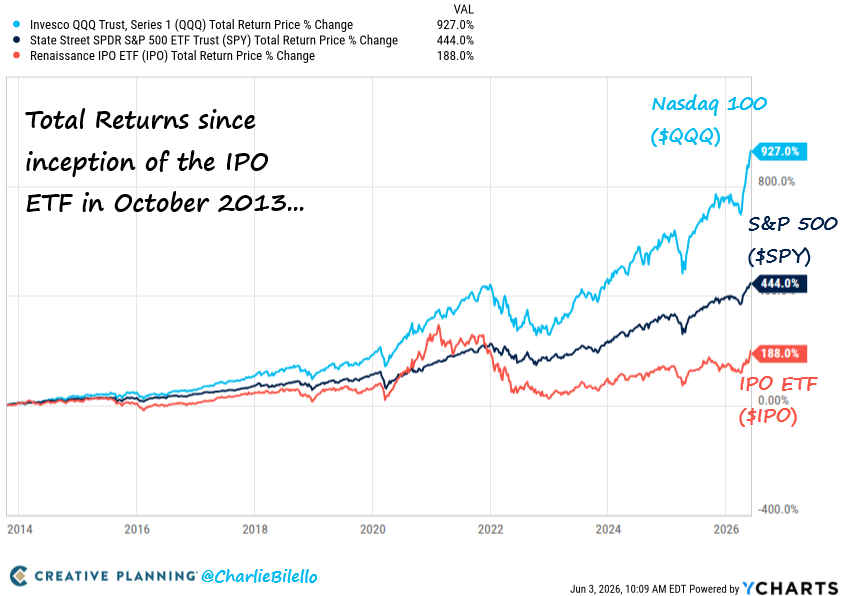
IPO returns are what happens when the people who know the company best are net sellers. The IPO ETF’s 188% since October 2013 — against SPY’s 444% and QQQ’s 927% — isn’t a stock-picking miss; it’s the architecture of primary issuance. Founders, VCs, and PE sponsors float supply when their internal mark says the offering price is generous, never at troughs. The first-day pop accrues almost entirely to allocated insiders; public buyers enter after peak euphoria, then absorb 90-day employee unlocks, 180-day sponsor distributions, and follow-on secondaries priced inside the curve to clear inventory. The flat line since 2021 is not a baseline — it is a bubble-vintage unwind, a SPAC-and-ZIRP cohort still convalescing inside a 12-year chart. Vintage is the variable, and 1999 and 2020-2021 both proved supply waves cluster at tops. SpaceX, OpenAI, and Anthropic queueing into all-time highs is the next vintage being loaded into the same trap — a $300B-plus SpaceX deal does not conjure fresh capital, it siphons it from the AI leaders portfolios already own. The disciplined trade isn’t the bell — it’s the calendar, 180 days out.

The First IPO ETF launched in October 2013.
Returns since...
Nasdaq 100 $QQQ: 927%
S&P 500 $SPY: 444%
IPO ETF $IPO: 188%
Investors chase hot IPOs on the belief that they will outperform. Reality: most stocks underperform after going public.
Video: youtube.com/watch?v=OPLIajQc…
3
1,734
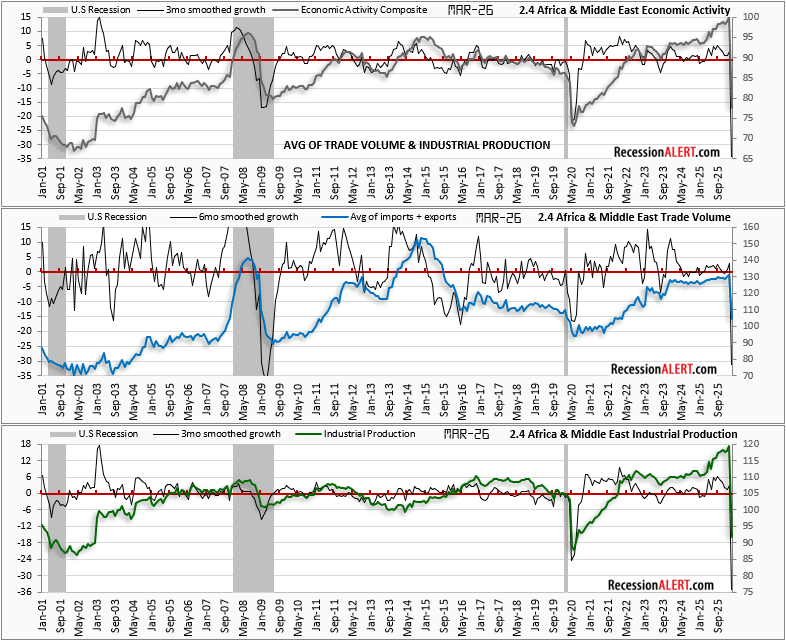
Middle East economic collapse. The Hormuz tanker counts, the SPR drawdown trajectory, OECD inventories, the term premium repricing — every Iran-war chart the desk has spent six weeks decoding is a buffer or a pressure gauge. This is the damage report underneath them. Middle East trade volume collapsed from a series-peak ~135 to ~95, industrial production from ~120 to the high-90s, the composite from ~99 to ~85, with 6-month growth rates printing -15 to -20% — COVID-trough magnitudes, reached in weeks, with no demand-side cause. The synchrony matters: these are not producers throttling wellheads as storage filled. Refineries, export terminals, processing trains, and pipeline infrastructure were physically destroyed in the US-Iran strikes. Every prior modern oil shock — 1973, 1979, 1990, 2014, 2022 — left capacity intact and barrels returned when politics resolved; the honest analog is the 1943-44 Ploiești raids, which took out roughly 60% of Axis oil capacity and required years to rebuild. The buffers everyone is watching are draining against a supply curve that no longer exists at the top — and gasoline pumps inherit the difference long before policymakers do.
1
13
4,076
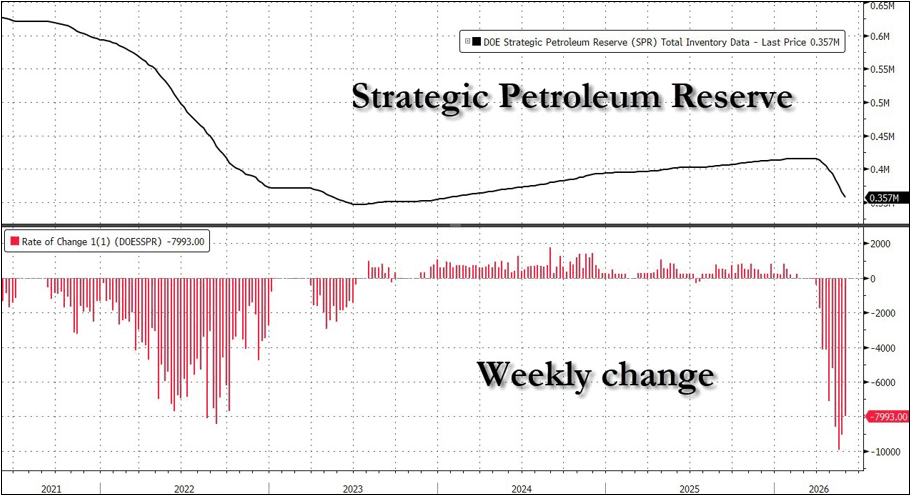
Three consecutive weekly draws of -8.6M, -9.92M, and -7.99M barrels have rewritten the EIA record book — each individually eclipsing the previous all-time high of 8.4M bbl set during the September 2022 Russia-Ukraine response. The Strategic Petroleum Reserve sits at 357M bbl, seven million above the 2023 trough that defines this chart’s five-year floor; at the current ~8.8M/week pace, next Wednesday’s print breaches it, and the August trajectory lands near 250M — the lowest level since the 1980s. Yet the structure inverts the read: this is not a sale. The 2026 SPR Exchange Program, the Trump administration’s response to the US-Iran conflict, loans crude to refiners now against in-kind repayment in 2026-2029 at a 1.20-1.25x premium — roughly 34-43M extra barrels owed back against the 172M committed through August, running at ~30x the routine NDAA pace. The 2000 hurricane and 2011 Libya exchanges, each ~30M bbl, repaid cleanly into flat-to-declining crude; at 172M this commitment is six times either precedent, into a live supply shock with no resolution priced. The asymmetry is the trade: three years of patient refill erased in six weeks, with the cushion spent mid-conflict and relief at the pump borrowed against a forward curve the Treasury does not control. recessionalert.com/chart-of-…
8
2,102
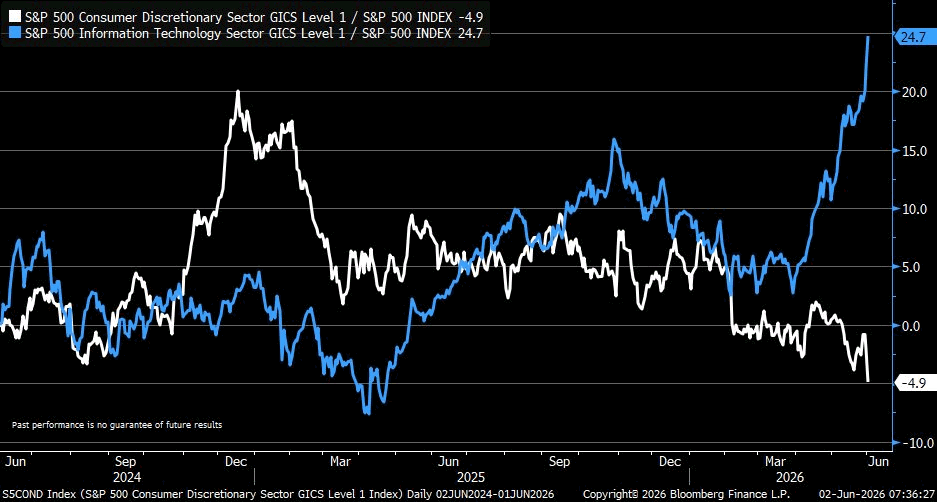
Two ratios, one circuit. The capex dollars lifting Tech to a 2-year relative high of 24.7 and the household dollars draining out of Consumer Discretionary to a 2-year relative low of −4.9 are not separate stories — they are the same dollar moving through different doors, and the entire thirty-point spread opened in roughly ten weeks of near-vertical move since late March. Textbook rotation has early-cycle Discretionary leading late-cycle Tech; that order is running backwards, which tells you this is not a cycle at all but a single capex vertical printing on the tape. Hyperscaler AI spend, ad budgets, cloud seats, software renewals — every line item funding that spread is sourced, eventually, from the household wallet now rationing under delinquency stress, softer real wages and a cooling jobs market. Tech’s earnings engine is partly powered by the very consumer it is outrunning. The vertical line eventually has to pay rent. recessionalert.com/chart-of-…
1
1
7
1,301
Every major market top rang the same chord: extreme valuation, narrow leadership, complacent positioning, decaying internals, loosening credit — all at once. No single bell times a top. The chord does — and that cluster has preceded every one.
Mid-2026 is the densest such reading since 1999: Shiller CAPE near its 1999 record, the equity risk premium back at zero, fund-manager cash on a sell signal, a quarter of the index already in private bear markets behind the highs.
This isn't a timing signal. It's a weather forecast.
So batten the hatches and reef the sails — but hold your course. Markets stay irrational far longer than bears stay solvent.
Because you don't turn the boat on a falling barometer — you ready the ship while the sea is still calm enough to work the lines as we describe at recessionalert.com/market-fo…
2
3
14
1,800
May 28
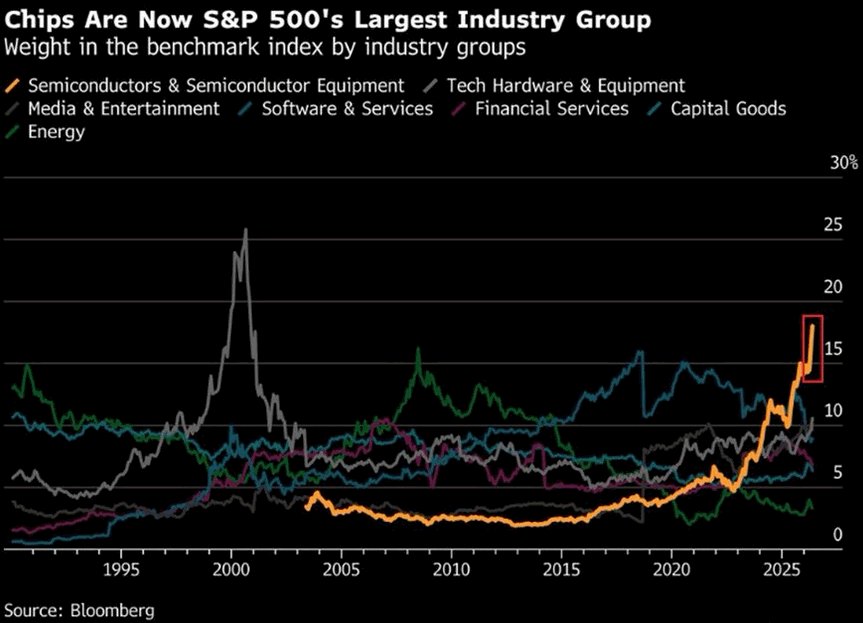
Every prior time one industry pushed to extreme weight in the S&P 500, the index topped with it. Media & Entertainment hit ~24% in March 2000 — the bell at the dot-com peak. Financial Services reached ~22% in October 2007 — weeks from the cycle high. Energy crested ~16% in mid-2008, before the GFC second leg. Three for three. Chips at ~17% in May 2026 is the fourth setup, and the trajectory — five percent to seventeen in three years — traces Media’s 1998-2000 vertical arc. The slope is the diagnostic, and the composition is sharper still: prior peaks spread across dozens of constituents, today’s ~17% is single-name-heavy, NVDA alone near 7% of the S&P. Vertical expansions are built by concentrated mark-to-market in a handful of leaders absorbing the marginal passive bid; the curve goes parabolic, the unwind mechanical. Every passive dollar — roughly $10T of household savings embedded in pensions, 401(k)s, target-date funds — now carries that chip beta whether the holder consented or not. The pattern is not a forecast. It is a precedent waiting on its catalyst. recessionalert.com/chart-of-…
2
14
35
3,413
May 26
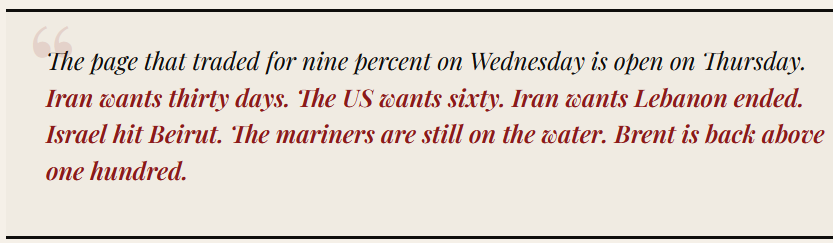
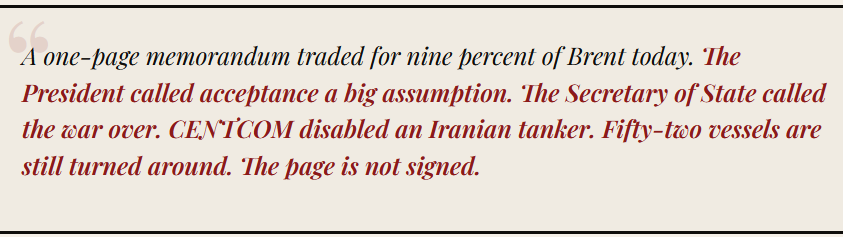
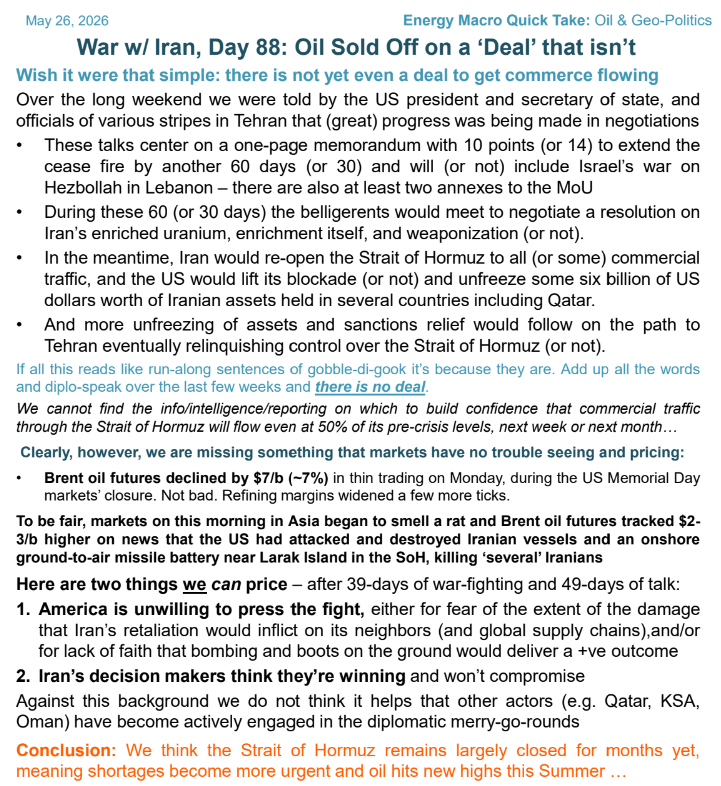
The exhaustion isn't a side effect — it's the cover. Tape chases every memorandum-of-points while throughput sits at 5.7 ships/day, refining cracks widen, and Asian buyers scramble for non-Gulf barrels. Memorial Day's $7 drop on holiday liquidity, then Asia bidding back $2-3 on the Iranian vessel attacks and SAM hit near Larak — bifurcation in plain sight. Macro tourists trade tweets; physical players hedge landed costs. The move comes violently, from something concrete, after everyone has stopped watching.
May 26

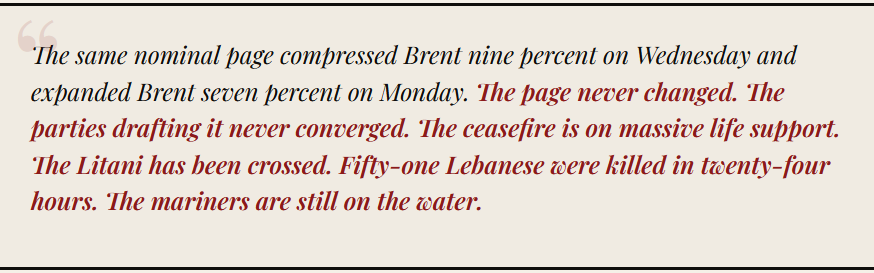
The vociferous Jan Stuart of Piper Sandler, who in one page captures the tweet-driven mental exhaustion many of us are experiencing:
1
1
4
1,053
May 26
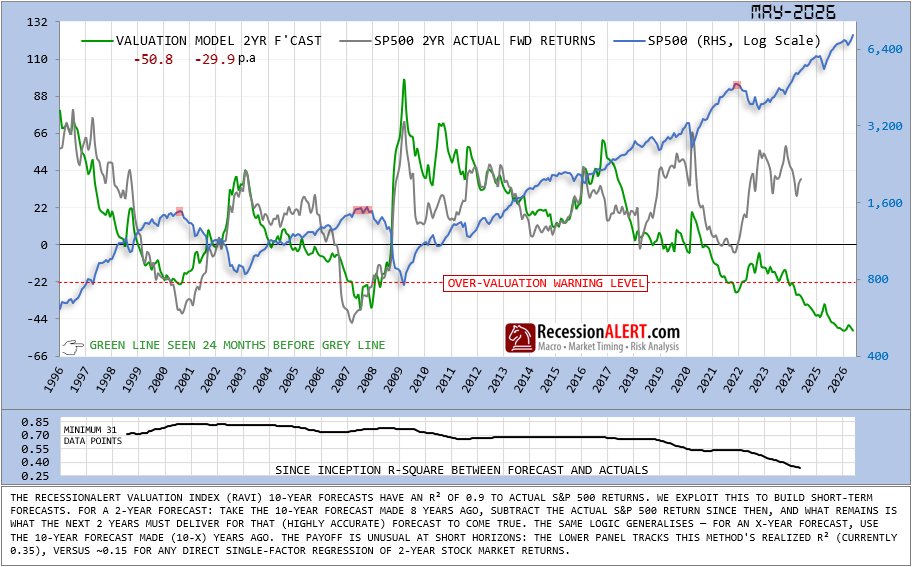
Valuations have been thrown out the window. Three for three at -22% in 2000, 2007, 2022 — each a coincident peak, the 1st two followed by 45-55% drops, the 3rd by a credible 25% down payment before the market did what the prior episodes never did. It recovered, and kept going. The forecast did not relent. It deepened from roughly -30% in 2022 to -50.8% today, while the index it indicts climbed another third higher. The mechanism is arithmetic: a ten-year forecast made eight years ago minus what the S&P actually delivered since. Every dollar of rally above expectation deepens the implied giveback. The lower panel is the chart's confession: R² has not decayed, it has stepped down from 0.80 toward 0.35 in discrete drops — the fingerprint of regime breaks, not aging math. Trillions of Fed balance-sheet expansion, mega-cap earnings concentration hollowing the aggregate P/E, passive flows displacing the valuation-sensitive marginal buyer, the central-bank put priced rather than contingent: the math is intact, the market it was fit on is not. A manifestly bearish chart whose own R² counsels against acting on its depth — use it for what it now is, a tape-condition gauge, not a top-caller. Adjudication prints May 2028.
3
3
15
2,487
May 21
An oil shock fires a familiar reflex — US pump prices, a hotter CPI print, a Fed boxed in. That reflex points at the wrong victim. Strip ~13 MM Bbl/d from global supply at peak — roughly 13% of the world’s ~100 MM Bbl/d, two-to-three times the 1973, 1979, and 1990 shocks — and the damage isn’t a US story; it’s a synchronized stagflationary tax on everyone who imports crude. The US, now roughly oil-neutral, sits closest to the exit: higher prices that bleed consumers also flood domestic producers with revenue, leaving the net hit near zero. The real casualties are Europe, Japan, and above all China and India — growth-sensitive economies structurally short barrels, with no shale cushion to self-insure. Bypass pipelines cap the forfeit at 13 rather than 20, but they run flat-out from day one, a fixed floor with no give. And the cumulative red line — ~2 billion barrels, roughly 20 days of world demand gone — keeps climbing a full quarter after July’s reopening. The shock is global; the safe harbor flies a US flag.
May 20
Our new base case is that the world will forfeit 2BN barrels of production...even if the Strait begins to open in July. The problem??? The world cannot lose 2BN barrels of production...the system will break well before then.

1
1
5
3,116
May 20
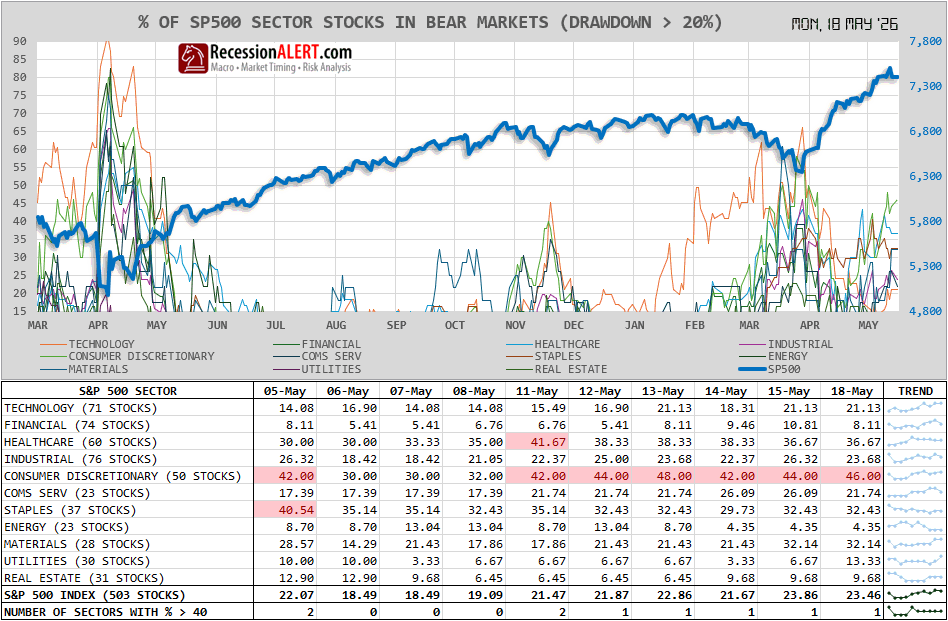
S&P 500 prints new ATH while 23% of components in bear markets — a textbook narrowing tape. Consumer Discretionary leads the damage at 46%, consistent with the K-shaped consumer stress visible elsewhere; Healthcare (37%), Staples (32%) and Materials (32%) round out the carnage. Even Technology deteriorated from 14% to 21% over the past two weeks despite the AI bid. Only Energy (4%), Financial (8%) and Real Estate (10%) remain structurally healthy. When breadth fails to confirm new highs and defensive sectors break first, that is not what traditional late-cycle bull markets look like.
Taken from Chart-of-the-day at recessionalert.com/mib-yield…
1
3
12
1,273
May 15
The big narrative today: the 10-year Treasury yield climbed to 4.58%, its highest level in a year, driven by mounting inflation fears tied to the Iran war and expectations that the Fed may actually hike rates later this year. Stocks fell across the board — the S&P 500 shed about 1.1%, the Nasdaq slipped 1.3%, and the Dow dropped roughly 480 points — after the Trump-Xi summit ended without major policy breakthroughs, leading investors to take profits in the tech sector that had seen sharp recent gains. Adding to the uncertainty: Jerome Powell's term as Fed Chair ends today, with Kevin Warsh stepping in as his replacement. That leadership transition, combined with sticky inflation data and a stalled Middle East peace process, makes the yield spike the clear chart to watch.
2
621
Anthropic gobbles ALL the compute capacity at @SpaceX Colossus 1 data center, giving them over 300 megawatts of additional capacity to deploy within the month. Win-win all round.

Effective today, we are:
1) Doubling Claude Code’s 5-hour rate limits for Pro, Max, and Team plans;
2) Removing the peak hours limit reduction on Claude Code for Pro and Max plans; and
3) Substantially raising our API rate limits for Opus models.
2
1
4
851
This is actually pretty major news. Good for SpaceX, good for Anthropic, good for Claude code/API users...
We’ve agreed to a partnership with @SpaceX that will substantially increase our compute capacity.
This, along with our other recent compute deals, means that we’ve been able to increase our usage limits for Claude Code and the Claude API.
1
5
827