
Joined July 2010
- Tweets 2,876
- Following 215
- Followers 1,653
- Likes 2,682
705 Photos and videos


Pinned Tweet
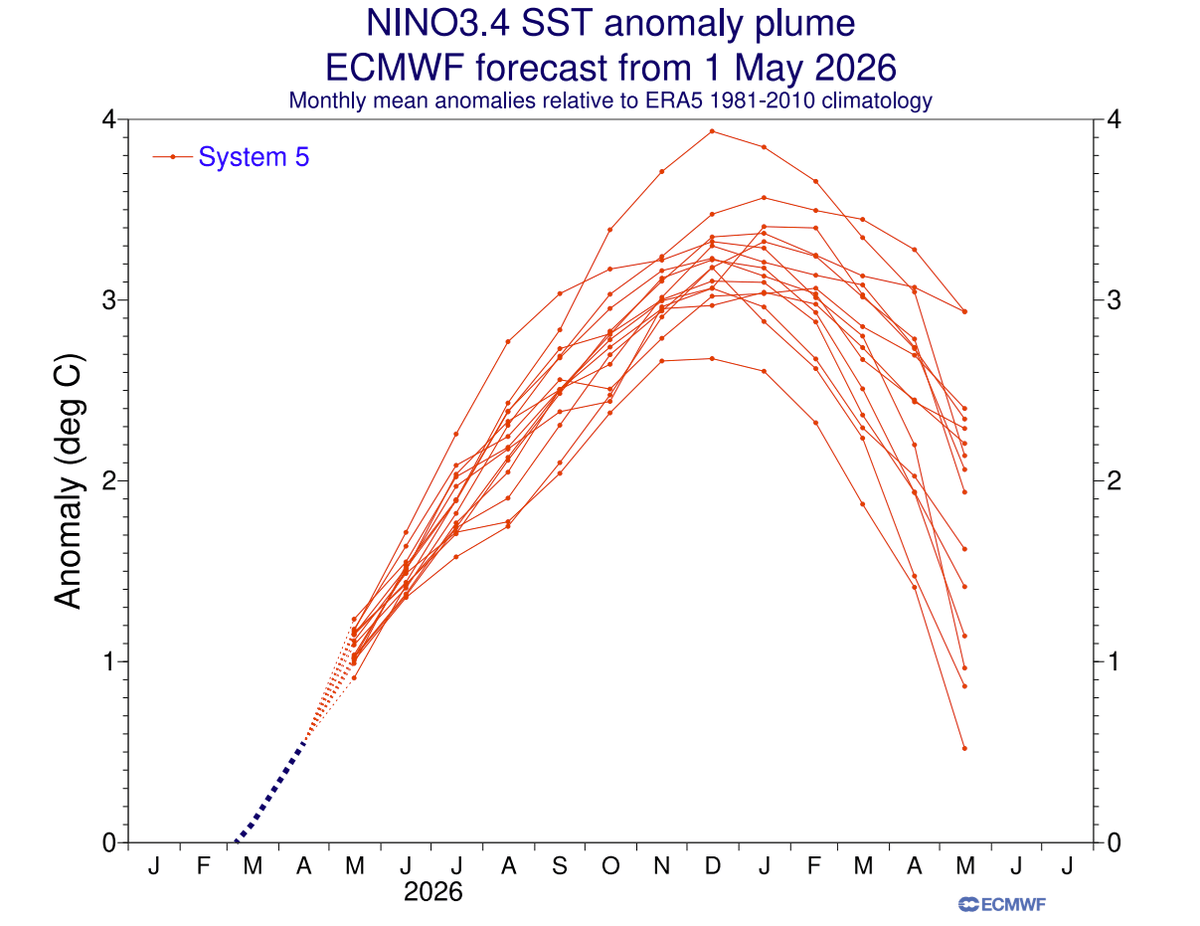
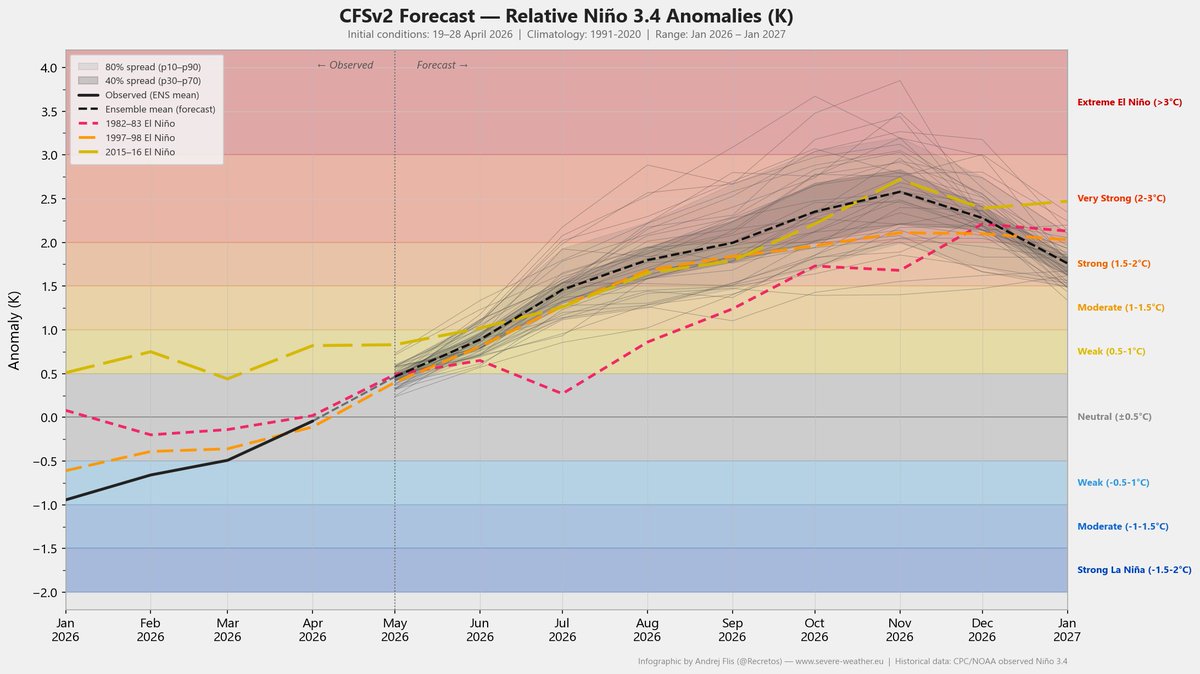
Comparing some of the latest forecast runs to past strong El Niño events shows we are in for quite a historic ride, if verified. Both the BOM and CFSv2 use the Relative ENSO index forecast. Interesting to see how close the new BOM forecast is to the ECMWF.
@AndyHazelton
@webberweather
@PaulRoundy1
@tcrawf_nh
@BenNollWeather
4
12
51
5,777
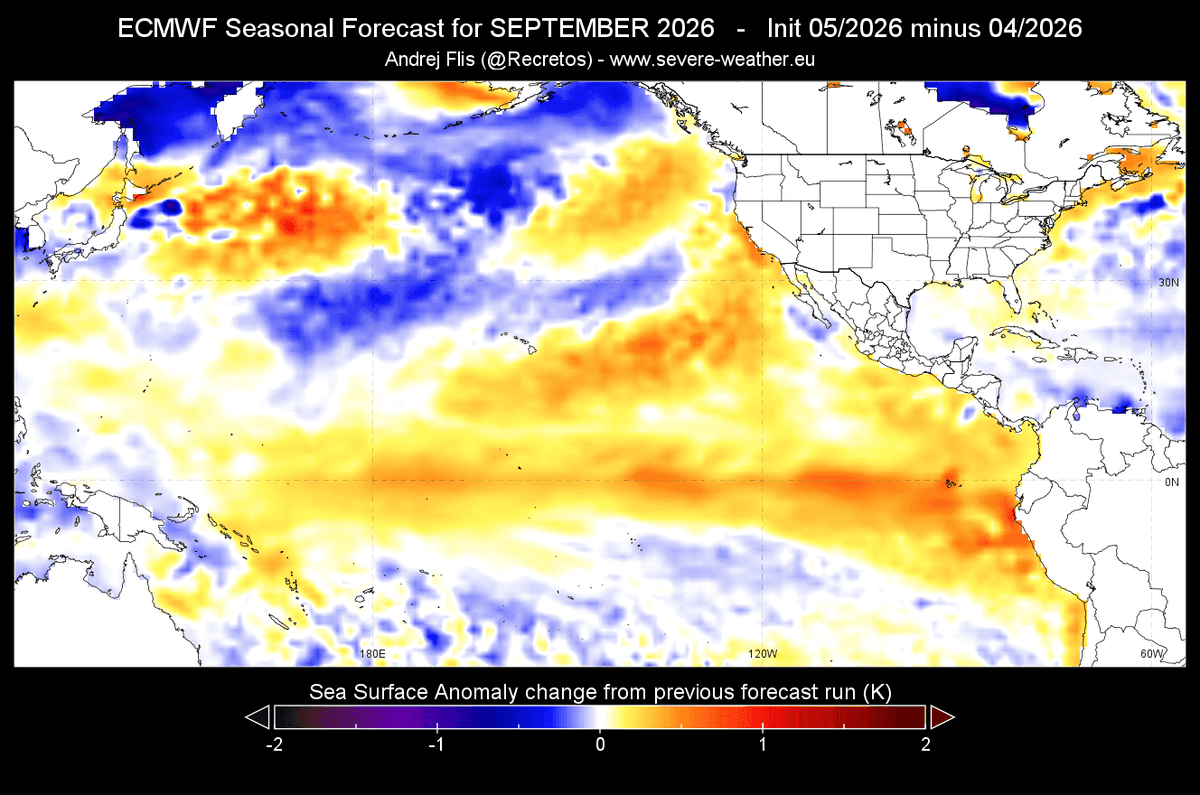
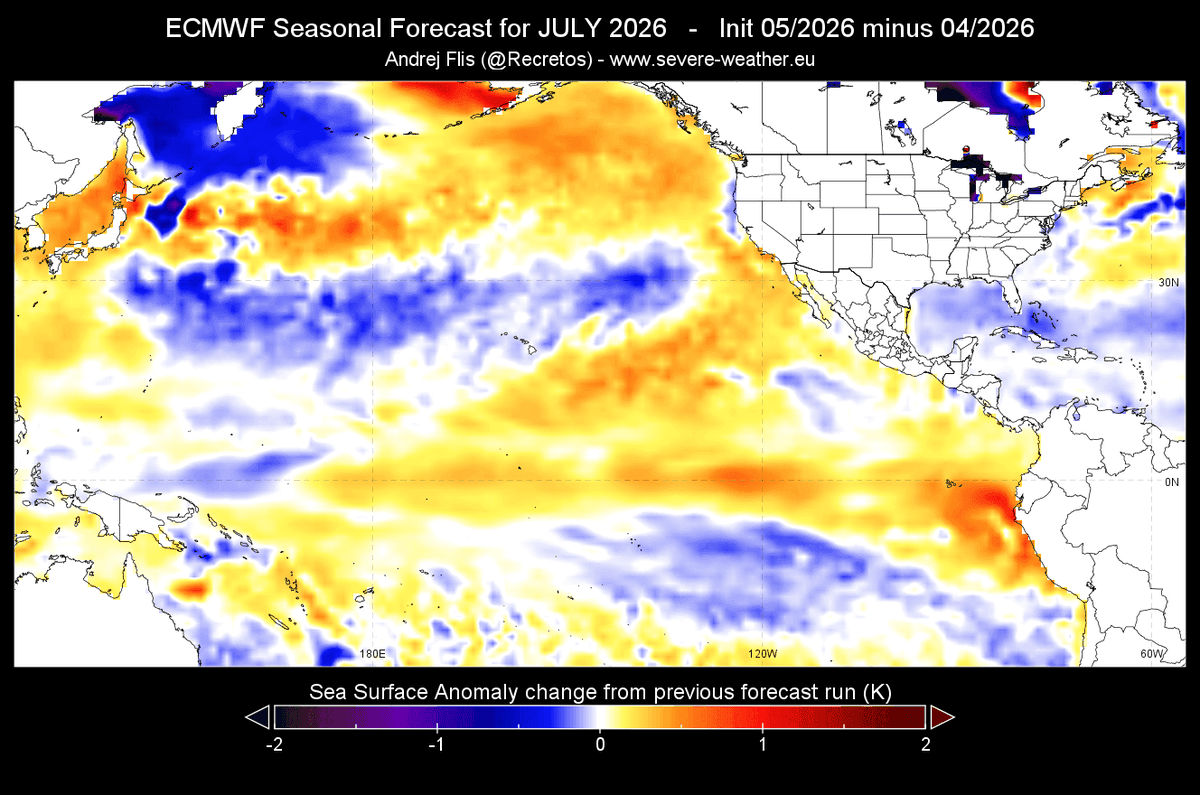
Also, comparing the latest ECMWF run to the previous run for July and September, we can see a stronger El Niño, but also a bit more intensity in the " PDO" signature
1
10
757
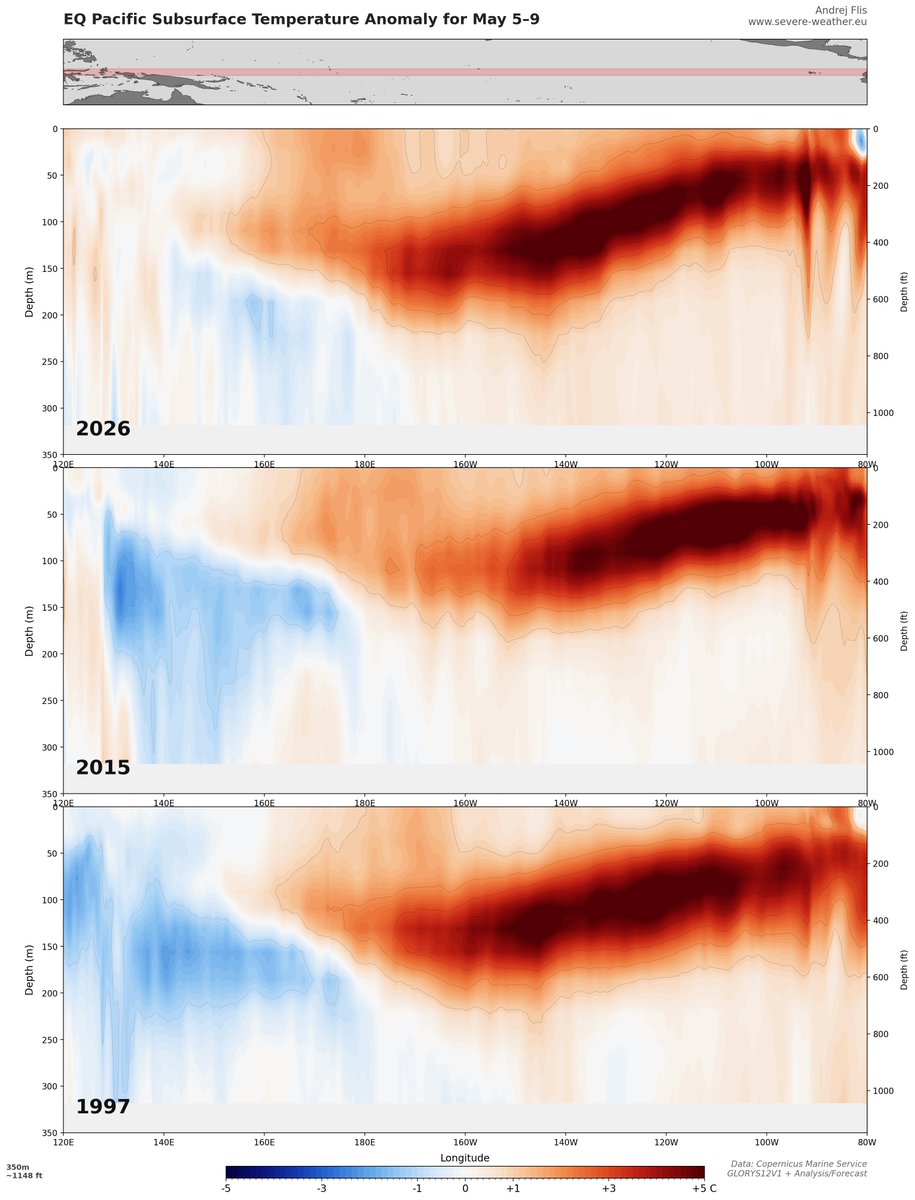
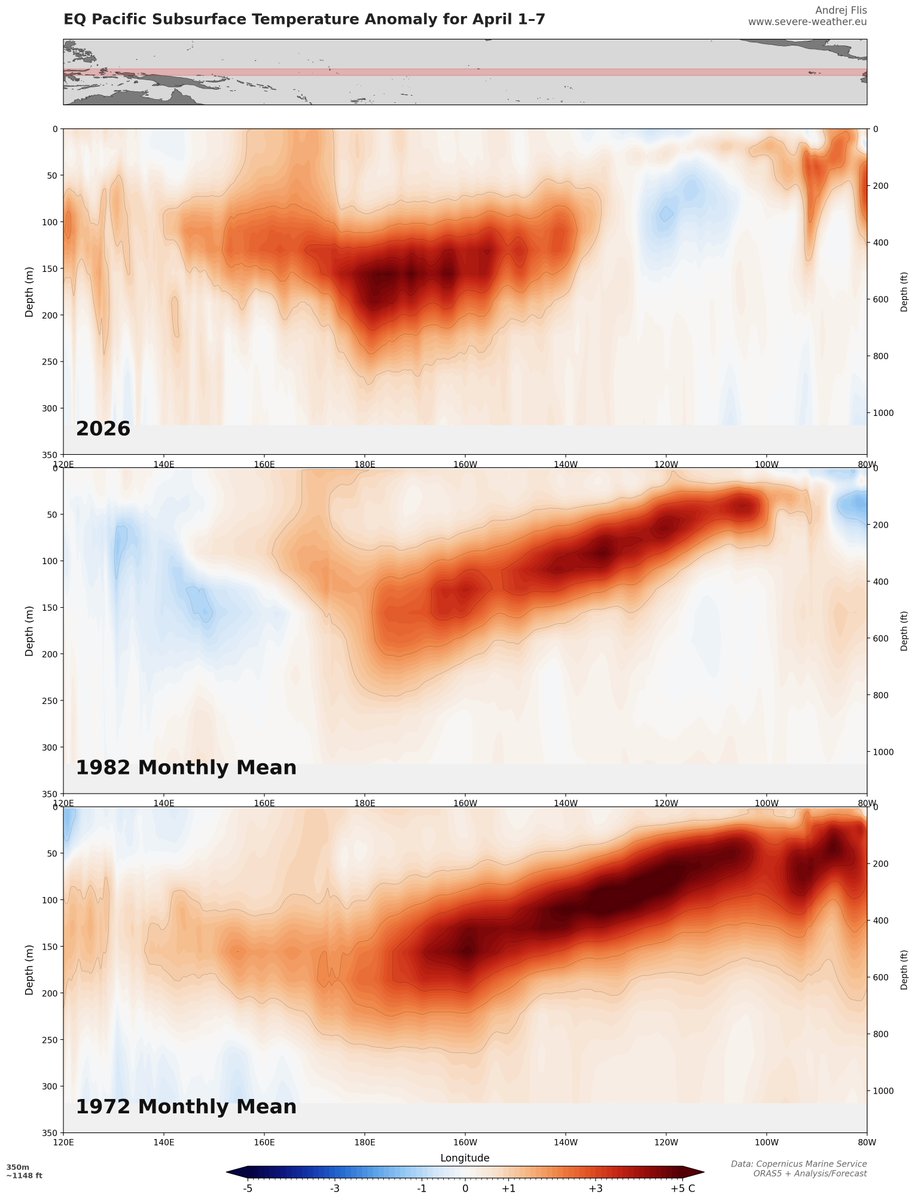
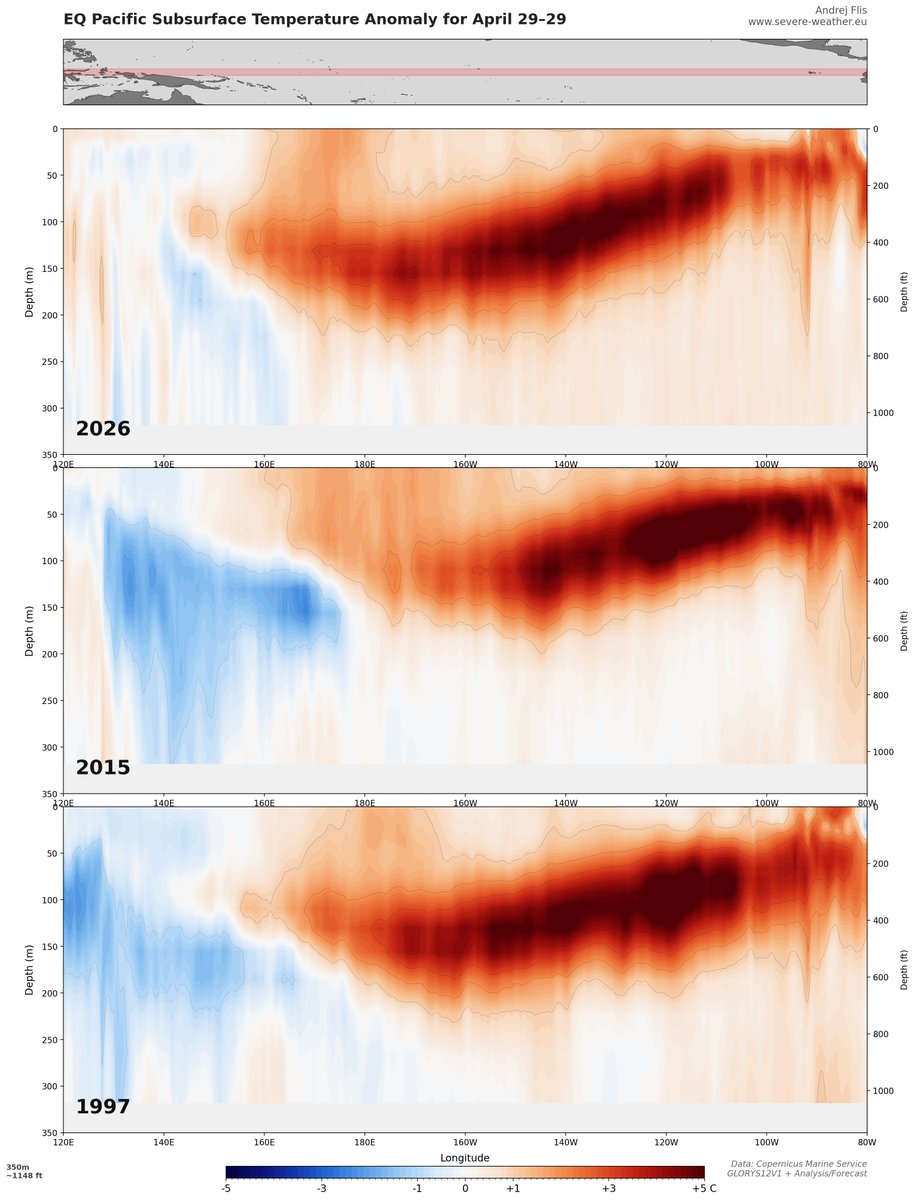
Looking at the latest snapshot comparison to the last 2 Super El Niño events, we can see a significant speedup of the subsurface warming evolution in 2026 compared to the start of the month.
@AndyHazelton
@webberweather
@PaulRoundy1
@tcrawf_nh
3
25
103
6,617
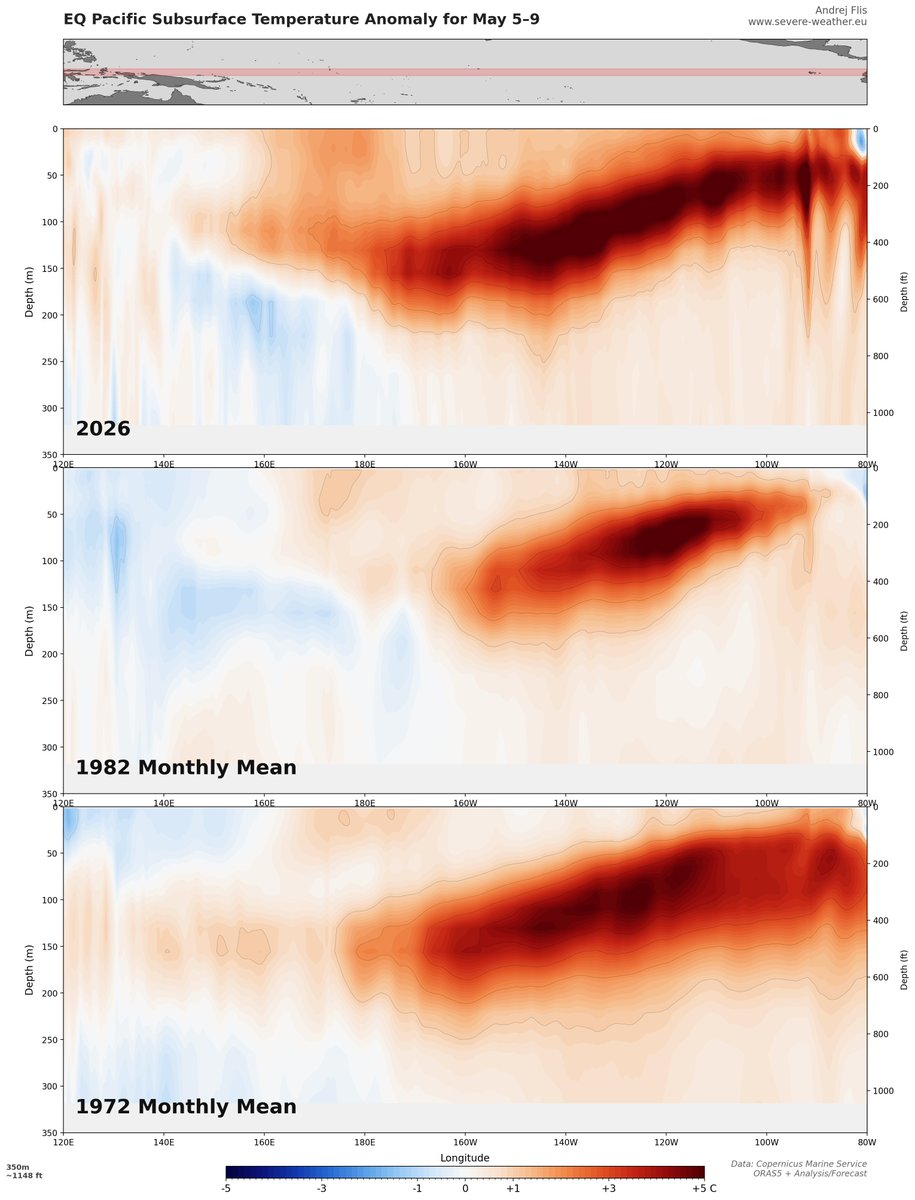
This is now also the revised plot for the older two Super events, comparing the late April 2026 data to April monthly means, and the second graphic is the forecast for May 5-9, 2026, compared to the May monthly mean for past events. The forecast comes from the Mercator Ocean International system, forced by ECMWF IFS.
1
1
4
737
Last but not least, here is also the comparison graphic, using the May 5-9th forecast data, comparing it to the past 2 Super events. Also adding the CFSv2 Relative Niño index for good measure.
3
1
16
7,149
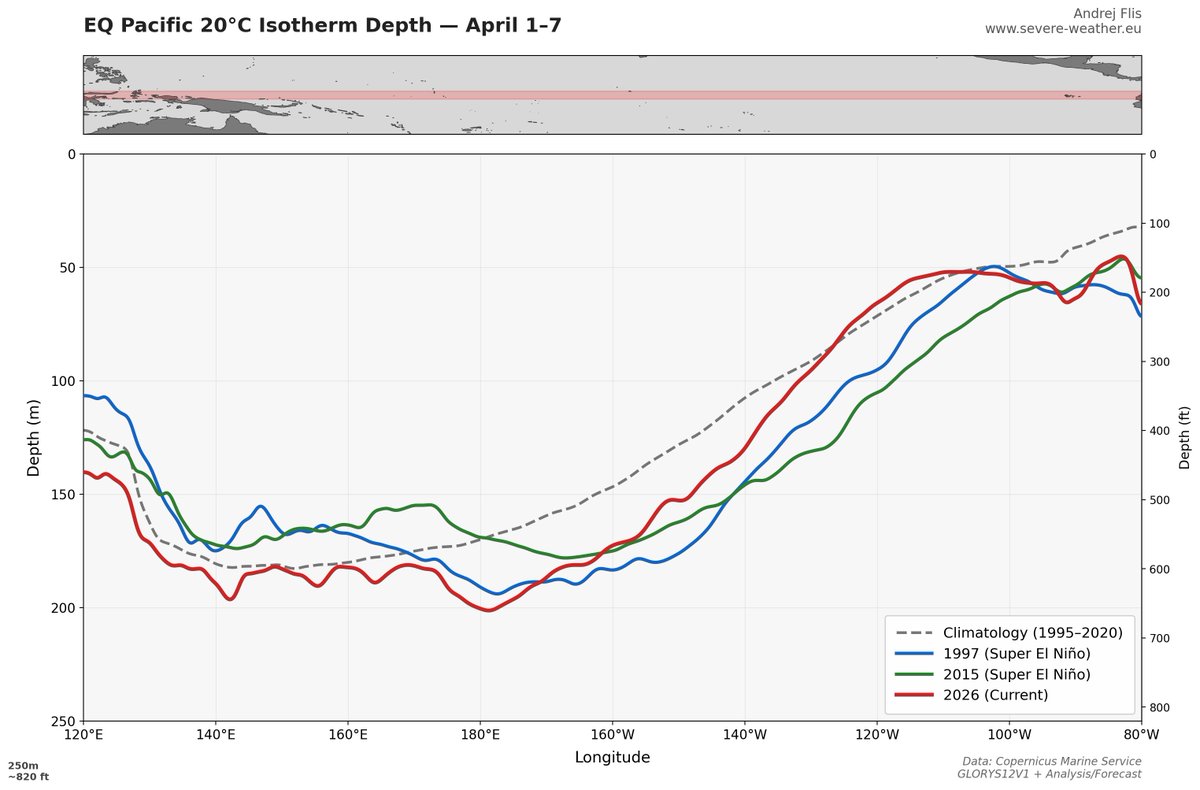
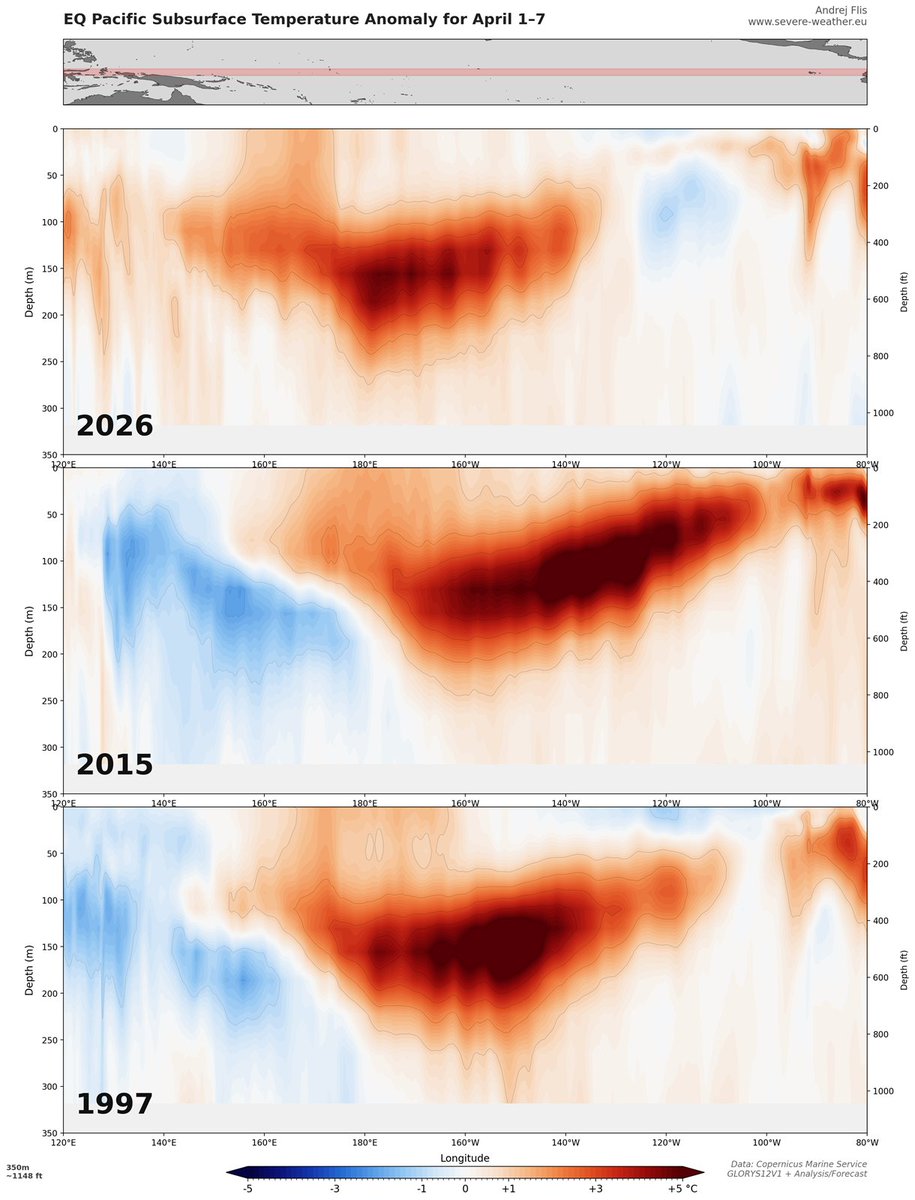
Looking at the month-to-date comparison to the last 2 Super El Niño events, we can see how big the OHC delta is in the western Pacific. Likely a stronger buildup, or perhaps just a time difference in the process evolution? @AndyHazelton @webberweather @PaulRoundy1 @tcrawf_nh
4
13
58
6,109
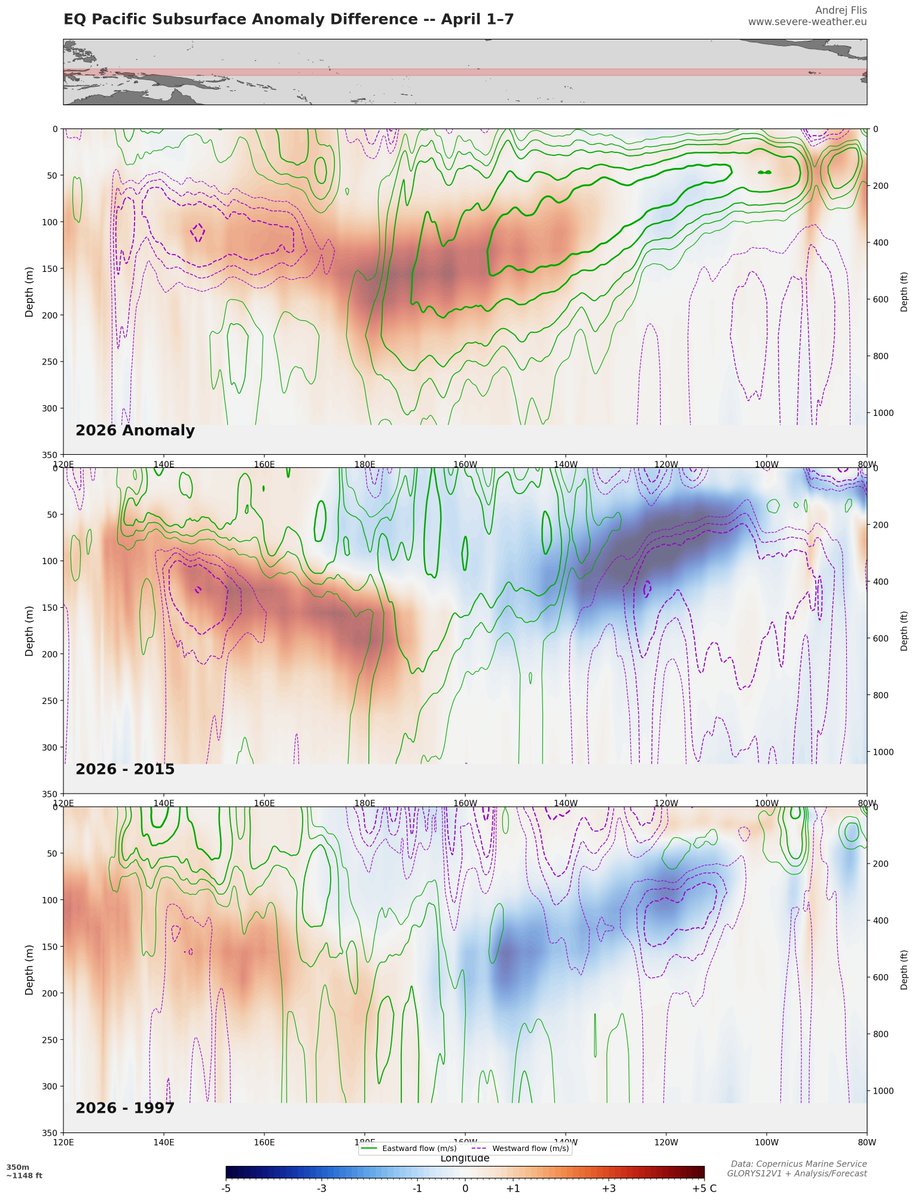
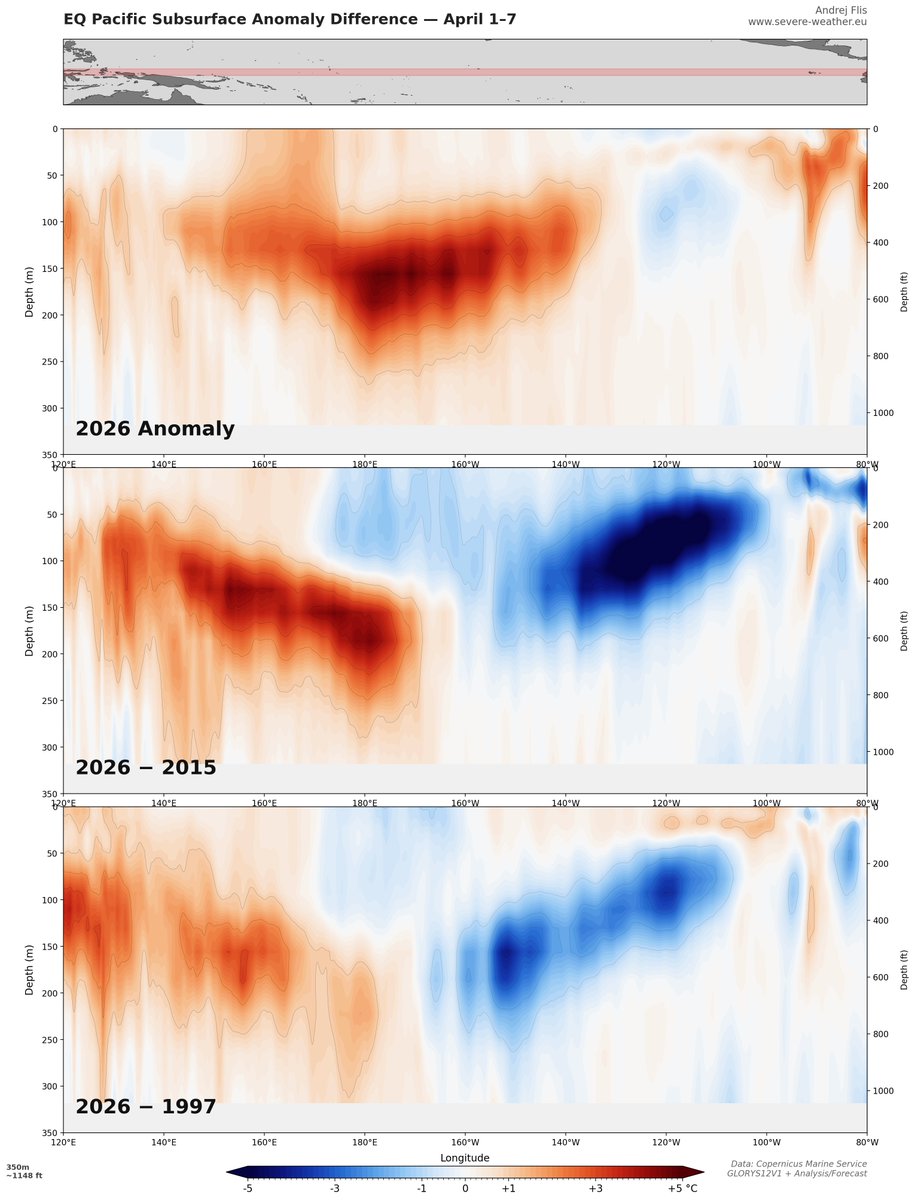
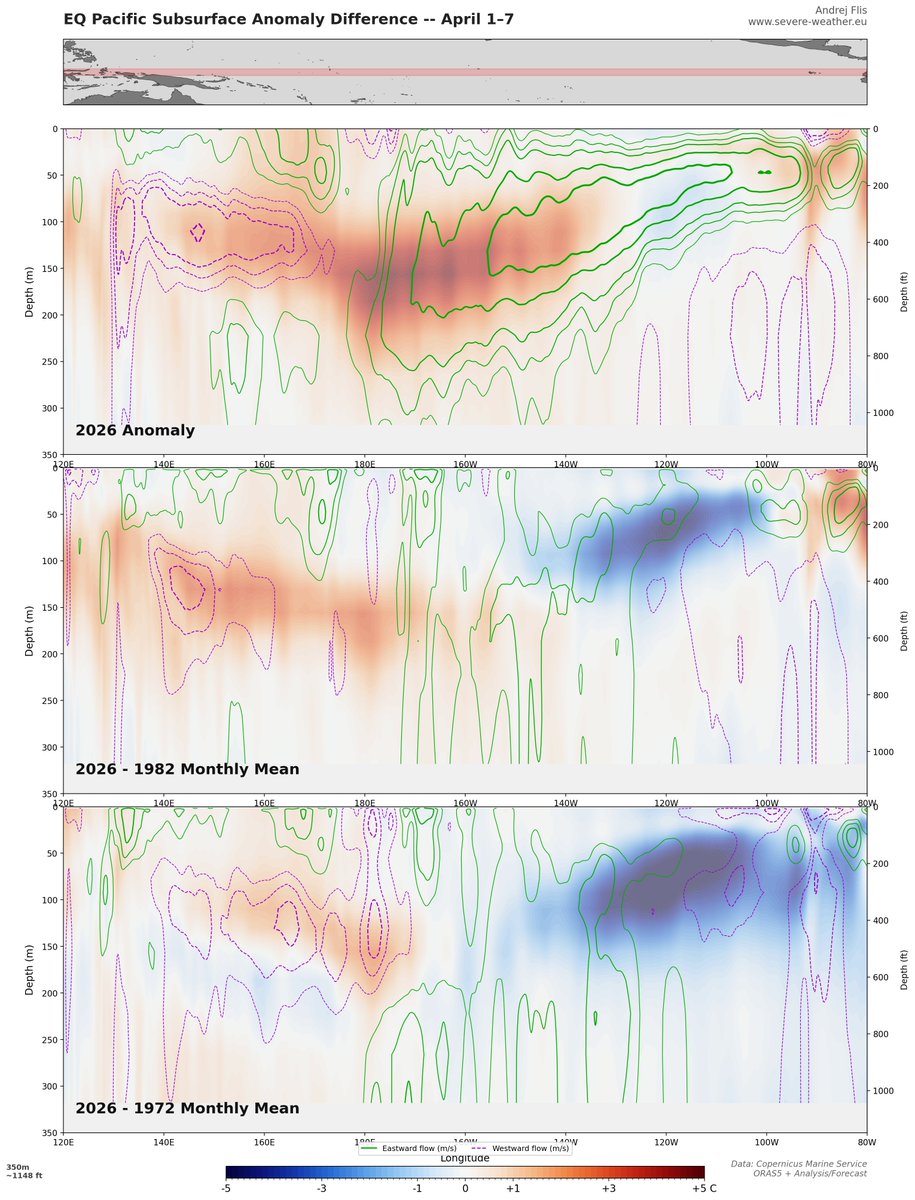
The final comparison is a simple subtraction of anomaly fields, which shows the true delta between the events, with a much stronger western OHC in 2026, and a closer resemblence to 1997 than 2015.
4
3
18
2,719
I decided to also load the zonal flow data for depth, and overlay the 2026 with the latest mean, and also do a comparison where/how the 2026 shows stronger/weaker zonal flow compared to past events. Will be really interesting to see the 2026 analysis plot in a week or two after the upcoming round of WWBs. But overall, stronger westerlies in the west are evident versus all years.
1
6
579
A very interesting Polar Vortex shape on the 00z GFS at the end of the run, with the split core trying to make its best "tornado" appearance over North America. 😅 (for visual purposes only) @judah47
3
3
34
2,807
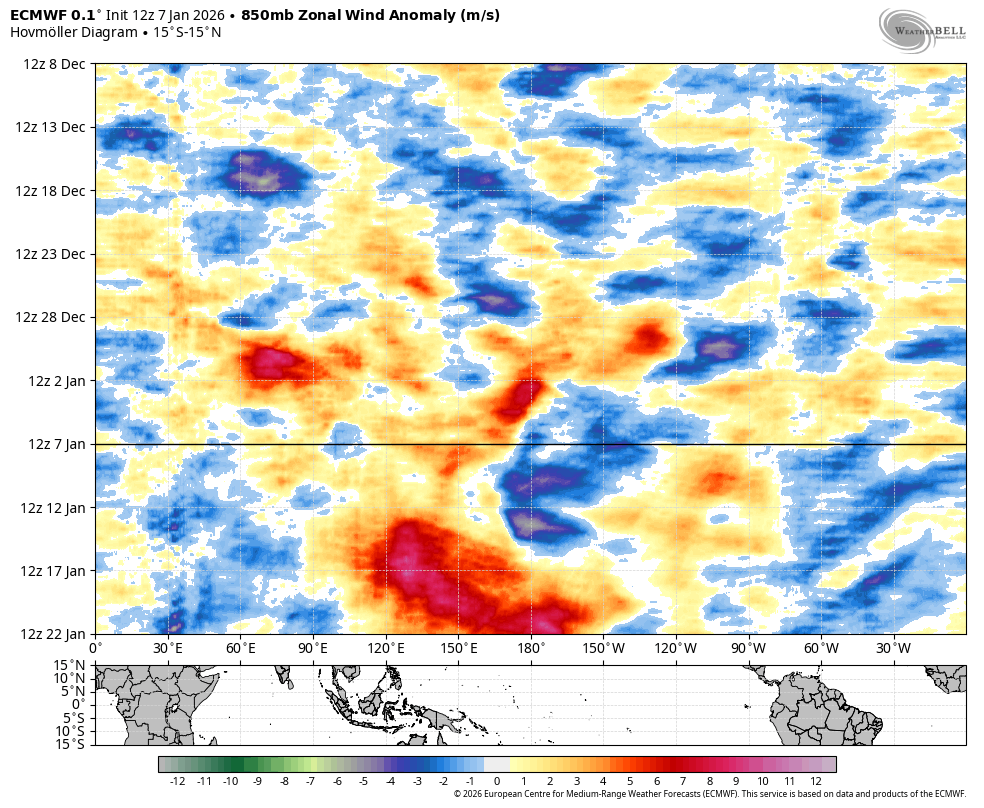
Good night, La Niña… That is an impressive mid-winter westerly wind burst that will start to erode the cold ENSO anomalies. An El Niño development is expected for mid-late 2026, impacting the 2026/2027 Winter Season
1
7
495

10 Nov 2025
The 3D Polar Vortex (150mb-1mb, colors are temps) as seen in the 12z GFS forecast, which has a zonal wind reversal, and by definition, an official SSW (sudden stratospheric warming) event. Not to say that this forecast will stick, but I just decided to use this run to make a 3D representation of a solid wave 1 Polar Vortex disruption. @judah47 @Aigle_e @Superchri90 @webberweather @BenNollWeather
10
15
85
25,026
17 Sep 2025
Allow me to properly introduce the 2025/2026 Stratospheric Polar Vortex, with a GFS forecast video, showing its proper emergence over the North Pole. I would wish it good luck, but as a cold-weather fan, I would rather see it collapse in about two months' time... 😁 @judah47 @PvForecast
2
13
1,139
8 Sep 2025
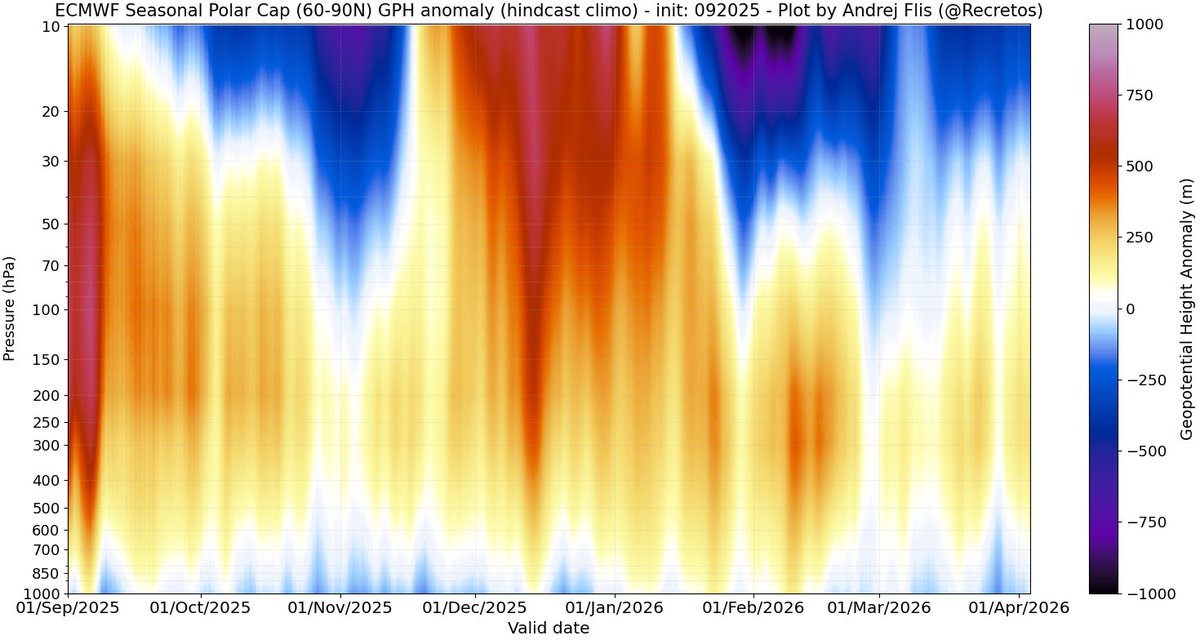
My new test plot from the subdaily ECMWF seasonal data, this time a Polar Cap height anomaly, shows a SPV disruption in December. Of course, these are unreliable at greater lead times, so take it with some reserve, but I like to make these plots to dissect the forecast data deeper. There might also be a hint of some model struggles to do a proper coupling after such an event in the SEAS5, or event coupling a strong SPV. @Aigle_e @Superchri90 @webberweather
4
4
53
4,064
8 Sep 2025
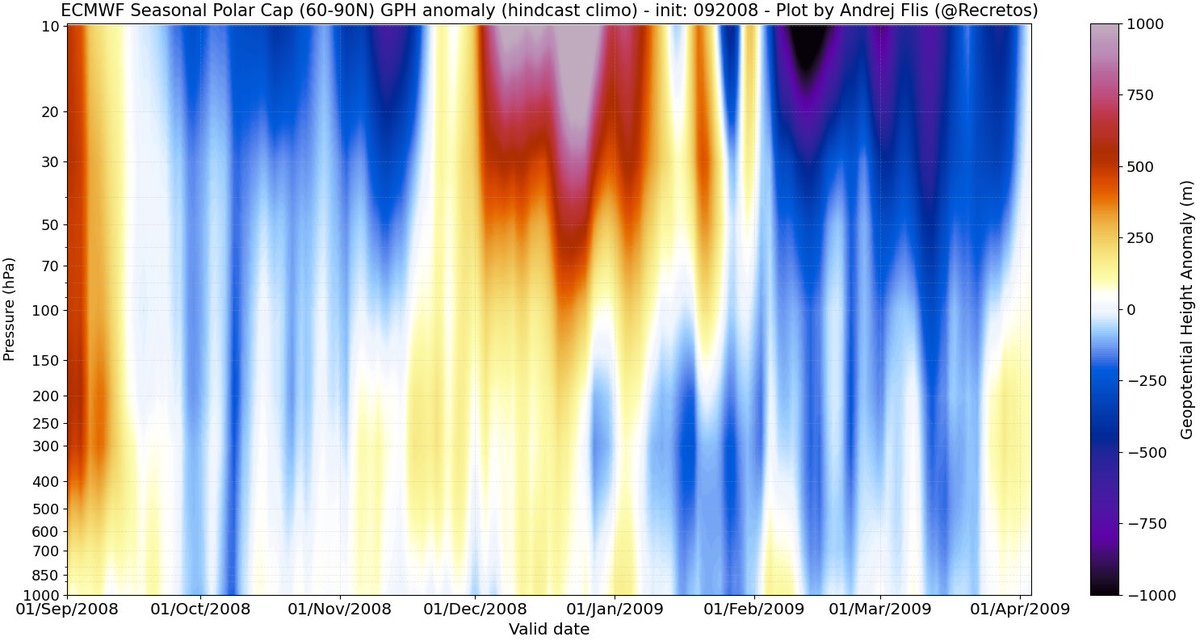
But looking at the hindcast data for 2008/2009 and 2012/2013, it did show some strong dynamics in late 2008 before the 2009 SSW event (still a bit too early), but failed on the coupling. While in 2012, it completely missed the SSW event in early 2013, showing a strong SPV instead @Aigle_e @Superchri90 @webberweather
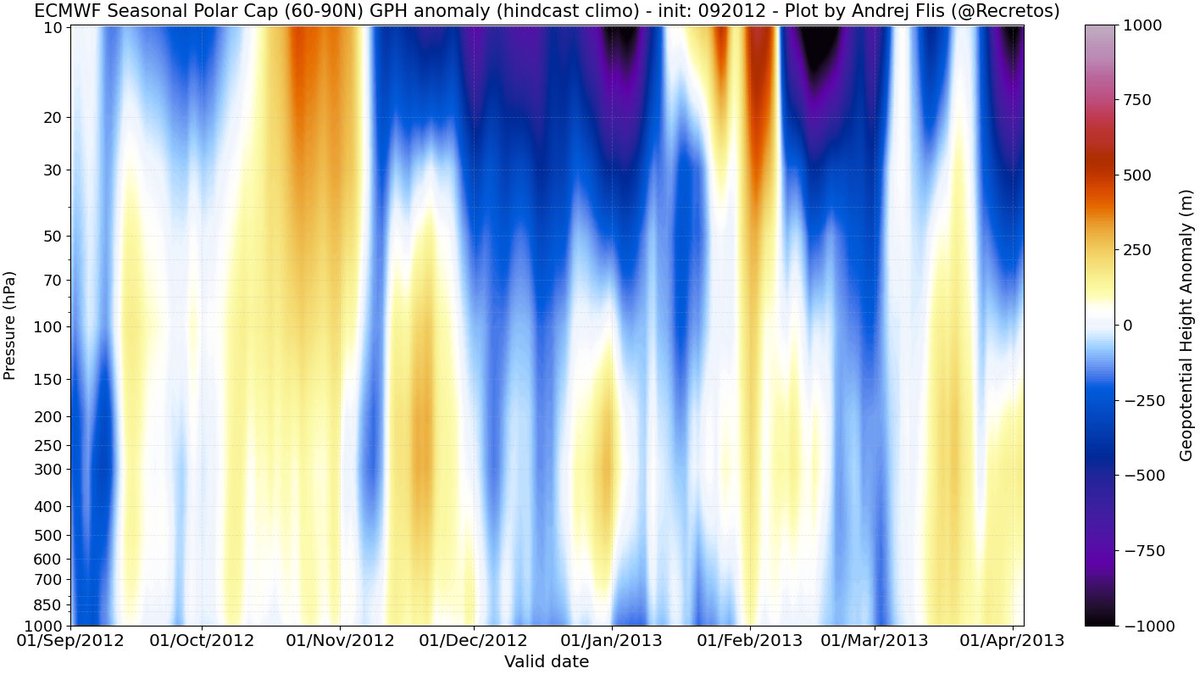
8
643
6 Sep 2025
The latest run of the subdaily ECMWF stratospheric Polar Vortex data, showing the weaker than normal Polar Vortex in December, This comes with the other factors that favor a weaker SPV, like the weak La Nina, a stong negative IOD and a combination with an easterly QBO. @judah47
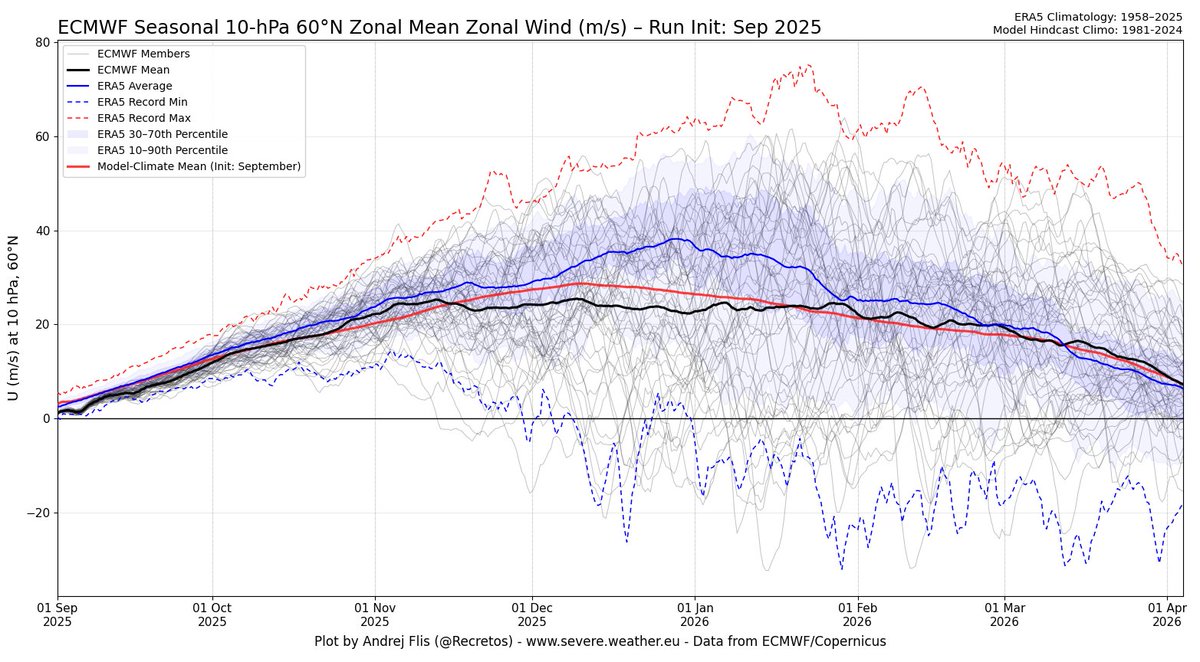
3
4
33
2,890