
👑 Crypto Queen 🚀 Calling gems before they moon 😎 DYOR=Do Your Own Research 🎁 Solana Wallet: ENDSL5DYyiEFCn3uNcVcwJJEtQpAZYr5gARYzN57U6ua
Joined February 2021
- Tweets 288
- Following 76
- Followers 298
- Likes 168
148 Photos and videos


30 Mar 2025
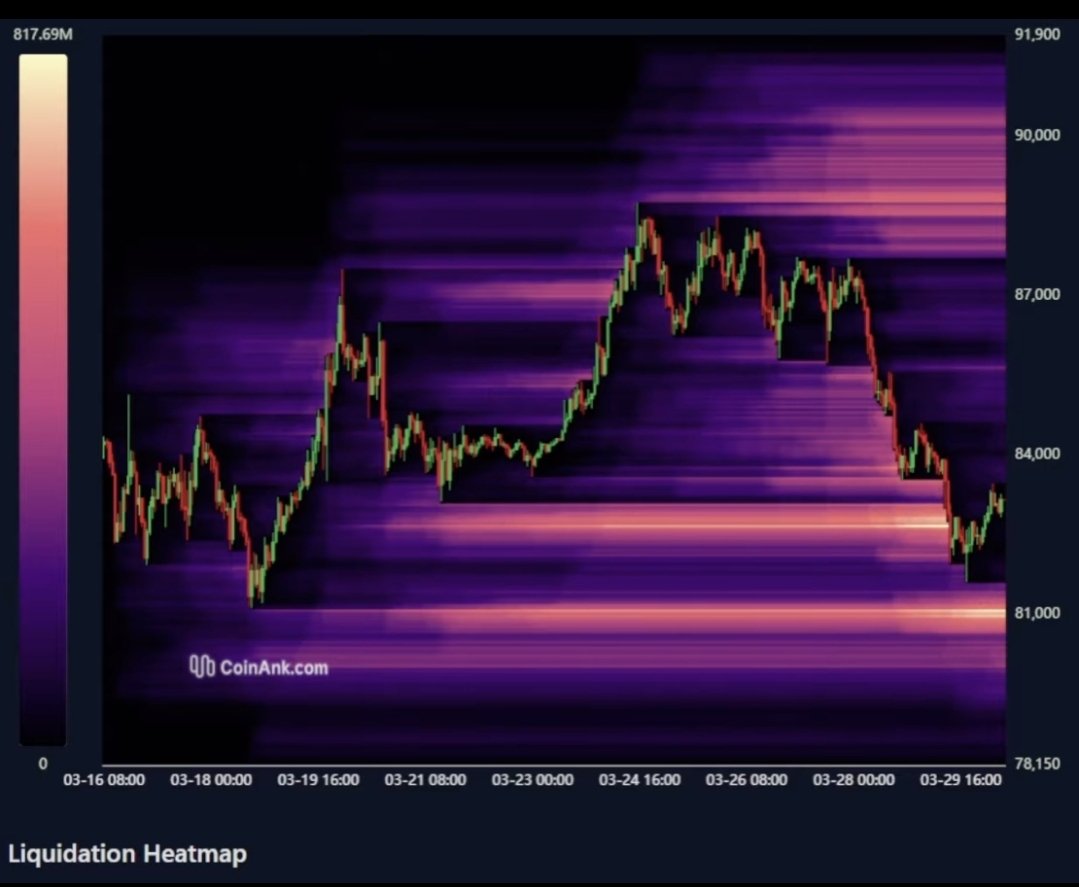
🚨 #Bitcoin: Sharp Drop ⚠️ Major Liquidity Zones Taken!
BTC has fallen significantly, clearing key liquidity zones. This downtrend has now built up fresh liquidity overhead, particularly between $86K–$88K.
🔍 Key Insights:
- The two-week chart shows the large liquidity block down to $81,600 has already been tapped.
- While some liquidity remains below, the largest zone has been cleared.
- Excessive vector candles during the recent upward move hinted at an unhealthy rally, confirmed by our Trademania indicator’s early warning.
The speed of this Saturday drop was unexpected—will BTC bounce back next week or continue sliding? Share your thoughts! 👇💬
#BTC #CryptoNews #BitcoinMarket #Bearish #Bullish
1
2
661
26 Mar 2025
🚨 Bitcoin Nears Key Resistance – Will $90K Be the Breakout? 📊
#Bitcoin has rebounded from its multi-week low of $76,642, climbing toward a critical resistance at $90,000. A breakout above the 50-day moving average ($90,034) could open the path to the next target at $92,920.
🔍 Key Levels:
- Support: $85,240 (200-day MA).
- Resistance: $90,034 (50-day MA), $92,920 (interim high).
💡Potential Boost: A proposal from Trump’s advisor to convert U.S. gold reserves into Bitcoin could drive long-term demand.
While the market shows signs of recovery, momentum remains limited without a clear catalyst. Long-term prospects remain bullish—will BTC break resistance or consolidate further?
#BTC #CryptoNews #BitcoinMarket #Bullish
1
1
529
18 Mar 2025
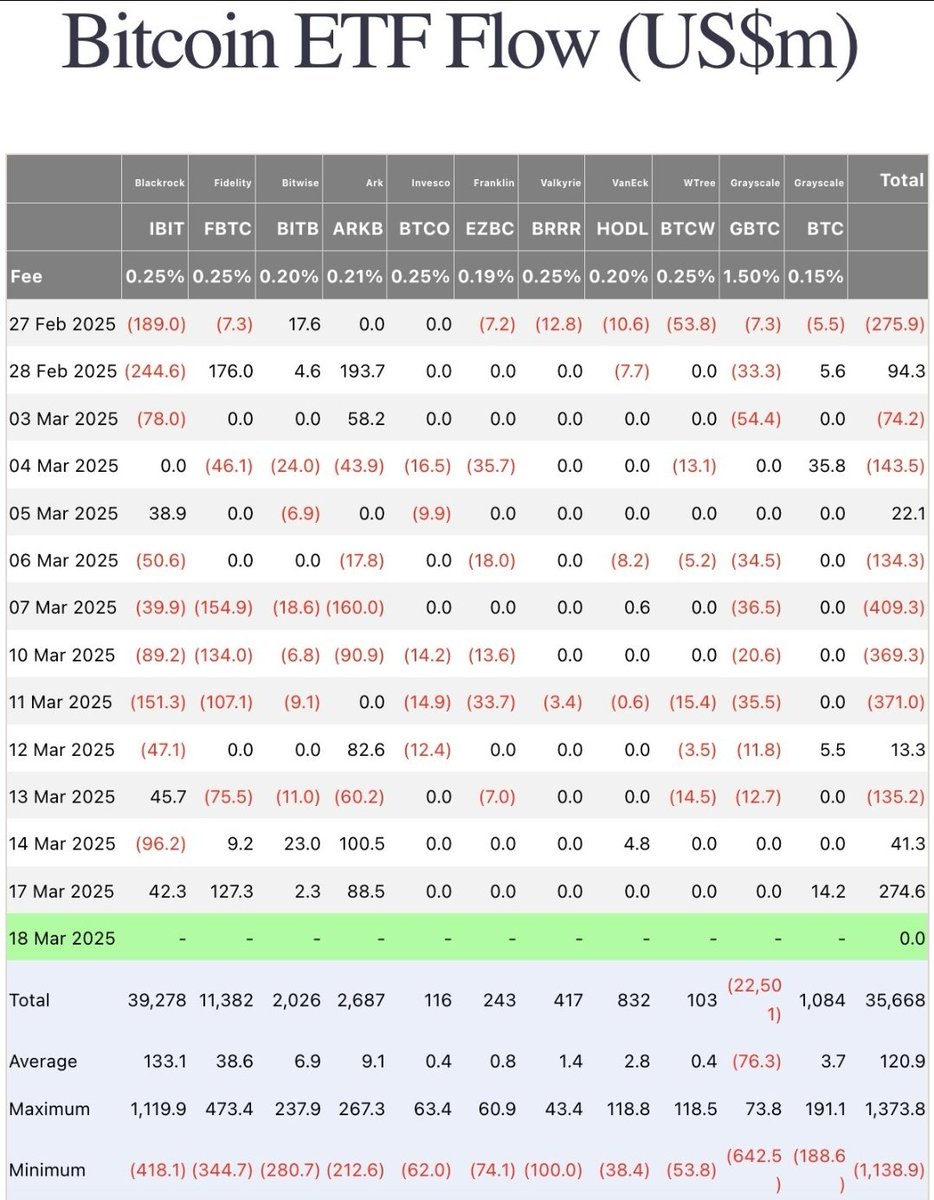
🚨 Bitcoin Spot ETFs Attract $274.6M Inflows – Bullish Signal? 📈
After weeks of outflows, #Bitcoin Spot ETFs saw their largest daily inflow in six weeks, with $274.6M added on March 17. Leading the charge:
- Fidelity (FBTC): $127.3M
- ARK Invest (ARKB): $88.5M
- BlackRock (IBIT): $42.3M
This surge signals renewed institutional confidence, likely driven by BTC’s price stabilization around $83K and quarter-end portfolio rebalancing.
Could this mark the start of a bullish trend for Bitcoin? Watch key levels:
- Support: $82K–$80K
- Resistance: $85.5K–$88K
What’s your outlook—reversal or temporary relief? 👇💬
#BTC #BitcoinETF #CryptoNews #CryptoMarket #Bullish
1
1
576
18 Mar 2025
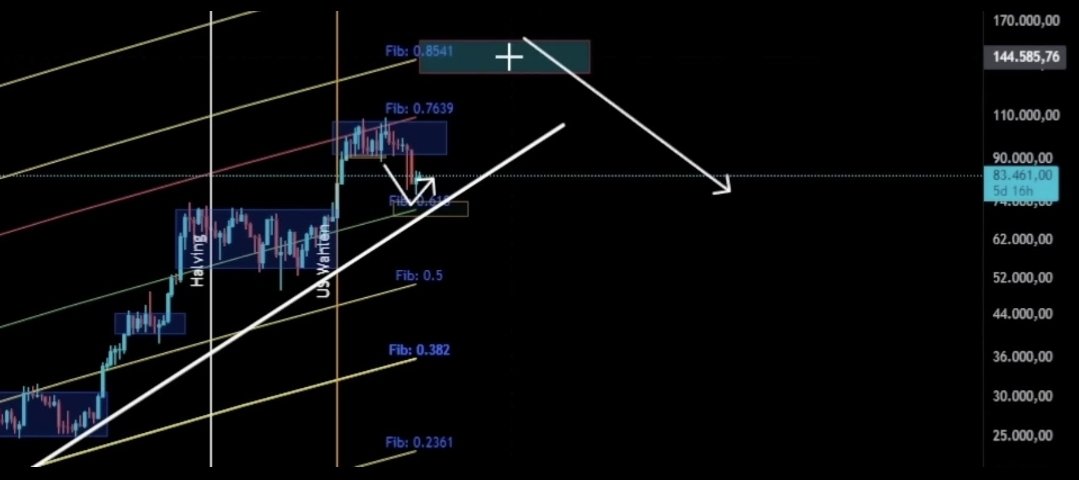
🚨 Bitcoin Weekly Chart: Bullish Potential or Extended Correction? 📊
The #Bitcoin weekly chart remains below its target zone, suggesting more upside potential exists. The logarithmic curves continue to provide reliable support and resistance levels that have guided BTC’s trajectory since its inception.
🔍 Key Insights:
- BTC has yet to reach the upper zone of the weekly chart, indicating room for growth over the next 3–5 months.
- Short-term downside remains possible, with support at $80,000–$81,000 acting as a key defense zone.
🟢 Bullish Scenario:
If BTC holds above $80K and breaks $86K:
- Target 1: $88,000 (key resistance).
- Target 2: $96,000–$100,000 (major breakout level).
Catalyst: Renewed demand from spot Bitcoin ETFs and easing macroeconomic pressures.
🔴 Bearish Scenario:
If BTC loses $80K support:
- Target 1: $75,000 (critical liquidity zone).
- Target 2: $70,530–$66,810 (potential deeper correction).
Risk factors: Continued ETF outflows and geopolitical uncertainty.
📌 Outlook: Bitcoin’s bullish trajectory remains intact on higher timeframes, but short-term volatility could lead to deeper corrections before resuming upward momentum. The next few months will be crucial in determining whether BTC can reclaim higher levels and set new all-time highs by May 2025.
What’s your take—bullish breakout or extended correction? Share your thoughts below! 👇💬
#BTC #Bitcoin #CryptoNews #CryptoMarket #Bullish #Bearish
1
2
434
17 Mar 2025
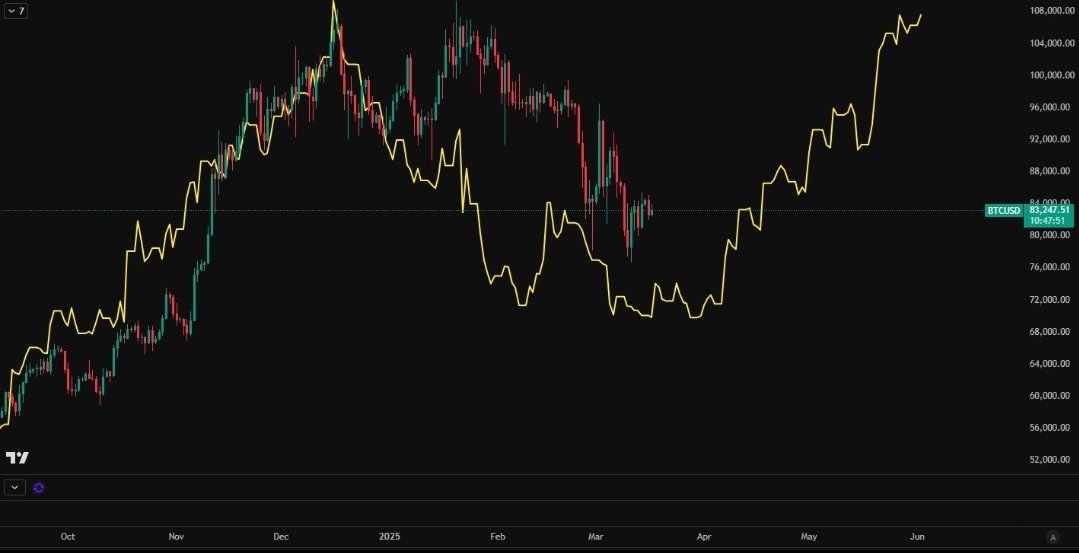
Bitcoin vs. Global Liquidity: Is a New All-Time High Coming in May?
This chart compares the #Bitcoin price (candles) with the M2 Global Liquidity (yellow line), shifted 11 weeks forward. The correlation suggests that Bitcoin’s current correction may end by early April, with potential for new all-time highs as early as May 2025.
If liquidity trends hold, Bitcoin could be gearing up for a major rally in Q2 2025. Are you ready for the next move? 👇💬
#BTC #Bitcoin #CryptoNews #GlobalLiquidity #Bullish
1
2
1,006
17 Mar 2025
🚨 Bitcoin Struggles with Key Levels – Is a Sell-Off Coming? 📉
#Bitcoin is trading near $83,300, facing critical resistance while consolidating. The daily chart shows weakness, with price compression hinting at a potential move lower. If BTC fails to break above $86K, a drop toward $82K or lower seems likely.
🔍 Key Levels:
- Support: $82,000–$80,000 (critical zone).
- Resistance: $85,000–$86,000 (immediate barrier), $88,000 (major breakout level).
🟢 Bullish Scenario:
If BTC breaks above $86K:
- Target 1: $88,000 (key resistance).
- Target 2: $92,000–$96,000 (next major zone).
Catalyst: Increased volume and renewed buying pressure could signal a reversal.
🔴 Bearish Scenario:
If BTC loses $82K support:
- Target 1: $80,000 (psychological level).
- Target 2: $75,700–$73,600 (major liquidity zone).
Risk factors: Continued ETF outflows and weak market sentiment.
📌 Thoughts: Bitcoin remains in a critical phase. A breakout above $86K could trigger bullish momentum toward $90K , but failure to hold support risks deeper corrections to $80K or lower. The next few days will be decisive as volatility remains high.
What’s your outlook—bullish breakout or deeper correction? Share your thoughts below! 👇💬
#BTC #CryptoNews #Bitcoin #CryptoMarket #Bullish #Bearish
1
1
281
16 Mar 2025
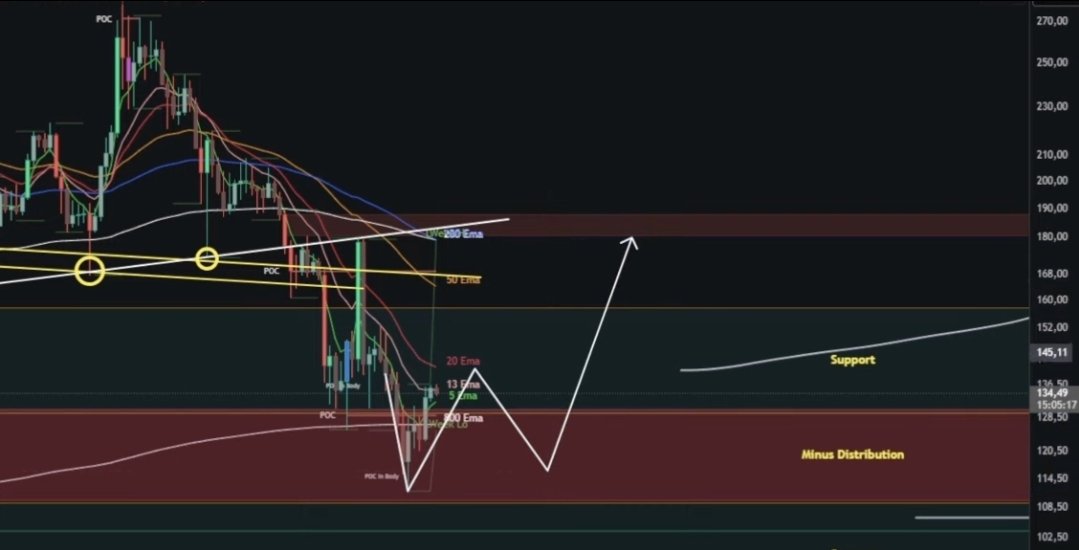
🚨 Solana Price Analysis – March 16, 2025 📊
The chart shows Solana (SOL) in a critical phase, consolidating near $134.49. The price is stuck in a downtrend, but key levels and patterns suggest potential for both bullish and bearish scenarios.
🔍 Key Levels:
- Support Zones: $128–$114 (critical range).
- Resistance Zones: $152 (short-term), $180 (major breakout level).
🟢 Bullish Scenario:
If SOL holds above $128 and breaks $152 resistance:
- Target 1: $180 (key breakout level).
- Target 2: $200 (next major resistance).
Catalyst: A breakout above the 50 EMA and increased volume could signal a trend reversal.
🔴 Bearish Scenario:
If SOL loses $128 support:
- Target 1: $114 (key support zone).
- Target 2: $102–$100 (potential deeper correction).
Risk factors: Continued market-wide pressure or failure to reclaim moving averages.
📈 Prediction:
Solana is likely to test the lower support zone ($128–$114) before attempting a recovery. A bounce from this range could push prices toward $152–$180, but failure to hold support risks further downside to $100.
The next few days will be crucial—will Solana break out of its downtrend or continue its descent? Share your thoughts! 👇💬
#Solana #SOL #CryptoNews #CryptoMarket #Bullish #Bearish #Investing
1
1
253
16 Mar 2025
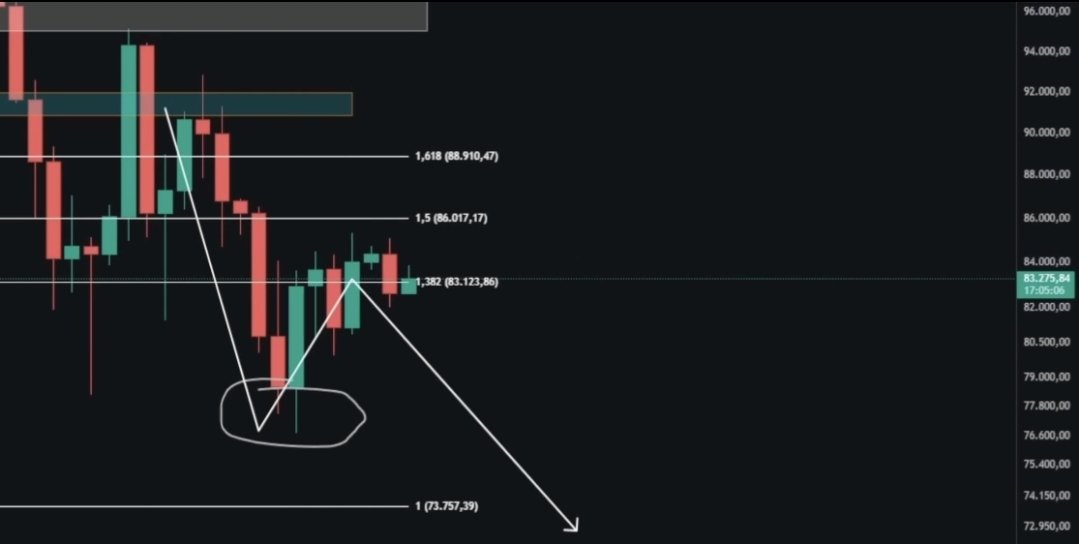
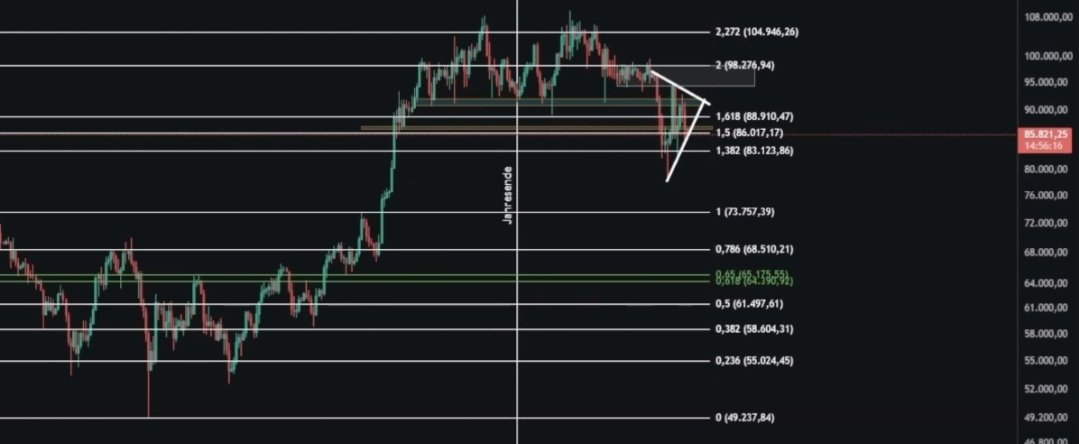
🚨 Bitcoin in Limbo: Is Another Sell-Off Looming? ⚠️
The #Bitcoin daily chart reveals a critical setup as the price consolidates around $83,000, testing key Fibonacci levels. While BTC remains above $80K, the structure suggests potential downside risks if support fails.
🔍 Key Levels:
- Support: $83,123 (1.382 Fib), $80,000 (psychological level), $73,757 (major liquidity zone).
- Resistance: $86,017 (1.5 Fib), $88,910 (1.618 Fib), $98,276 (upper range).
🟢 Bullish Scenario:
If BTC breaks above $86K:
- Target 1: $88,910 (Fibonacci resistance).
- Target 2: $92,000–$98,000 (major breakout zone).
Indicators to watch: RSI divergence and increased volume signaling renewed buying pressure.
🔴 Bearish Scenario:
If BTC loses $80K support:
- Target 1: $73,757 (next major liquidity zone).
- Target 2: $68,000 (potential deeper correction).
Risk factors: Continued ETF outflows and macroeconomic uncertainty.
📌 Thoughts: Bitcoin remains at a crossroads—while a bullish breakout above $86K could signal upward momentum toward $90K , failure to hold support risks further downside to $74K or lower. The next few days will be crucial as volatility remains high.
What’s your outlook—bullish recovery or deeper correction? Share below! 👇💬
#BTC #CryptoNews #Bitcoin #CryptoMarket #Bullish #Bearish
1
1
206
14 Mar 2025
🚀 Ethereum (ETH) Price Analysis – March 14, 2025 📊
Ethereum is currently trading at $1,932, showing resilience despite recent market volatility. With Bitcoin ETF outflows weighing on sentiment, ETH remains below the $2,000 psychological level but is holding key support zones.
🔍 Key Levels:
- Support: $1,900 (critical), $1,850 (recent low), $1,800 (major psychological level).
- Resistance: $1,950 (immediate), $2,000 (psychological barrier), $2,050 (key breakout zone).
🟢 Bullish Scenario:
If ETH breaks above $1,950 with strong volume:
- Target 1: $2,000 (psychological level).
- Target 2: $2,050–$2,100 (next major resistance).
Catalysts: Positive sentiment around Ethereum’s deflationary tokenomics post-EIP-1559 and institutional adoption for DeFi and tokenization.
🔴 Bearish Scenario:
If ETH loses $1,900 support:
- Target 1: $1,850 (recent low).
- Target 2: $1,800–$1,750 (major downside risk).
Risk factors: Continued Bitcoin ETF outflows and high gas fees limiting network activity.
📈 Market Drivers:
- Deflationary Tokenomics:** ETH burning mechanisms continue to reduce supply while staking limits circulating tokens.
- Institutional Interest: Ethereum remains dominant in DeFi and tokenization of real-world assets.
- Layer 2 Adoption: Growing use of Layer 2 solutions like Arbitrum and Optimism could ease congestion and improve scalability.
📌 Forecast: Ethereum is likely to consolidate between $1,900–$1,950 in the short term as the market digests broader crypto sentiment. A breakout above $2,000 could spark bullish momentum toward $2,100 , while failure to hold support risks deeper corrections to $1,850 or lower.
Will Ethereum reclaim $2K or test deeper levels? Share your thoughts below! 👇💬
#Ethereum #ETH #CryptoNews #CryptoMarket #Bullish #Bearish #Investing
159
14 Mar 2025
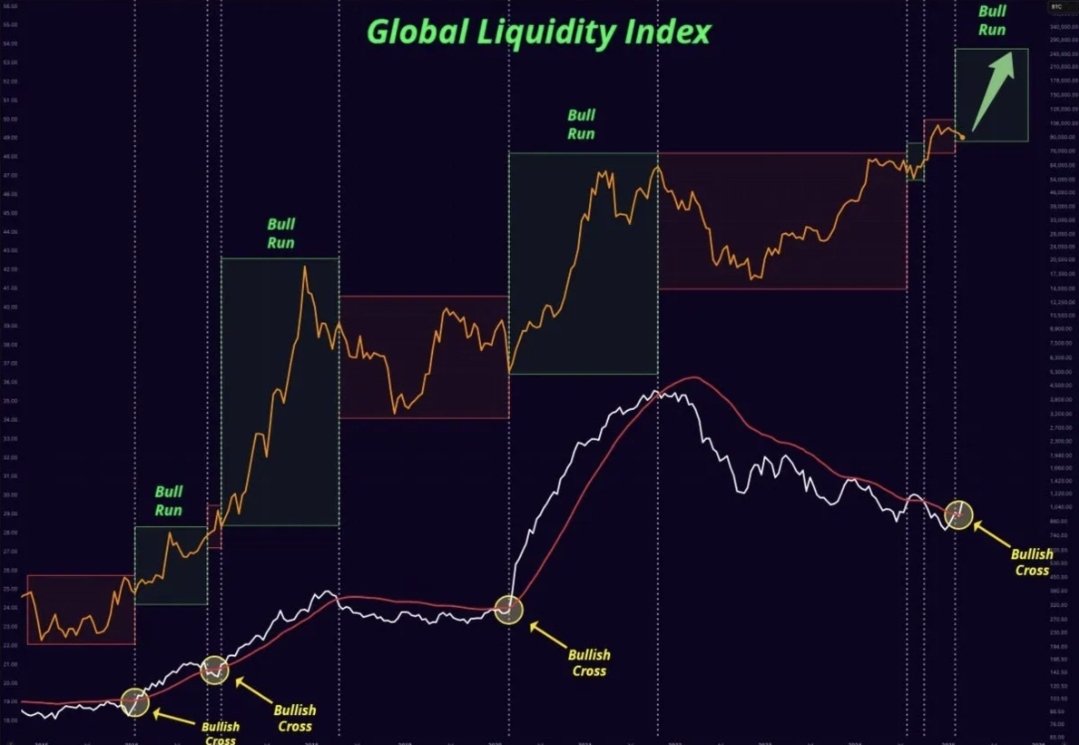
🚀 Liquidity Index Signals Bullish Times for Bitcoin!
The #Bitcoin Liquidity Index has historically signaled the start of major bull runs. Each time we've seen a bullish cross between the lines, a strong upward movement has followed.
Currently, this index is flashing a bullish signal—despite BTC's recent drop. This suggests the long-term uptrend remains intact with global liquidity expanding from $102T to $107T in 2025.
While short-term pullbacks may occur, on-chain metrics continue turning positive with a medium-term price target of $140K-$160K.
Are you positioned for the next leg up? 👇💬
#BTC #CryptoNews #Bullish #GlobalLiquidity #BitcoinBullRun
1
1
161
12 Mar 2025
⚠️ Bitcoin Spot ETFs See Massive Outflows: A Warning Sign?
#Bitcoin Spot ETFs recorded $369M in outflows on March 10 and $371M yesterday, adding significant selling pressure to BTC. If this trend continues, it could hinder the crypto market’s ability to stage a strong recovery in the short term.
The next few days will be crucial—will inflows return and spark bullish momentum, or will outflows persist and weigh further on prices?
What’s your take—reversal or more downside ahead? 👇💬
#BTC #CryptoNews #BitcoinETF #CryptoMarket #Bearish
1
1
163
11 Mar 2025
⚠️ Bitcoin Trend Reversal or Just a Recovery? 📊
Indicators show early signs of a potential recovery. The Moving Average hints at a slight bullish cross, signaling a possible trend reversal. If confirmed, Bitcoin could see short-term gains.
The RSI is in oversold territory—historically a precursor to rebounds as selling pressure eases. However, Bitcoin faces strong resistance zones formed by vector candles.
A move to $83K–$84K is possible, but a sustained trend change remains uncertain. The next few hours will reveal if BTC starts a real recovery or confirms further shorts.
What’s your take—rebound or continuation? 👇💬
#BTC #Bitcoin #CryptoNews #CryptoMarket #Bullish #Bearish
1
1
123
10 Mar 2025
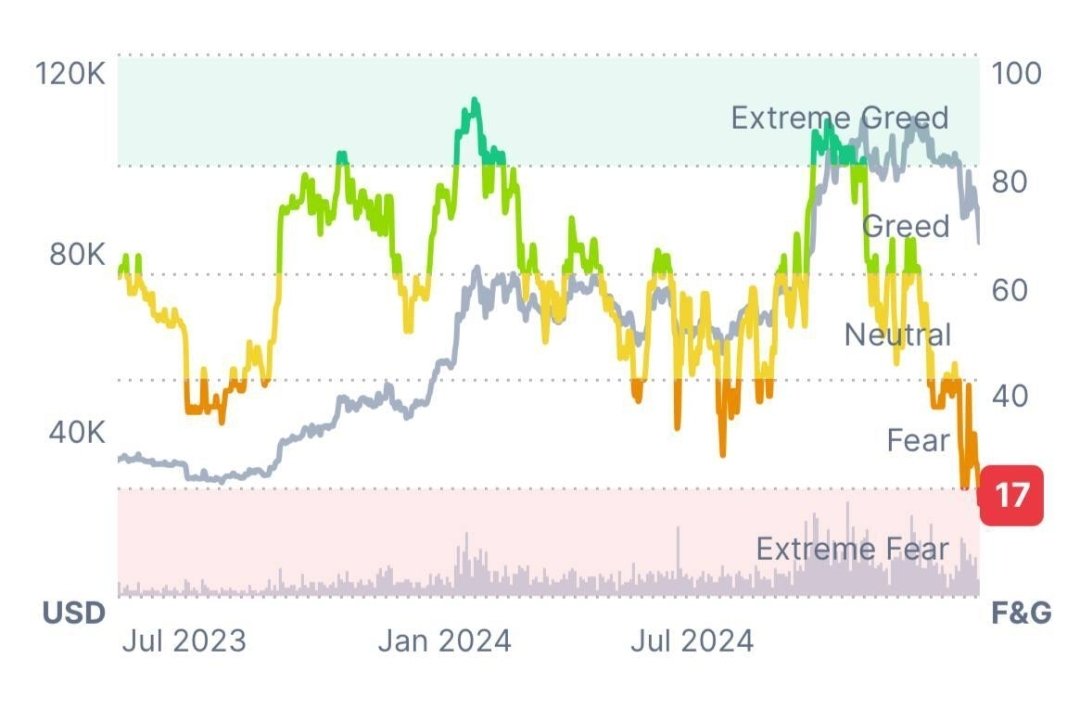
🚨 Fear & Greed Index at 17: Is This the Best Time to Buy Bitcoin? 📉
The #Bitcoin Fear & Greed Index has plunged to 17, signaling Extreme Fear in the market. Historically, such low levels have often aligned with major buying opportunities, as fear-driven sell-offs can create undervalued conditions for long-term investors.
🔍 Key Insights:
1️⃣ Market Sentiment: Extreme Fear reflects uncertainty and panic selling, but contrarian investors often view this as a chance to accumulate assets at discounted prices.
2️⃣ Price Levels: Bitcoin is trading near $83,000, down significantly from its all-time high of $109,356 in January 2025. This correction offers a potential entry point for those eyeing long-term gains.
3️⃣ Historical Trends: Similar dips in sentiment (e.g., July 2023 and June 2024) preceded strong rallies as market confidence returned.
📈 Why It Could Be a Buy Opportunity:
- Institutional Support: Increasing adoption by major players like BlackRock and MicroStrategy continues to bolster Bitcoin’s long-term outlook.
- Regulatory Clarity: The U.S. government’s Strategic Bitcoin Reserve announcement reinforces Bitcoin’s legitimacy as a reserve asset.
- Scarcity Value: With only 21 million BTC ever available and the post-halving supply impact already priced in, demand could outpace supply as sentiment recovers.
⚠️ Risks to Consider:
- Short-term volatility remains high, and further downside toward $74K or $68K is possible if key support levels fail.
- Broader macroeconomic factors, such as interest rate hikes or regulatory changes, could weigh on crypto markets.
Conclusion: Extreme Fear often signals opportunity for patient investors willing to weather short-term volatility. If Bitcoin holds above key support levels like $80K, this could mark the beginning of a recovery phase. However, risk management is essential—watch for confirmation signals like increased volume or sentiment improvement before making a move.
What’s your strategy—buy the dip or wait for clearer signs? Share your thoughts below! 👇💬
#BTC #CryptoNews #Bitcoin #FearAndGreed #Investing #CryptoMarket
1
1
224
10 Mar 2025
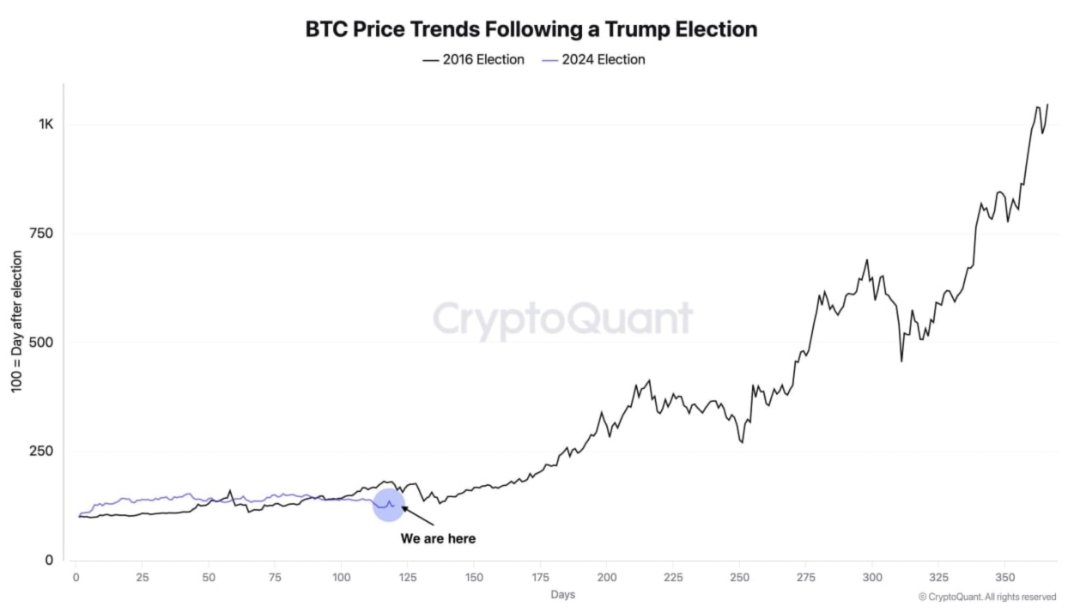
🗳️ Trump’s Election and Bitcoin: Will History Repeat Itself? 📊
In 2016, after Donald Trump’s election, #Bitcoin showed little movement initially. However, 150–175 days later, BTC began a massive rally. Could we see a similar pattern this time?
Today’s market is different—Bitcoin now plays a much larger role in the financial system. But uncertainty remains: Trump’s policies and unpredictable decisions could bring volatility to markets.
Will Bitcoin react the same way or take a new path this time? Share your thoughts! 👇💬
#BTC #CryptoNews #Bitcoin #TrumpElection #CryptoMarket #ElonMusk #Trump #Ethereum #ETH #btcusdt
1
1
140
9 Mar 2025
⚠️ Bitcoin Weekly Chart: Just a Correction or the Start of a Bear Market? 📉
The #Bitcoin weekly chart shows a delicate market structure. While BTC has seen a correction, the overall long-term trend remains intact—for now. Even a drop to $74K or $70K would still align with the broader bullish trend.
Crucially, Bitcoin is holding above the 0.618 Fibonacci level (~$68K). A break below this key support could trigger a deeper sell-off, potentially targeting $68K or lower.
Volatility remains high, but from a technical perspective, there’s no reason to panic yet—long-term trends are still intact. The next few weeks will be critical to see if BTC holds support and begins a new upward move.
What’s your take—bullish recovery or deeper correction? Share below! 👇💬
#BTC #CryptoNews #Bitcoin #CryptoMarket #Bullish #Bearish
1
1
211
9 Mar 2025
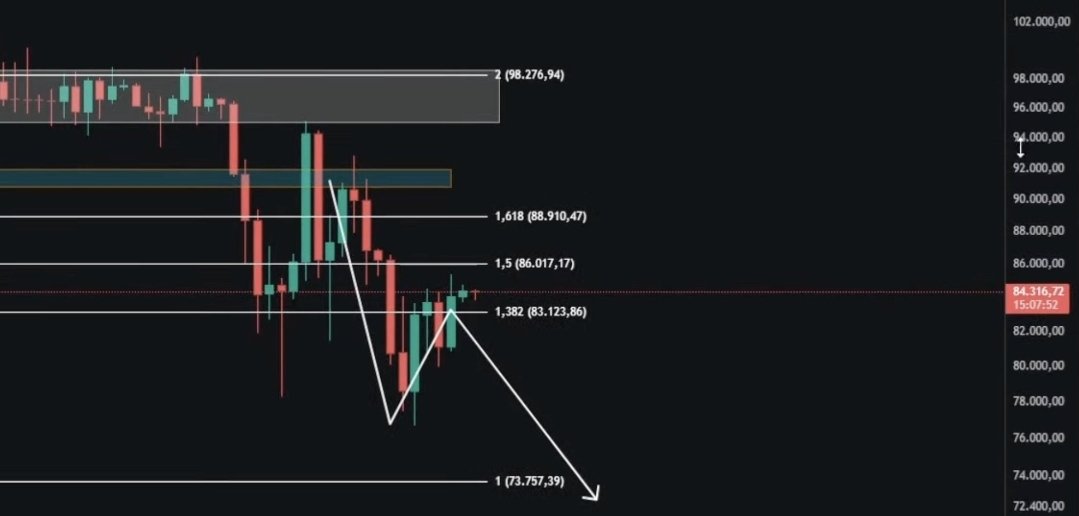
🚨 Bitcoin Price Analysis – March 9, 2025 📊
#Bitcoin is trading around $83,000, testing critical support levels. The daily chart shows BTC consolidating near the 1.618 Fibonacci level ($86,017), with a potential breakout or breakdown looming.
🔍 Key Levels to Watch:
- Support: $83,123 (1.382 Fib) and $80,000 (psychological level).
- Resistance: $86,017 (1.618 Fib) and $88,910 (upper trendline).
🟢 Bullish Scenario:
If BTC holds above $83K and breaks above $86K:
- Target 1: $88,910 (trendline resistance).
- Target 2: $92,000–$94,000 (next major resistance zone).
Indicators to watch: RSI climbing above 50 and volume spikes on breakout.
🔴 Bearish Scenario:
If BTC loses $83K support:
- Target 1: $80,000 (psychological level).
- Target 2: $74,000–$68,000 (major liquidity zones).
Indicators to watch: RSI dropping below 40 and bearish MACD crossover.
📈 Market Drivers:
- Institutional Adoption: Increased holdings by firms like BlackRock and MicroStrategy continue to support long-term growth.
- Regulatory Clarity: Positive developments in the U.S., including the Strategic Bitcoin Reserve, boost investor confidence.
- Hashrate Strength: All-time high network security (~872 EH/s) reinforces market stability.
📌 Forecast: Bitcoin is at a pivotal point near key Fibonacci levels. A breakout above $86K could spark bullish momentum toward $92K , while failure to hold support risks deeper corrections to $80K or lower.
Will BTC rally or face further downside? Share your thoughts below! 👇💬
#BTC #CryptoNews #Bitcoin #CryptoMarket #Bullish #Bearish #Investing #Ethereum #xrp #solana #btcusdt #btcudsc
1
1
122
9 Mar 2025
⚠️ Bitcoin Worst-Case Scenario: Could $68K Be Next? 📉
The #Bitcoin daily chart shows a critical setup: if BTC fails to hold the current support level, a drop to $74K or even $68K could follow. A sustained break below $80K would expose massive liquidity zones, increasing the risk of a sharp sell-off.
However, strong buy zones between $75K–$70K could support a potential bounce.
The next few days are crucial: staying above $80K might stabilize the market, but falling below could trigger deeper corrections. Volatility remains high—stay prepared for fast moves!
#BTC #CryptoNews #Bitcoin #CryptoMarket #Bearish #Trading
1
2
102
9 Mar 2025
🚨 Bitcoin Weekly Close Watch: Extreme Bullish Signal Incoming?
#Bitcoin is trading at $86,426, hovering near the critical zone on the weekly chart. If BTC closes this weekly candle above the red line, it could confirm an extremely bullish signal, potentially setting the stage for a strong rally.
Will Bitcoin hold above this key level or face rejection? Share your thoughts below! 👇💬
#BTC #CryptoNews #Bitcoin #CryptoMarket #Bullish #Investing #BTCUSDT #Crypto
1
1
145
8 Mar 2025
Binance Coin (BNB) Daily Price Analysis – March 8, 2025 📊
#BNB is trading at $598.50, down 0.31% in the past 24 hours, with a daily range of $589–$607. While short-term bearish pressure persists, BNB remains resilient within its ascending channel, supported by Binance’s ecosystem strength.
🔍 Key Levels:
- Support: $589–$594 (critical zone to hold), $575 (historical support).
- Resistance: $607–$615 (immediate barrier), $640 (major resistance).
🟢 Bullish Scenario:
If BNB holds above $589 and breaks $607 resistance:
- Target 1: $615 (psychological level).
- Target 2: $640 (next major resistance).
Indicators to watch: RSI climbing above 50, volume surge, and ascending channel breakout confirmation.
🔴 Bearish Scenario:
If BNB loses $589 support:
- Target 1: $575 (key historical level).
- Target 2: $560 (deeper downside risk).
Indicators to watch: RSI below 40 and bearish MACD momentum persisting.
📈 Market Drivers:
- Binance Ecosystem Strength: Token burns and BSC adoption continue to underpin BNB’s value, with community sentiment remaining robust.
- Technical Setup: The ascending channel suggests a longer-term bullish trend, but short-term bearish indicators like MACD signal caution.
- Broader Market Trends: BNB’s price is sensitive to Bitcoin movements—BTC recovery could lift sentiment across the board.
📌 Forecast: Binance Coin is likely to consolidate between $589–$607 in the short term. A breakout above $607 could push prices toward $640 or higher, while failure to hold support risks further downside to $575.
Will BNB maintain its resilience or test deeper support levels? Share your thoughts below! 👇💬
#BinanceCoin #BNB #CryptoNews #CryptoMarket #Bullish #Bearish #Investing
1
1
86
8 Mar 2025
🚀 Shiba Inu (SHIB) Daily Price Analysis – March 8, 2025 📊
#ShibaInu is trading at $0.00001282, down 4.17% in the past 24 hours, with a daily range of $0.0000115–$0.000014. Despite the decline, SHIB shows potential for a breakout as it nears the end of a falling wedge pattern.
🔍 Key Levels:
- Support: $0.0000115–$0.000012 (critical buying zone).
- Resistance: $0.0000135–$0.000014 (immediate barrier), $0.00001572 (major resistance).
🟢 Bullish Scenario:
If SHIB holds above $0.0000115 and breaks $0.0000135 resistance:
- Target 1: $0.000014 (psychological level).
- Target 2: $0.00001572 (next major resistance).
Indicators to watch: Falling wedge breakout, RSI climbing above 50, and increased trading volume signaling buyer interest.
🔴 Bearish Scenario:
If SHIB loses $0.0000115 support:
- Target 1: $0.000010 (historical correction zone).
- Target 2: $0.0000095 (deeper downside risk).
Indicators to watch: RSI below 40 and bearish MACD momentum persisting.
📈 Market Drivers:
- Shibarium Adoption: Increased usage of Shibarium’s Layer-2 solution could reduce supply via burns and boost utility, supporting price recovery.
- Community Burns: Recent efforts to burn 18.7M SHIB aim to create deflationary pressure, though the impact remains incremental given the token supply size.
- Broader Market Trends: SHIB’s price is sensitive to Bitcoin and Dogecoin movements—market-wide rallies could lift sentiment.
📌 Forecast: Shiba Inu is at a pivotal point near key support levels. A breakout above $0.0000135 could spark bullish momentum toward $0.00001572 or higher, while failure to hold $0.0000115 risks further downside to $0.000010.
Will SHIB bounce back or test deeper support levels? Share your thoughts below! 👇💬
#SHIB #ShibaInu #CryptoNews #MemeCoin #Bullish #Bearish #Investing #Memecoins #Altcoins

1
1
107