
when you're born, you look like your parents. when you die, you look like your decisions... (🫶/📈) Investor/Trader | CMT Level 2 Candidate
Joined December 2022
- Tweets 11,523
- Following 513
- Followers 1,812
- Likes 60,069
5,386 Photos and videos
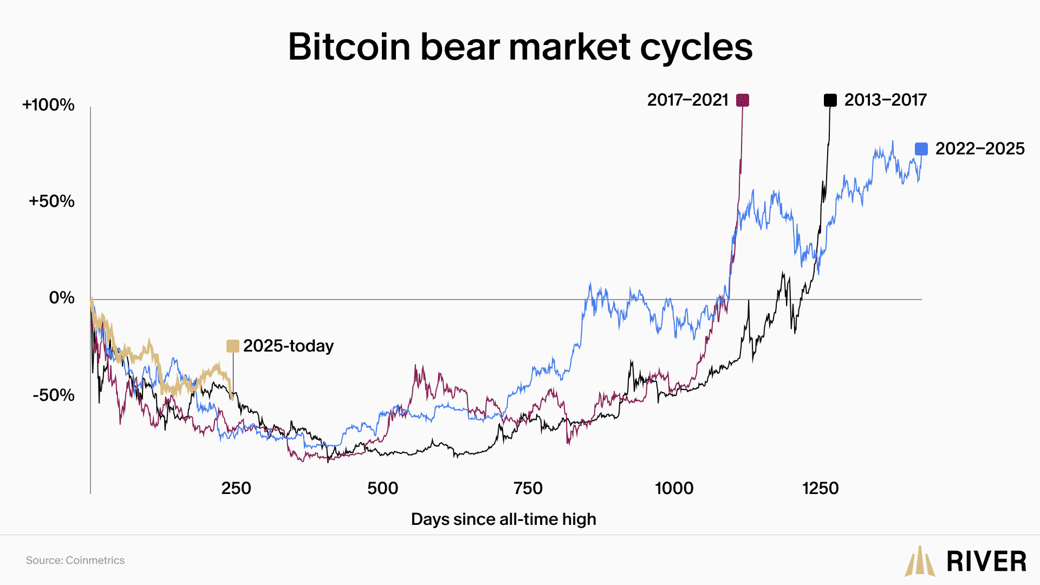


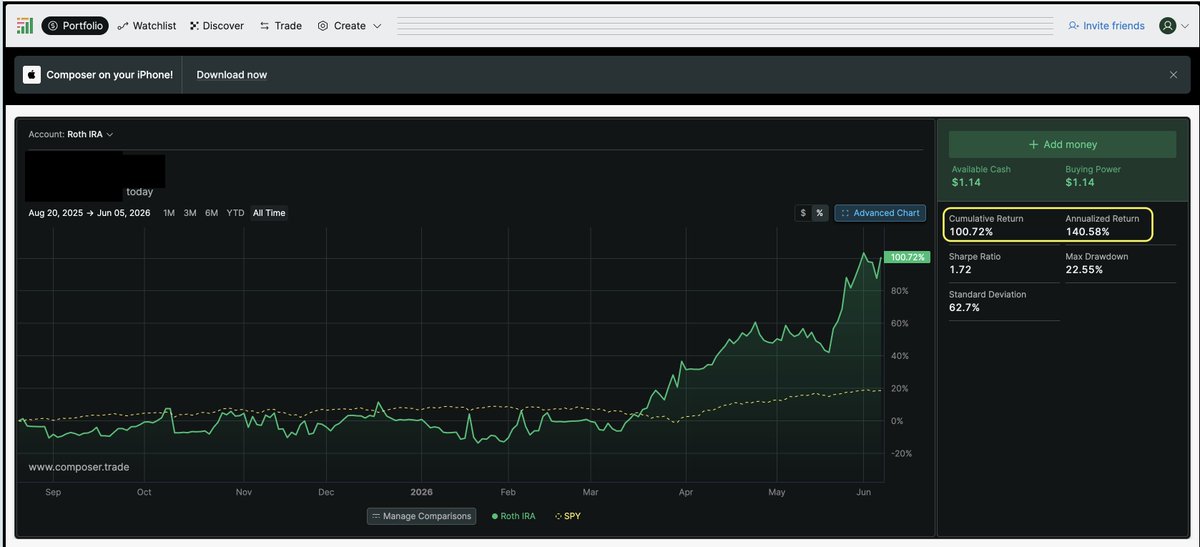


Volatility got you down? 📉
I moved one of my ROTH IRAs to @ComposerTrade in August of last year.
Fully automated strategy, I almost forgot about this account... and it's currently up 100%, at a 140% annualized clip.
Referral🔗 below for 25% off for life.
1
1
3
247
🗒️ Weekly Takeaways: International
■ Broad reversal: 32 of 34 markets green after a near-uniformly red prior week — a sweeping global risk-on bounce.
■ Massive flip: $EWY South Korea 12.71% rocketed from last week's worst (-14.89%) to this week's outright leader.
■ EM dominance: $EPU Peru 11.46%, $COLO Colombia 10.29% and $EIDO Indonesia 9.88% led, with $EEM Emerging Markets 5.09% far outpacing $EFA Developed Markets 2.70%.
■ Lone laggards: $DAX Germany -0.50% and $VNM Vietnam -1.00% red for the 2nd straight week, bucking the global rally.
■ America: not the biggest fan of seeing $SPX dead last in the green. Perhaps a signal for risk-on with the globe outperforming.
1
1
138
📊 WEEKLY INTERNATIONAL RETURNS:
■ $EWY South Korea: 12.71% 🟢
■ $EPU Peru: 11.46% 🟢
■ $COLO Colombia: 10.29% 🟢
■ $EIDO Indonesia: 9.88% 🟢
■ $ECH Chile: 7.46% 🟢
■ $ARGT Argentina: 6.90% 🟢
■ $GREK Greece: 6.09% 🟢
■ $EPOL Poland: 5.27% 🟢
■ $KSA Saudi Arabia: 5.18% 🟢
■ $EEM Emerging Markets: 5.09% 🟢
■ $EWT Taiwan: 4.63% 🟢
■ $EWI Italy: 4.53% 🟢
■ $EWW Mexico: 4.49% 🟢
■ $EWA Australia: 4.13% 🟢
■ $EZA South Africa: 3.88% 🟢
■ $TUR Turkey: 3.60% 🟢
■ $EWP Spain: 3.36% 🟢
■ $VEU Excl.-U.S. (large/mid cap): 3.28% 🟢
■ $EWZ Brazil: 3.20% 🟢
■ $VXUS Excl.-U.S. (large/mid/small cap): 3.19% 🟢
■ $EU50 Top 50 Eurozone (large cap): 2.84% 🟢
■ $EWQ France: 2.78% 🟢
■ $EFA Developed Markets: 2.70% 🟢
■ $EWJ Japan: 2.19% 🟢
■ $INDA India: 2.09% 🟢
■ $E3X Top 300 Pan-European (large cap): 1.79% 🟢
■ $SXXP Top 600 Pan-European (large/mid cap): 1.69% 🟢
■ $EWU United Kingdom: 1.68% 🟢
■ $FXI China 50 Index (large cap): 1.55% 🟢
■ $EWC Canada: 1.26% 🟢
■ $MCHI China Broad Index (large/mid cap): 0.72% 🟢
■ $SPX S&P500 Index: 0.65% 🟢
■ $DAX Germany: -0.50% 🔴
■ $VNM Vietnam: -1.00% 🔴
1
1
1
274
🗒️ Weekly Takeaways: S&P 500 Sectors
■ Energy reversal: $XLE Energy -0.21% was the sole sector outlier flipping red after leading the board last week at 2.45% — a top-to-bottom swing.
■ Tech snapback: $XLK Technology 2.50% rebounded sharply from last week's worst-sector -5.61%, fueling the risk-on tone.
■ Cyclicals led: $XLB Materials 3.06% topped the list, with $XLF Financials 1.99% green for the 2nd straight week.
■ Defensive surprise: $XLP Consumer Staples 2.85% ran 2nd despite the risk-on backdrop; $XLC Communication Services -0.02% essentially flat at the bottom.
1
1
188
📊 WEEKLY S&P500 SECTOR RETURNS:
■ $XLB Materials: 3.06% 🟢
■ $XLP Consumer Staples: 2.85% 🟢
■ $XLK Technology: 2.50% 🟢
■ $XLF Financials: 1.99% 🟢
■ $XLY Consumer Discretionary: 1.51% 🟢
■ $XLRE Real Estate: 1.48% 🟢
■ $XLI Industrials: 1.15% 🟢
■ $XLV Health Care: 0.52% 🟢
■ $XLU Utilities: 0.41% 🟢
■ $XLC Communication Services: -0.02% 🔴
■ $XLE Energy: -0.21% 🔴
2
4
437
🗒️ Weekly Takeaways: U.S. Indices
■ Full reversal: All 8 indices flipped green after all 8 closed red last week — a clean risk-on snapback.
■ Risk appetite roared back: $IWC Micro Caps 4.37% and $IWM Small Caps 4.01% led, reversing last week's bottom-of-the-pack losses (-5.11% and -3.02%).
■ Mega-cap tech rebounded: $QQQ Nasdaq 100 2.31% recovered most of last week's -4.50%, while broad $SPY S&P 500 0.57% and $DJI Dow 0.66% lagged the small/mid-cap surge.
■ Breadth leadership: equal-weight $QQQE 2.95% and $RSP 1.84% beating their cap-weighted peers signals broad participation, not just a few names.
1
2
142
𝗪𝗲𝗲𝗸𝗹𝘆 𝗕𝗿𝗲𝗮𝗱𝘁𝗵 𝗪𝗿𝗮𝗽-𝗨𝗽 📈 ✍️
◾ 𝟭𝟭 𝗼𝗳 𝟭𝟮 𝗿𝗲𝗮𝗱𝗶𝗻𝗴𝘀 𝗮𝗱𝘃𝗮𝗻𝗰𝗲𝗱 𝗪𝗼𝗪 — a green sweep and a sharp reversal after 4 straight down weeks. $NDX long-term/200sma was the lone exception at flat.
◾ $SPX 𝗶𝘀 𝘁𝗵𝗲 𝗹𝗲𝗮𝗱𝗲𝗿 𝗼𝗻 breadth 𝘁𝗮𝗽𝗲 — all 3 timeframes printed fresh multi-month closing highs, and short-term/20sma at 𝟳𝟭% is the 𝗵𝗶𝗴𝗵𝗲𝘀𝘁 𝗮𝗯𝘀𝗼𝗹𝘂𝘁𝗲 𝗿𝗲𝗮𝗱𝗶𝗻𝗴 𝗼𝗳 𝗮𝗹𝗹 𝟭𝟮 𝗺𝗲𝘁𝗿𝗶𝗰𝘀.
◾ Down-cap led the bounce — Russell 2000 $IWM and Mid Cap short-term breadth posted the 𝘁𝘄𝗼 𝗹𝗮𝗿𝗴𝗲𝘀𝘁 𝗪𝗼𝗪 𝗴𝗮𝗶𝗻𝘀 𝗮𝗰𝗿𝗼𝘀𝘀 𝗮𝗹𝗹 𝟭𝟮, a full reversal of last week's collapse. Meanwhile $NDX, last week's lone bright spot, now lags with the smallest gains and the only flat reading. 𝗟𝗲𝗮𝗱𝗲𝗿𝘀𝗵𝗶𝗽 𝗿𝗼𝘁𝗮𝘁𝗲𝗱.
◾ 𝗔𝗹𝗹 𝟭𝟮 𝗿𝗲𝗮𝗱𝗶𝗻𝗴𝘀 𝗻𝗼𝘄 𝗮𝗯𝗼𝘃𝗲 𝟱𝟬% — full structural participation. The snapback is broad, not narrow; watch whether short-term momentum holds into next week.

𝗪𝗲𝗲𝗸𝗹𝘆 𝗕𝗿𝗲𝗮𝗱𝘁𝗵 𝗪𝗿𝗮𝗽-𝗨𝗽 📈 ✍️
◾ 𝟴 𝗼𝗳 𝟭𝟮 𝗿𝗲𝗮𝗱𝗶𝗻𝗴𝘀 𝗱𝗲𝗰𝗹𝗶𝗻𝗲𝗱 𝗪𝗼𝗪 — but the split is the story: $SPX green across all 3 timeframes. A near-total reversal of last week's down-cap rotation. Long-term $NDX breadth joined as the only other metric to advance last week.
◾ $SPX 𝗶𝘀 𝘁𝗵𝗲 𝗹𝗼𝗻𝗲 𝗹𝗲𝗮𝗱𝗲𝗿 — the only index green on all 3 timeframes. Short-term breadth's 19% was the 𝗯𝗶𝗴𝗴𝗲𝘀𝘁 𝘄𝗲𝗲𝗸𝗹𝘆 𝗺𝗼𝘃𝗲 𝗮𝗰𝗿𝗼𝘀𝘀 𝗮𝗹𝗹 𝟭𝟮 𝗺𝗲𝘁𝗿𝗶𝗰𝘀 and, at ~60%, the highest absolute reading. Last week's biggest drop, this week's biggest gain.
◾ $IWM and $IJH gave back last week's gains — both red across all 3 timeframes. Mid-cap mid-term/50sma was the 𝗹𝗮𝗿𝗴𝗲𝘀𝘁 𝘀𝗶𝗻𝗴𝗹𝗲-𝘄𝗲𝗲𝗸 𝗱𝗿𝗼𝗽 𝗮𝗰𝗿𝗼𝘀𝘀 𝗮𝗹𝗹 𝟭𝟮 𝗺𝗲𝘁𝗿𝗶𝗰𝘀, small-cap short-term right behind. $NDX was mixed — short & mid down, long-term up.
◾ 𝗦𝘁𝗶𝗹𝗹 𝗮𝗯𝗼𝘃𝗲 𝟱𝟬%: $SPX all 3 timeframes, $NDX mid & long-term, Russell 2000 $IWM all 3 timeframes, and Mid Cap long-term.
◾ The structure holds — 𝗮𝗹𝗹 𝟰 𝗶𝗻𝗱𝗶𝗰𝗲𝘀 𝘀𝘁𝗶𝗹𝗹 ≥𝟱𝟬% 𝗼𝗻 𝟮𝟬𝟬𝘀𝗺𝗮. Large caps took back the wheel this week — the question now is whether tech, small & mid caps stabilize or this down-cap fade has legs.
2
156
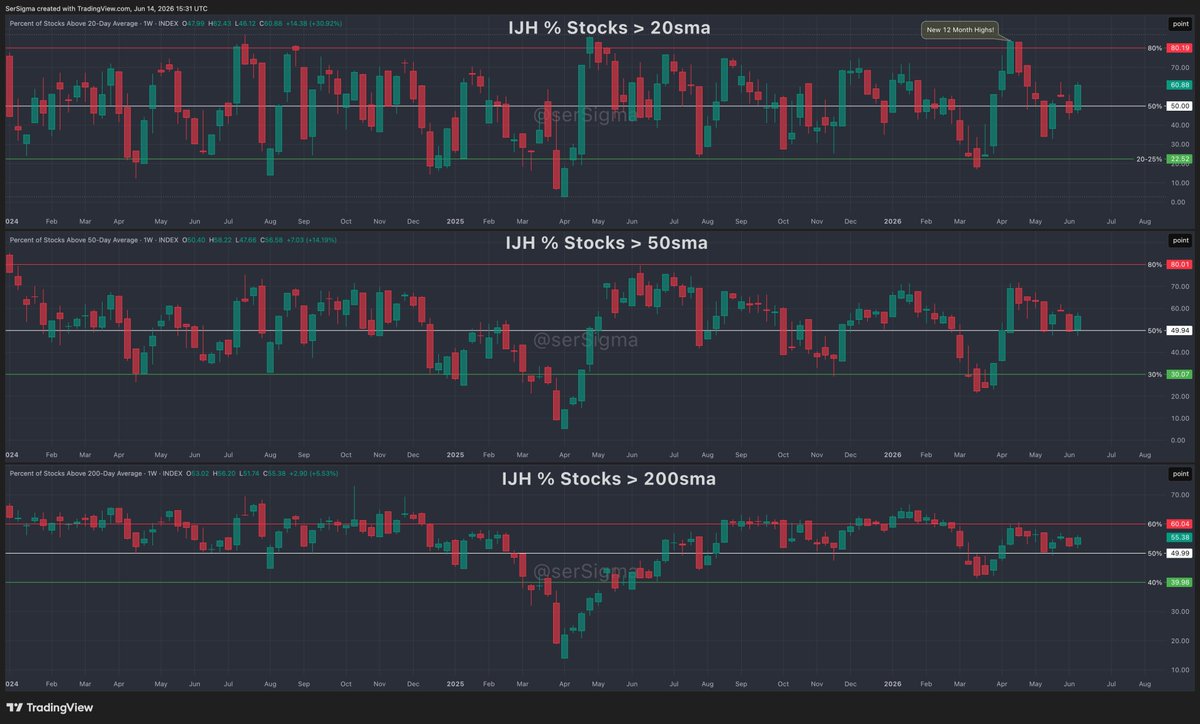
𝗪𝗲𝗲𝗸𝗹𝘆 𝗕𝗿𝗲𝗮𝗱𝘁𝗵 𝗗𝗲𝗹𝘁𝗮: $IJH Mid Caps
𝗧𝗟𝗗𝗥: Mid caps right behind small caps in the bounce. Short-term breadth surged 31% — the 𝟮𝗻𝗱-𝗹𝗮𝗿𝗴𝗲𝘀𝘁 𝗪𝗼𝗪 𝗴𝗮𝗶𝗻 𝗮𝗰𝗿𝗼𝘀𝘀 𝗮𝗹𝗹 𝟭𝟮 𝗺𝗲𝘁𝗿𝗶𝗰𝘀, snapping back after last week's reset. All 3 timeframes reclaimed/held 50%.
% 𝗼𝗳 𝘀𝘁𝗼𝗰𝗸𝘀 𝗮𝗯𝗼𝘃𝗲:
◾ 20sma 31% to 60.88% 🟢
◾ 50sma 14% to 56.58% 🟢
◾ 200sma 6% to 55.38% 🟢
𝗪𝗲𝗲𝗸𝗹𝘆 𝗕𝗿𝗲𝗮𝗱𝘁𝗵 𝗗𝗲𝗹𝘁𝗮: $IJH 𝗠𝗶𝗱 𝗖𝗮𝗽𝘀
𝗧𝗟𝗗𝗥: Took the hardest hit. Red across all 3 timeframes, with mid-term/50sma down -16% — the 𝗹𝗮𝗿𝗴𝗲𝘀𝘁 𝘀𝗶𝗻𝗴𝗹𝗲-𝘄𝗲𝗲𝗸 𝗱𝗿𝗼𝗽 𝗮𝗰𝗿𝗼𝘀𝘀 𝗮𝗹𝗹 𝟭𝟮 𝗺𝗲𝘁𝗿𝗶𝗰𝘀. Short & mid-term both back under 50%; only long-term/200sma holding over.
% 𝗼𝗳 𝘀𝘁𝗼𝗰𝗸𝘀 𝗮𝗯𝗼𝘃𝗲:
◾ 20sma -15% to 46.50% 🔴
◾ 50sma -16% to 49.55% 🔴
◾ 200sma -6% to 52.48% 🔴
2
132
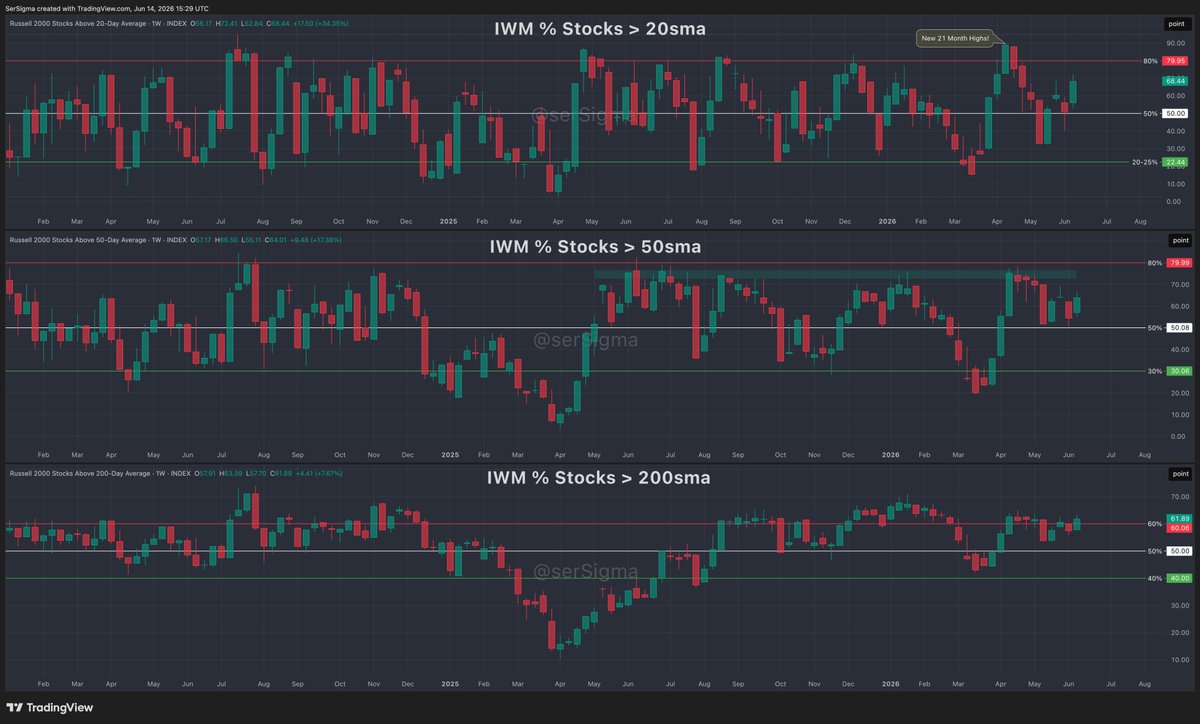
𝗪𝗲𝗲𝗸𝗹𝘆 𝗕𝗿𝗲𝗮𝗱𝘁𝗵 𝗗𝗲𝗹𝘁𝗮: $IWM Small Caps
𝗧𝗟𝗗𝗥: Short-term/20sma breadth ripped 34% — the 𝗹𝗮𝗿𝗴𝗲𝘀𝘁 𝘀𝗶𝗻𝗴𝗹𝗲-𝘄𝗲𝗲𝗸 𝗴𝗮𝗶𝗻 𝗮𝗰𝗿𝗼𝘀𝘀 𝗮𝗹𝗹 𝟭𝟮 𝗺𝗲𝘁𝗿𝗶𝗰𝘀 and a full reversal of last week's -44% collapse. All 3 timeframes back above 50%, with mid & long-term in the low 60s.
% 𝗼𝗳 𝘀𝘁𝗼𝗰𝗸𝘀 𝗮𝗯𝗼𝘃𝗲:
◾ 20sma 34% to 68.44% 🟢
◾ 50sma 17% to 64.01% 🟢
◾ 200sma 8% to 61.89% 🟢
𝗪𝗲𝗲𝗸𝗹𝘆 𝗕𝗿𝗲𝗮𝗱𝘁𝗵 𝗗𝗲𝗹𝘁𝗮: $IWM 𝗦𝗺𝗮𝗹𝗹 𝗖𝗮𝗽𝘀
𝗧𝗟𝗗𝗥: Gave it all back. Small caps led the breadth gains last week — this week all 3 timeframes flipped red, short-term down -16%. Softer hit than the mids though, and all 3 readings are 𝘀𝘁𝗶𝗹𝗹 𝗵𝗼𝗹𝗱𝗶𝗻𝗴 𝗼𝘃𝗲𝗿 𝟱𝟬%.
% 𝗼𝗳 𝘀𝘁𝗼𝗰𝗸𝘀 𝗮𝗯𝗼𝘃𝗲:
◾ 20sma -16% to 50.94% 🔴
◾ 50sma -15% to 54.53% 🔴
◾ 200sma -5% to 57.48% 🔴
3
224
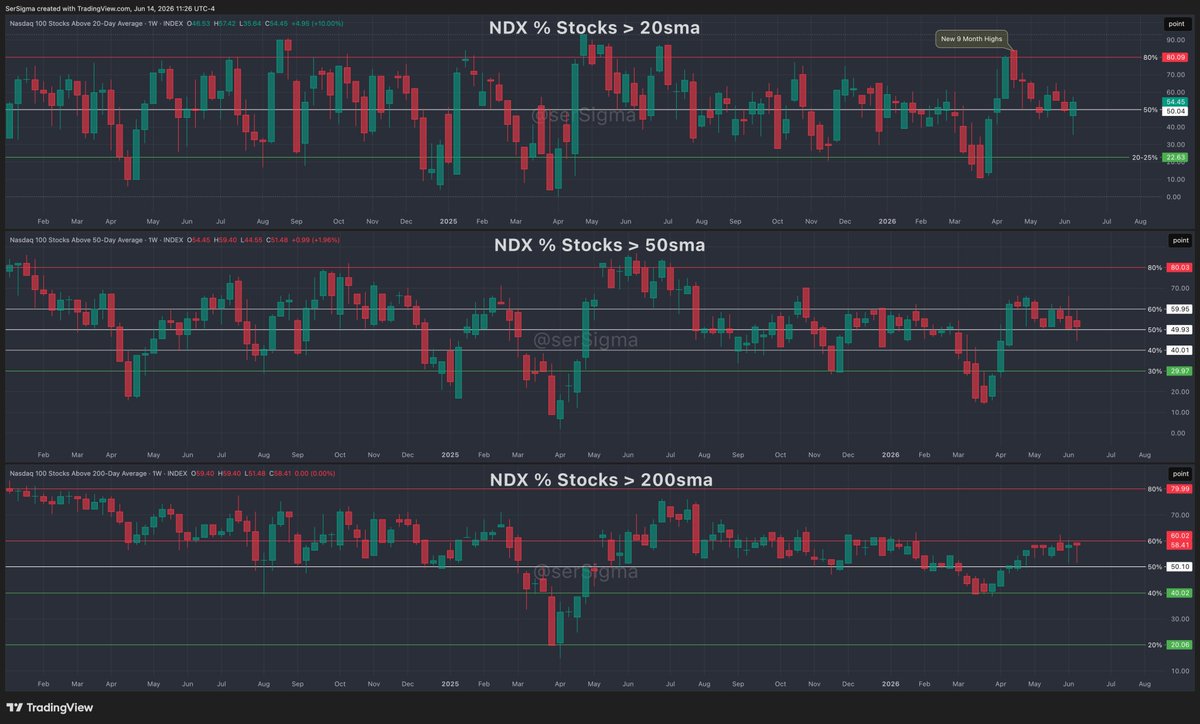
𝗪𝗲𝗲𝗸𝗹𝘆 𝗕𝗿𝗲𝗮𝗱𝘁𝗵 𝗗𝗲𝗹𝘁𝗮: $NDX Nasdaq100
𝗧𝗟𝗗𝗥: The laggard this week. Long-term/200sma was the 𝗼𝗻𝗹𝘆 𝗳𝗹𝗮𝘁 𝗿𝗲𝗮𝗱𝗶𝗻𝗴 𝗮𝗰𝗿𝗼𝘀𝘀 𝗮𝗹𝗹 𝟭𝟮 𝗺𝗲𝘁𝗿𝗶𝗰𝘀, and short-term posted the smallest gain of any index. After being last week's lone bright spot, tech is now riding in the back of the snapback.
% 𝗼𝗳 𝘀𝘁𝗼𝗰𝗸𝘀 𝗮𝗯𝗼𝘃𝗲:
◾ 20sma 10% to 54.45% 🟢
◾ 50sma 2% to 51.48% 🟢
◾ 200sma 0% to 58.41% 🟡 (The only one out of 12 to not advance last week)
𝗪𝗲𝗲𝗸𝗹𝘆 𝗕𝗿𝗲𝗮𝗱𝘁𝗵 𝗗𝗲𝗹𝘁𝗮: $NDX Nasdaq100
𝗧𝗟𝗗𝗥: Mixed bag. Short & mid-term breadth pulled back while long-term/200sma pushed higher to 58.41 — the 𝗵𝗶𝗴𝗵𝗲𝘀𝘁 𝟮𝟬𝟬𝘀𝗺𝗮 𝗿𝗲𝗮𝗱𝗶𝗻𝗴 𝗼𝗳 𝗮𝗹𝗹 𝟰 𝗶𝗻𝗱𝗶𝗰𝗲𝘀. Short-term/20sma slipped back under 50% marginally.
% 𝗼𝗳 𝘀𝘁𝗼𝗰𝗸𝘀 𝗮𝗯𝗼𝘃𝗲:
◾ 20sma -11% to 49.50% 🔴
◾ 50sma -9% to 50.49% 🔴
◾ 200sma 4% to 58.41% 🟢
1
447
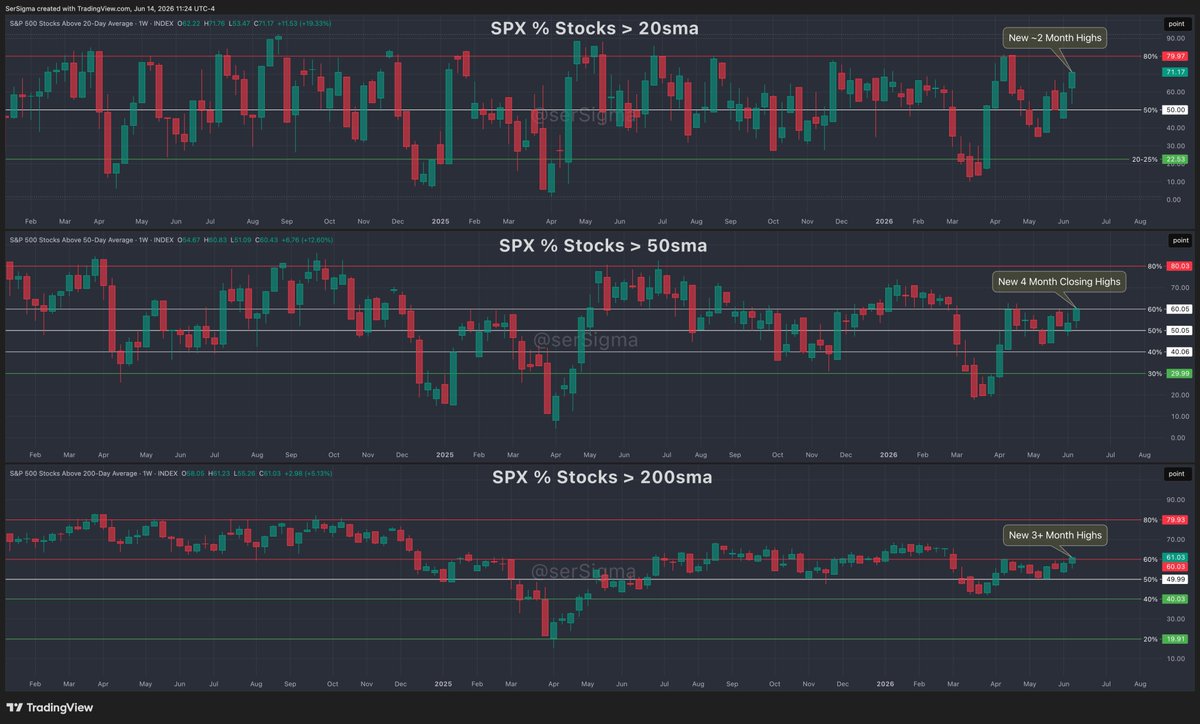
𝗪𝗲𝗲𝗸𝗹𝘆 𝗕𝗿𝗲𝗮𝗱𝘁𝗵 𝗗𝗲𝗹𝘁𝗮: $SPX S&P500
𝗧𝗟𝗗𝗥: A green sweep. All 3 timeframes printed 𝗳𝗿𝗲𝘀𝗵 𝗺𝘂𝗹𝘁𝗶-𝗺𝗼𝗻𝘁𝗵 𝗰𝗹𝗼𝘀𝗶𝗻𝗴 𝗵𝗶𝗴𝗵𝘀 this week — short-term ~2mo, mid-term 4mo, long-term 3 mo — confirming together. At 71%, short-term/20sma SPX breadth is the 𝗵𝗶𝗴𝗵𝗲𝘀𝘁 𝗮𝗯𝘀𝗼𝗹𝘂𝘁𝗲 𝗿𝗲𝗮𝗱𝗶𝗻𝗴 𝗼𝗳 𝗮𝗹𝗹 𝟭𝟮 𝗺𝗲𝘁𝗿𝗶𝗰𝘀.
% 𝗼𝗳 𝘀𝘁𝗼𝗰𝗸𝘀 𝗮𝗯𝗼𝘃𝗲:
◾ 20sma 19% to 71.17% 🟢
◾ 50sma 13% to 60.43% 🟢
◾ 200sma 5% to 61.03% 🟢
𝗪𝗲𝗲𝗸𝗹𝘆 𝗕𝗿𝗲𝗮𝗱𝘁𝗵 𝗗𝗲𝗹𝘁𝗮: $SPX S&P500
𝗧𝗟𝗗𝗥: Large caps flipped the script. The only index green on all 3 timeframes — short-term breadth's 19% was the 𝗯𝗶𝗴𝗴𝗲𝘀𝘁 𝘄𝗲𝗲𝗸𝗹𝘆 𝗺𝗼𝘃𝗲 𝗮𝗰𝗿𝗼𝘀𝘀 𝗮𝗹𝗹 𝟭𝟮 𝗺𝗲𝘁𝗿𝗶𝗰𝘀 and the highest absolute reading, snapping right back after last week's deterioration.
% 𝗼𝗳 𝘀𝘁𝗼𝗰𝗸𝘀 𝗮𝗯𝗼𝘃𝗲:
◾ 20sma 19% to 59.64% 🟢
◾ 50sma 3% to 53.67% 🟢
◾ 200sma 5% to 58.05% 🟢
1
225
𝗪𝗲𝗲𝗸𝗹𝘆 𝗕𝗿𝗲𝗮𝗱𝘁𝗵 𝗪𝗿𝗮𝗽-𝗨𝗽 📈 ✍️
◾ 𝟴 𝗼𝗳 𝟭𝟮 𝗿𝗲𝗮𝗱𝗶𝗻𝗴𝘀 𝗱𝗲𝗰𝗹𝗶𝗻𝗲𝗱 𝗪𝗼𝗪 — but the split is the story: $SPX green across all 3 timeframes. A near-total reversal of last week's down-cap rotation. Long-term $NDX breadth joined as the only other metric to advance last week.
◾ $SPX 𝗶𝘀 𝘁𝗵𝗲 𝗹𝗼𝗻𝗲 𝗹𝗲𝗮𝗱𝗲𝗿 — the only index green on all 3 timeframes. Short-term breadth's 19% was the 𝗯𝗶𝗴𝗴𝗲𝘀𝘁 𝘄𝗲𝗲𝗸𝗹𝘆 𝗺𝗼𝘃𝗲 𝗮𝗰𝗿𝗼𝘀𝘀 𝗮𝗹𝗹 𝟭𝟮 𝗺𝗲𝘁𝗿𝗶𝗰𝘀 and, at ~60%, the highest absolute reading. Last week's biggest drop, this week's biggest gain.
◾ $IWM and $IJH gave back last week's gains — both red across all 3 timeframes. Mid-cap mid-term/50sma was the 𝗹𝗮𝗿𝗴𝗲𝘀𝘁 𝘀𝗶𝗻𝗴𝗹𝗲-𝘄𝗲𝗲𝗸 𝗱𝗿𝗼𝗽 𝗮𝗰𝗿𝗼𝘀𝘀 𝗮𝗹𝗹 𝟭𝟮 𝗺𝗲𝘁𝗿𝗶𝗰𝘀, small-cap short-term right behind. $NDX was mixed — short & mid down, long-term up.
◾ 𝗦𝘁𝗶𝗹𝗹 𝗮𝗯𝗼𝘃𝗲 𝟱𝟬%: $SPX all 3 timeframes, $NDX mid & long-term, Russell 2000 $IWM all 3 timeframes, and Mid Cap long-term.
◾ The structure holds — 𝗮𝗹𝗹 𝟰 𝗶𝗻𝗱𝗶𝗰𝗲𝘀 𝘀𝘁𝗶𝗹𝗹 ≥𝟱𝟬% 𝗼𝗻 𝟮𝟬𝟬𝘀𝗺𝗮. Large caps took back the wheel this week — the question now is whether tech, small & mid caps stabilize or this down-cap fade has legs.
𝗪𝗲𝗲𝗸𝗹𝘆 𝗕𝗿𝗲𝗮𝗱𝘁𝗵 𝗪𝗿𝗮𝗽-𝗨𝗽 📈 ✍️
◾ 𝗔 𝗰𝗹𝗲𝗮𝗻 𝟲-𝗮𝗻𝗱-𝟲 𝘀𝗽𝗹𝗶𝘁: 𝗮𝗹𝗹 𝟲 𝗹𝗮𝗿𝗴𝗲-𝗰𝗮𝗽 𝗿𝗲𝗮𝗱𝗶𝗻𝗴𝘀 ($SPX $NDX) 𝗱𝗲𝗰𝗹𝗶𝗻𝗲𝗱, while 𝗮𝗹𝗹 𝟲 𝘀𝗺𝗮𝗹𝗹/𝗺𝗶𝗱-𝗰𝗮𝗽 𝗿𝗲𝗮𝗱𝗶𝗻𝗴𝘀 ($IWM $IJH) 𝗶𝗺𝗽𝗿𝗼𝘃𝗲𝗱. A textbook down-cap rotation week — from a breadth perspective, money rotated out of mega caps and into small & mids.
◾ 𝗦𝗺𝗮𝗹𝗹 𝗰𝗮𝗽𝘀 $IWM 𝗮𝗿𝗲 𝘁𝗵𝗲 𝗹𝗲𝗮𝗱𝗲𝗿 — green across every timeframe, and mid-term at 𝟲𝟰% is the 𝗵𝗶𝗴𝗵𝗲𝘀𝘁 𝗮𝗯𝘀𝗼𝗹𝘂𝘁𝗲 𝗿𝗲𝗮𝗱𝗶𝗻𝗴 𝗼𝗳 𝗮𝗹𝗹 𝟭𝟮 𝗺𝗲𝘁𝗿𝗶𝗰𝘀.
◾ Mid caps $IJH backed it up — fully green across all 3, short-term/20sma the 2nd-largest gainer. On the flip side, $SPX short-term/20sma posted the 𝗹𝗮𝗿𝗴𝗲𝘀𝘁 𝗪𝗼𝗪 𝗱𝗿𝗼𝗽 𝗼𝗳 𝗮𝗹𝗹 𝟭𝟮, sliding to just 50.09 — barely above the 50% mark and the lowest reading of all 12.
◾ 𝗔𝗹𝗹 𝟭𝟮 𝗿𝗲𝗮𝗱𝗶𝗻𝗴𝘀 𝗮𝗿𝗲 𝗮𝗯𝗼𝘃𝗲 𝟱𝟬%. The structural picture stays intact across every index and timeframe — but breadth leadership rotated down-cap this week.
3
1
3
576