
145 Photos and videos


You don't know how to use Signiq to analyze activities related to the Web 3 project that interests you before investing?
Do this:
1- Go to signiq.xyz/x
2- Enter the username X of the project you want to search.
3- Please wait a little while for the results that signiq will present to you
4- You have the results now.
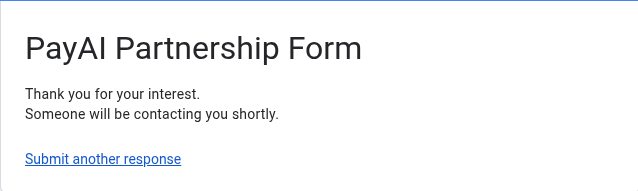
Here's an example of a project currently trending on Solana: @PayAiNetwork
For GitHub analysis, contract address, and other information, please visit: signiq.xyz/dashboard
Note that access to this feature is free until November 15th. Premium versions will be added soon with $SGQ as the payment method.
#Solana #x402 #PayAI #CyreneAI #SGQ #Github #Devs #Momentum #Nexus #Crypto
42
11
68
8,576
Signiq Market is now a Research Terminal.
We just deployed our biggest overhaul yet. The goal wasn't just to show price—it was to show opportunity. We’ve upgraded the dashboard from a passive tracker to an active intelligence layer for the ecosystem.
Here is what’s new in the build:
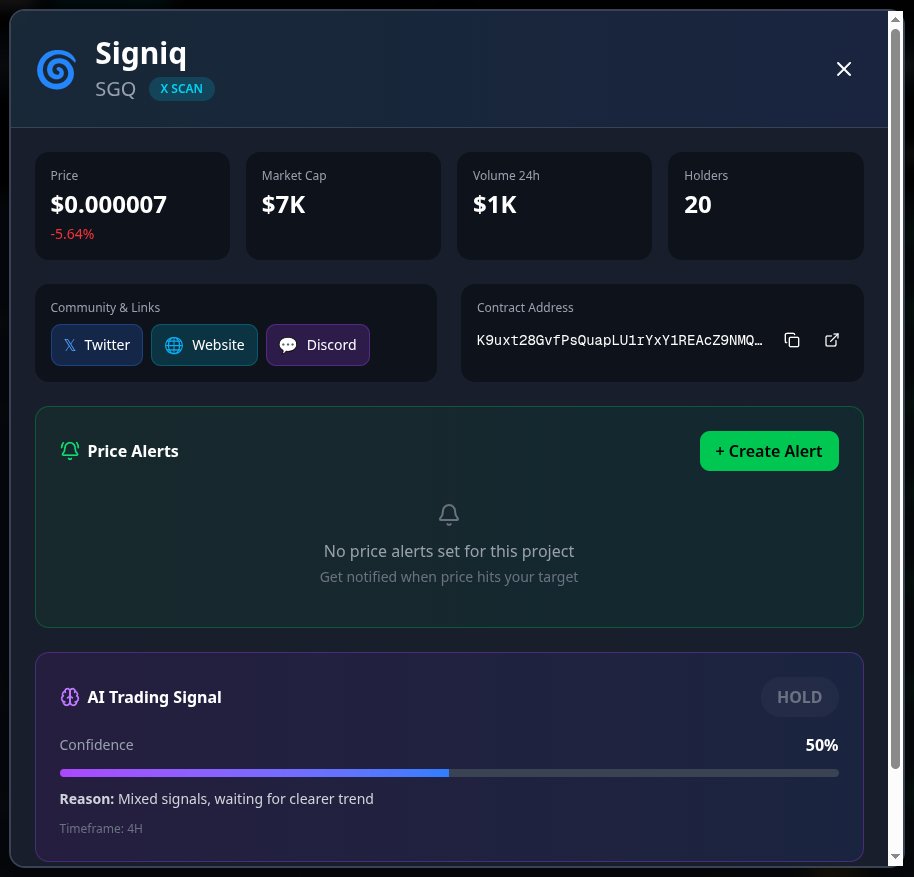
- Universal Search & Filtering: Stop scrolling. Instantly find tokens by Ticker, Name, or CA. Filter the entire ecosystem by sector (DeFi, AI, etc) to see where the liquidity is rotating in real-time.
- Institutional-Grade Data: We aren't just showing candles. The new Token Details modal provides: • Vol/MC Ratios: Spot high-velocity plays instantly. • Momentum Scoring (0-100): Algorithmic trend strength analysis. • Auto-Support/Resistance: Key technical levels calculated live.
- Automated Security Audits: Safety is a metric, not a guess. Every project now displays a Risk Level based on on-chain data: • Liquidity Lock Status 🔒 • Mint Authority Checks 🚫 • Holder Distribution Analysis 👥
- Precision Alert System: Never miss a breakout. Set custom Price Targets (Above/Below) and store notifications when levels are breached.
The data is cleaner, the UI is faster, and the insights are deeper.
Live now. Explore the new Signiq Market : signiq.xyz/marketplace
#Signiq #Solana #DeFi #Web3 #BuildInPublic
9
7
26
1,167

CYAI : INTERNET CAPITAL MARKET ON SOLANA
$CYAI $10 million this month, that’s what the signals show us. More enthusiasm and the community is at its full. Tomorrow U1 will close $10 million a pride for @CyreneAI.
$SGQ prepares us the super Market cap for tokens verified on #CYAI, it will be one more advance. And all this for the community.
Let’s Build on @solana
#Solana #Umbra #U1 #Signiq #SGQ #CyreneAI #Aidp #Script

5
13
28
2,987
GM Momentum Nexus!
Another update on Signiq Marketplace! Things are going good!
- Adding more projects on CyreneAI Ecosystem
- Works on a proper system design that shall be the foundational milestone for Signiq Marketplace
- Some more Momentum signals of a project, be it recent posts or mentions
Coming very soon this December! Stay tuned!
4
4
15
1,038
GM Momentum Nexus!
Work on Signiq Marketplace has been at good pace. This week we have added:
Precision Price Alerts:
Never miss a pump again. We’ve added a robust Alert System. Set custom targets (e.g., "Alert me if $CYAI breaks $0.05"), track active/triggered alerts, and manage your watchlist like a pro. Save the alerts as CSV to keep a check of targets.
Technical Analysis Terminal:
We brought the charts to you. The new "Token Details" view includes:
- Live Momentum Scores (Is it trending?)
- Auto-calculated Support & Resistance levels
- RSI & Trend indicators
- Suggested Entry & Stop-Loss zones
Full Ecosystem Integration:
We are now tracking the complete roster of 12 ecosystem projects (including $CYAI, $SGQ, $SENT, $MICK, and more). All social links (X, Website, Telegram) and contract addresses are one click away.
A lot more coming up, and more refining is yet to be made!
This is more than a dashboard; it’s your new research edge.
5
2
10
788
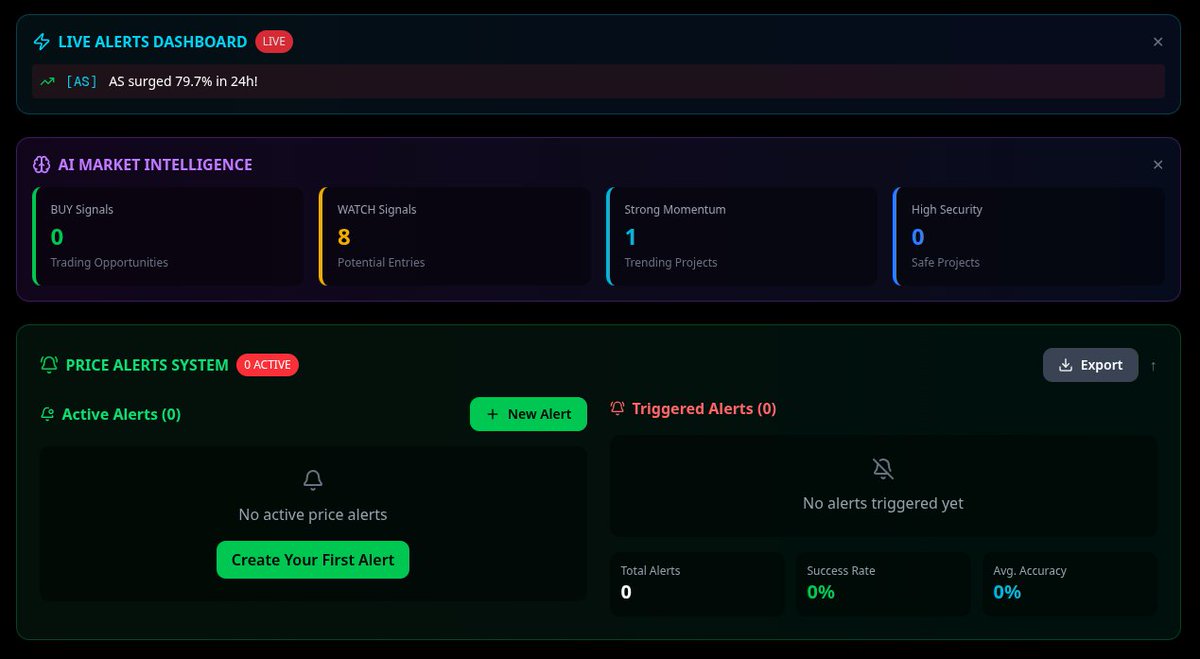
GM Momentum Nexus! Wanted to share some exciting updates on the Signiq Market dashboard we've been building out. We're really trying to make this the "Intelligence Layer" for the CyreneAI ecosystem that actually helps traders make better decisions.
The latest update introduces a comprehensive price alerts system that lets you set custom notifications for any project, with browser notifications that trigger when targets are hit. We've also integrated social links for direct community access, enhanced search to include contract addresses, and added export functionality for your watchlists and alerts.
The system now provides real-time monitoring with visual progress indicators and tracks your alert success rates over time. Everything persists between sessions, and we've improved the comparison tools for side-by-side project analysis. These features are designed to give traders actionable intelligence they can use daily.
A lot of features are being ideated, with Signiq Marketplace being a small idea now spanning across 12 different projects on CyreneAI ecosystem, things will be complex to maintain but very interesting in the long run. We affirm to keep building and make it as useful as possible for our community. The feature is yet to be shipped onto our main project, but we plan to accomplish it this month!
Thanks to every member to patiently wait for every update from our side. Keep Building!
7
10
21
1,859
GM Momentum Nexus! Dev from Signiq here!
SIGNIQ MARKETPLACE - MAJOR UPDATE | Building the Future of DeFi Intelligence
The work on the update has been on a good pace, with the following features active:
Real Data Integration (100% Live):
- Live Price Data: We're pulling real-time prices from DexScreener API and Jupiter aggregator - no mock data here! Every price you see is exactly what's trading on-chain right now.
- On-Chain Metrics: Holder counts and token supply data come directly from Solana RPC nodes, giving you authentic blockchain data.
- Liquidity & Volume: 24-hour trading volumes and liquidity pools are fetched live from DexScreener, updating every 30 seconds.
Currently we are tracking 12 projects, namely: CyreneAI( $CYAI ), CromaFun ( $CT ), Aytes ( $AS ), Aidp ( $AIDP ), Mikayla ( $MICK ), Swarm ( $SWARM ), Pranachain ( $PRN ), Scriptonia ( $SCRIPT ), Medusa Shards ( $MDS ), Crossfund ( $CF ), Sentinel AI ( $SENT ) and finally $SGQ itself.
We are working on improving the UX for a trader to have the seamless visit on a project's socials without the need to hunt for them, alongside a simple social momentum score.
Contract address search and custom price alerts are also something we are working upon.
Within December, we are planning to deploy the feature onto our platform for our users.
Another feature that is in work is the smart onchain dashboard, with better analytics and behavioral analysis.
Apologies to the community for being inactive, a lot of personal havocs had made our pace slow but not anymore. With December, we plan to get back and we will! More to come! Let's go!
3
5
13
638


We’re excited to announce our partnership with @crossfundxyz!
Our token $SGQ is now integrated into CrossFund’s Global Swap, allowing users to swap from more than 300 chains and over 1 million tokens directly into SGQ with a single click.
This collaboration expands SGQ’s accessibility, strengthens liquidity, and enhances our multichain presence for the entire Signiq community.
10
6
23
1,978
GM Momentum Nexus! For last few days I was looking at the onchain dashboard, it looked basic and I wanted to make it more vibrant. After some thought, I came to some ideas which might make it much better.
I went straight to the code and built a new dashboard with mock data to see what it would look like.
Now, it would start with a fluid, interactive bubble holder map where each bubble represents a wallet, scaled by holding percentage and color-coded by type—whales, large holders, mid-tier, and small players—complete with hover interactions, center-connected distribution lines, and smooth transitions. From there, I built a full Holder Behavior Analysis module that goes far beyond static numbers: it profiles the top holders, tracks their entry price, holding duration, unrealized P/L, activity patterns, and even classifies behavior into tags like Accumulating, Long-term Holder, Swing Trader, or High-Risk Churner, automatically surfacing alerts for suspicious movements.
I integrated a Trading Activity Heatmap that visualizes 24/7 buy/sell intensity across the week, revealing peak liquidity windows and volatility pockets. All of this ties into a clean Overview tab that pulls everything together, distribution, concentration risk, sentiment indicators, holder-growth curves, and concise AI-driven insights. On top of that, I created a trading recommendation engine that synthesizes all signals into a score out of 100 with risk tiers and entry/exit suggestions.
It's an ambitious idea, and could possibly more advanced than X analytics, but with Signiq Marketplace, it would be something big! Really excited to see how this will end up taking a shape into something real and what impact it will have on $SGQ itself.
Only the beginning. We must keep pushing forward 🧑💻💪🔥

11
6
23
1,317