
Pro-Rome Anti-Carthage
Joined August 2023
- Tweets 6,262
- Following 275
- Followers 613
- Likes 2,230
1,899 Photos and videos


Pinned Tweet

20 Mar 2024
The yield curve is unpredictable
But the very long term moving average of the yield curve is nearly a perfect deterministic mathematical function
Its first derivative is screaming "time for un-inversion"
You might want to start paying attention
6
2
40
29,428
There's a market commentary in this picture somewhere but I can't pin it down
1
2
3
256
SmedleyButlerUSMC retweeted

Jun 13
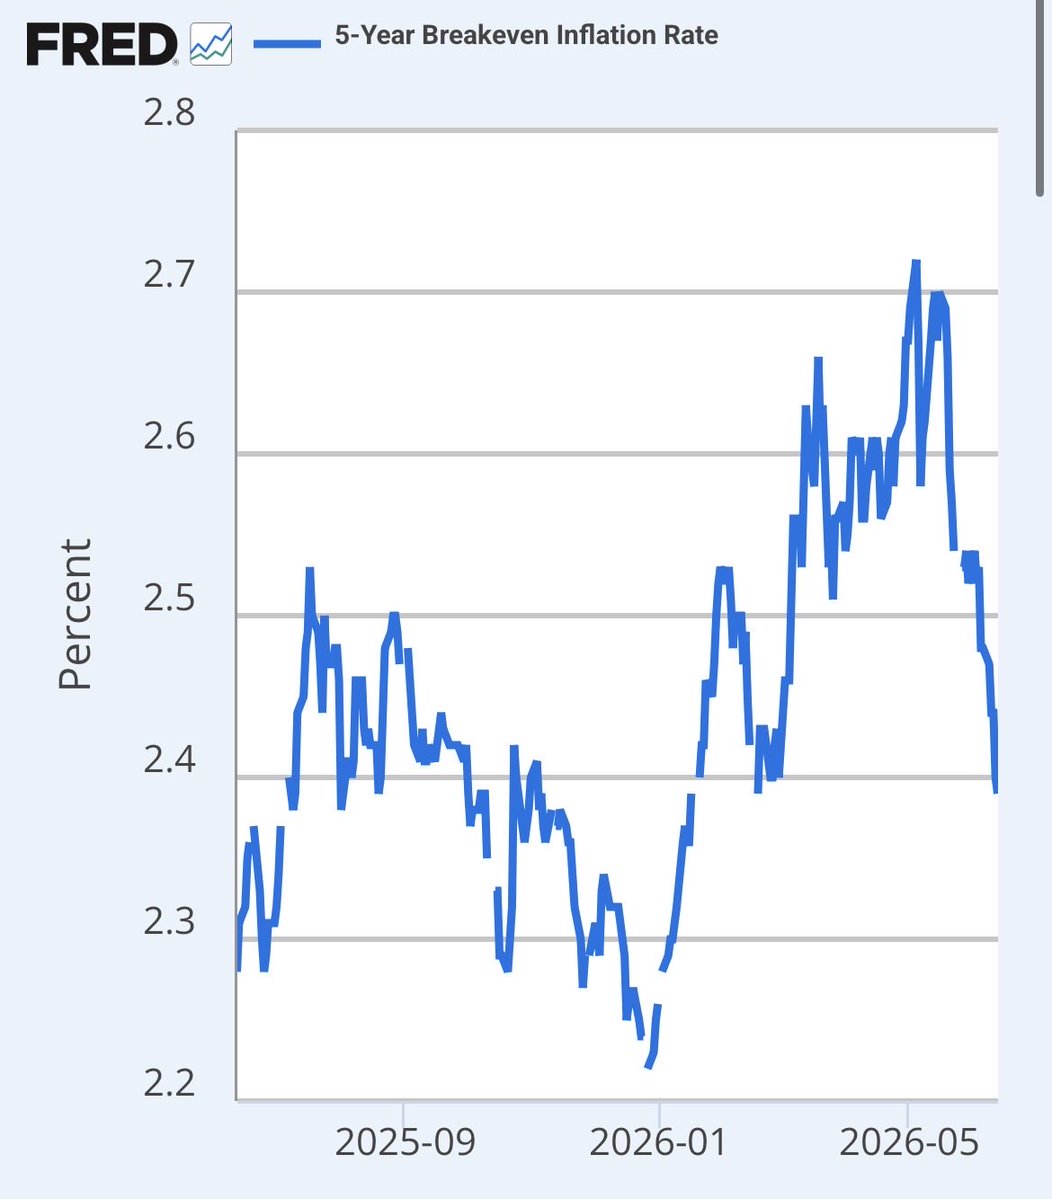
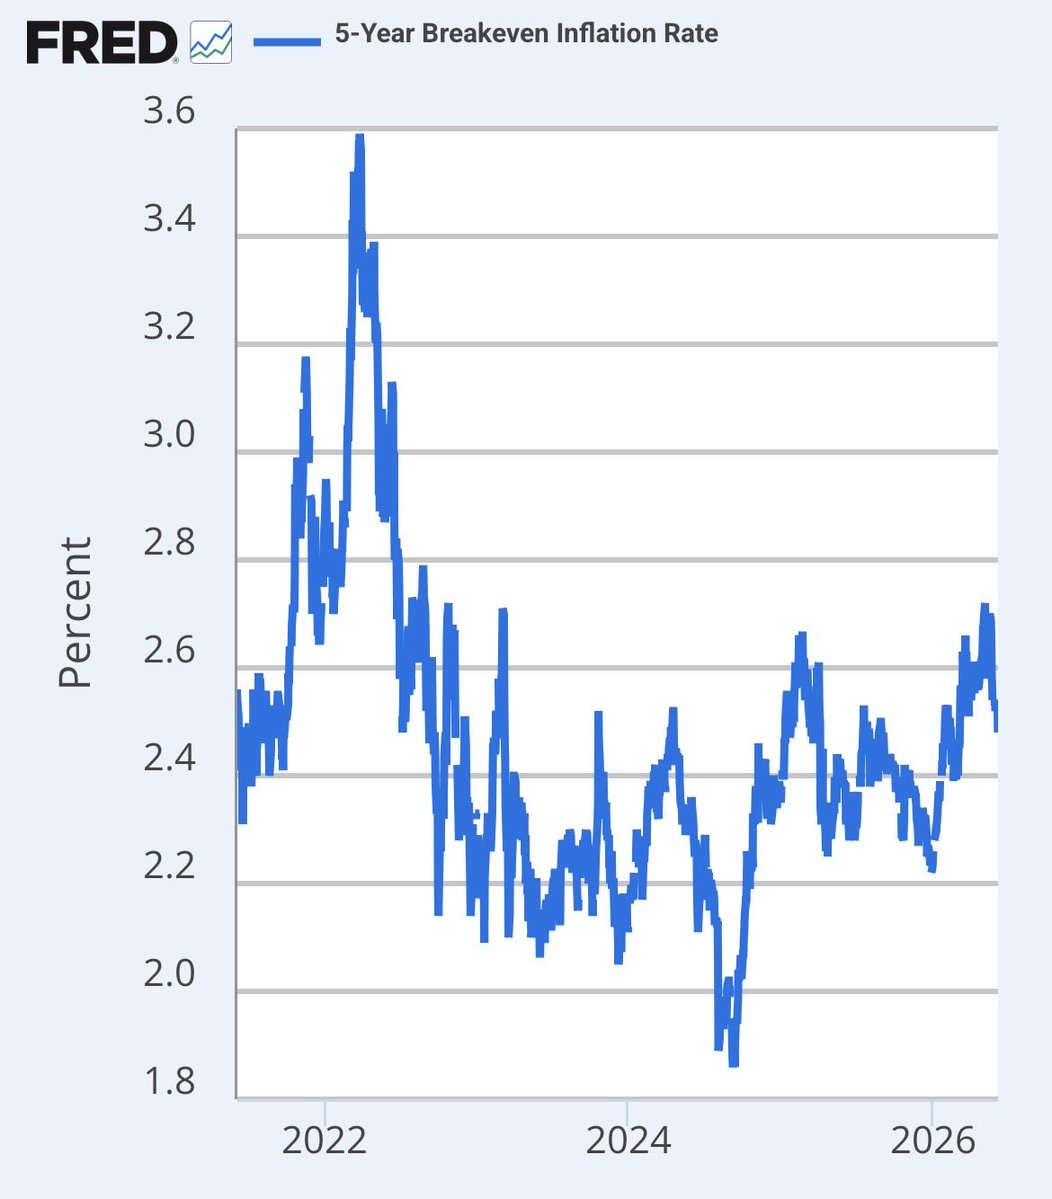
The 5 year breakeven is now down to 2.39%, meaning it has completely erased its rise since the war started. The yield curve is fully normalized and long yields are not breaking out. The 30Y is under 5% so with a Fed funds rate of 3.5%, the entire yield curve has less than a 1.50% spread from the 30Y to the overnight rate.
I still firmly believe that the Fed will not hike. They will remain paused until things break and then they can finish cutting. Despite Fed futures and Polymarket saying that one hike is more likely than not by end of year, the bond market says the Fed is perfectly fine to leave rates unchanged. The Fed doesn’t listen to Fed futures or Polymarket, it listens to the bond market. So unless yields break much higher, it’s very likely there will be no hike.
#Rates #Yields #Inflation
Jun 5

The 5 year inflation breakeven is at 2.48%, which is down 24 basis points from its 2.72% peak in May. It is also lower than the peak in February of 2025. This is not what you would see if we were returning to the out of control inflation levels from 2022. Everyone saying that the war and oil are going to cause runaway inflation should know that the bond market is strongly disagreeing with them.
#inflation #recession #TLT
5
2
14
1,376
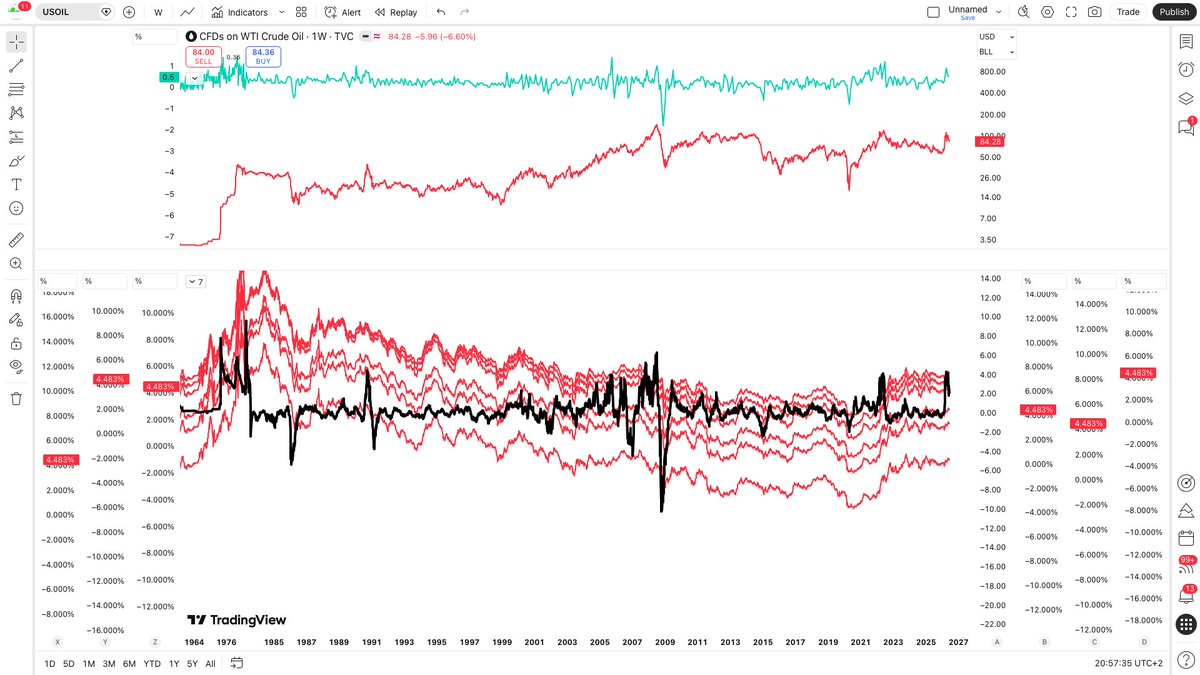
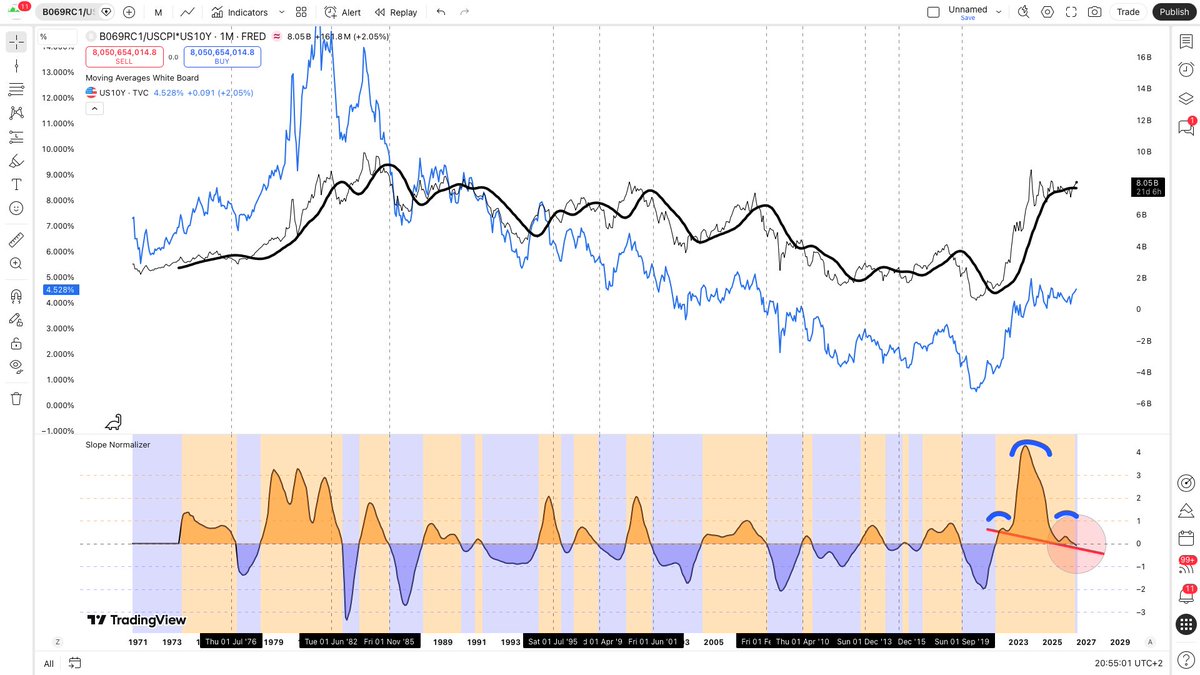
Black line = USOIL SMA normalized slope
There's an inconsistent but intermittently strong relationship between the rate of change of the USD price of WTI and US rates (as can be seen in the red ribbon = US10Y)
It's notable that the recent spike in oil had a weak response
1
5
298
What does it mean that your account is practically shut down and then swarmed with spam and p**n accounts within minutes of posting this?
1
2
140
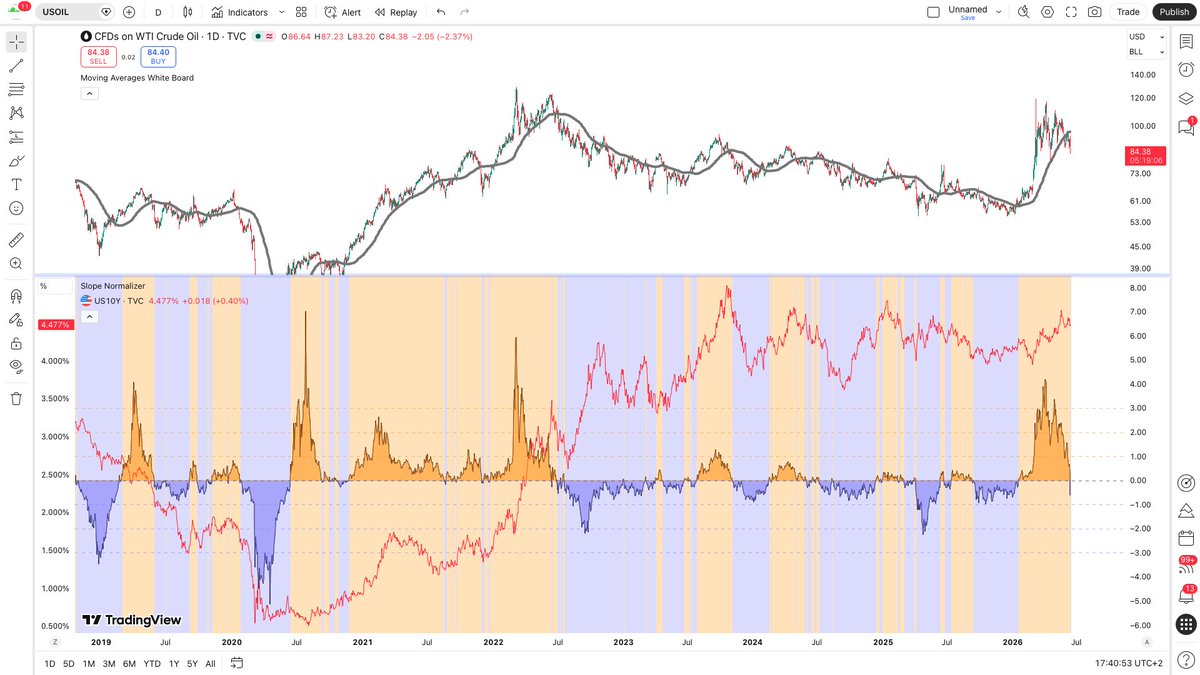
Oil went to $83 this morning, medium term normalized slope rolling over off a cliff
1
3
12
658
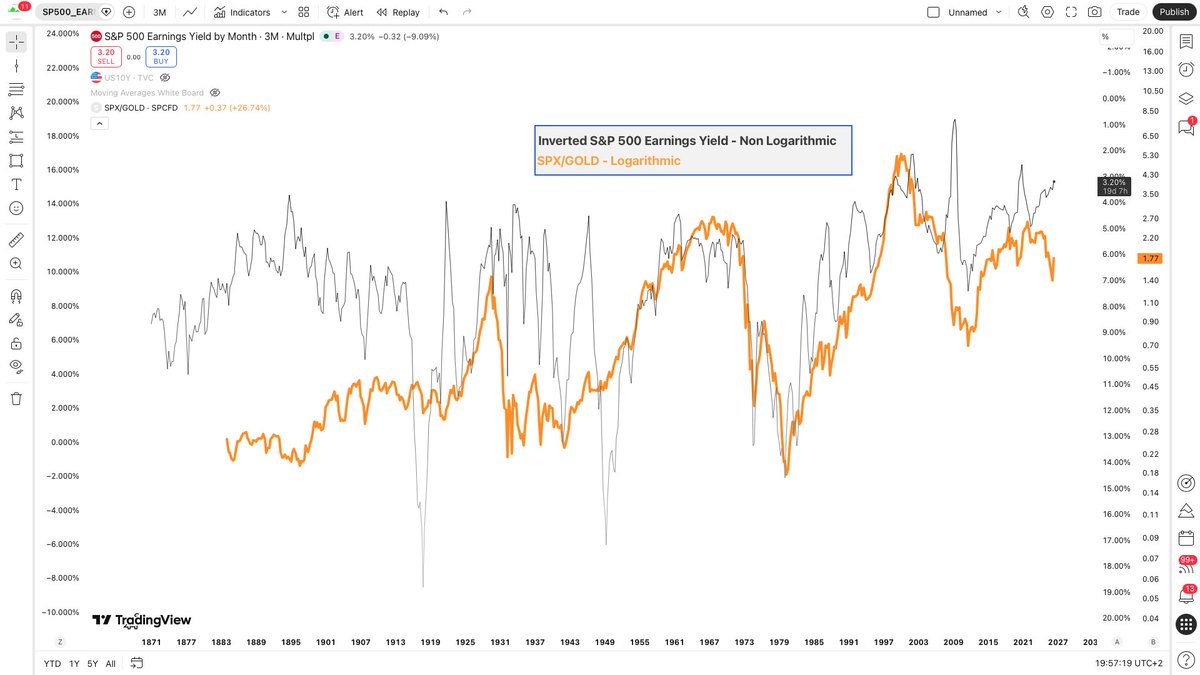
Earnings Yield versus Gold deflated S&P 500 versus Rates
1
7
425
SPX/GOLD tracks inverted Earnings Yield (P/E)
Or at least, it has since Bretton Woods (this is a 150 year chart)
This makes the economists, or at least the valuation theorists, look correctish. A very dark day indeed.
1
4
313
After a century of data, economists may have identified one thing that correlates with asset prices
Which is unfortunate, because it suggests economists may have accidentally discovered something true
1
3
149
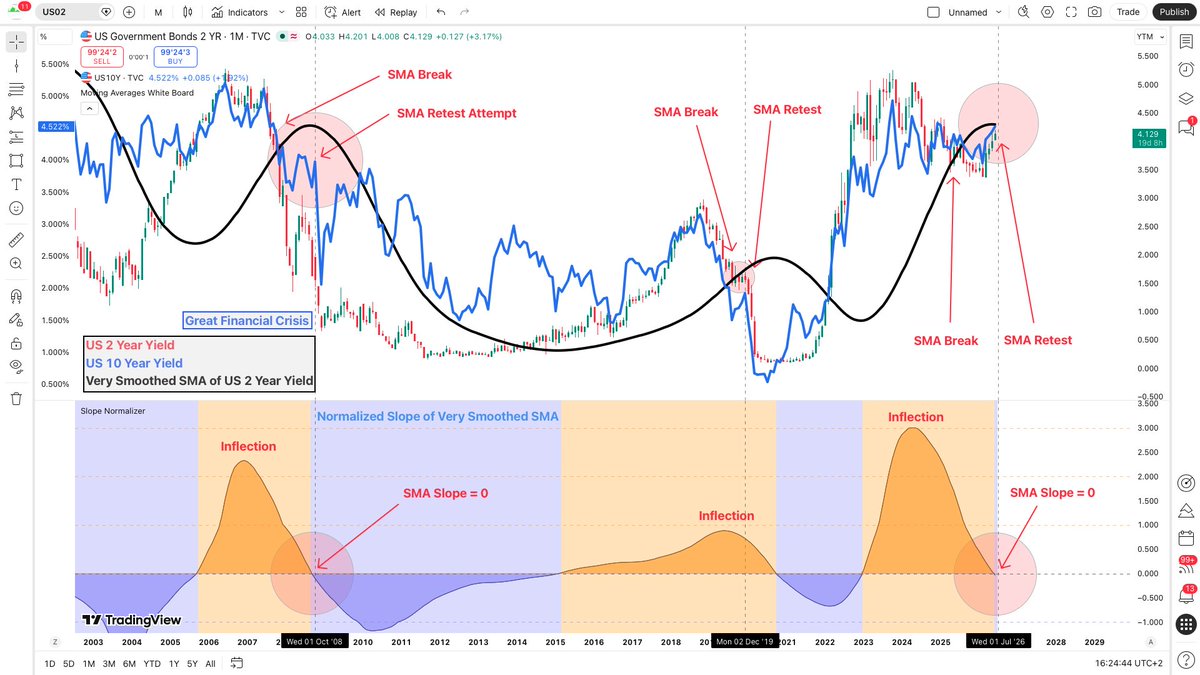
US 2 Year Yield SMA Slope
- 2 Year Yield SMA - black line
- SMA Slope - bottom panel
This looks like the Great Financial Crisis. Long $TLT
3
24
1,635
SmedleyButlerUSMC retweeted

Jun 10
PIMCO WARNS DEFAULT WAVE IS COMING
PIMCO warns that a credit-loss cycle is underway, with defaults expected to rise sharply among lower-quality borrowers, including leveraged and private credit companies. The firm says AI-driven disruption could hurt heavily indebted businesses, while current credit markets appear complacent about risks. PIMCO favors intermediate-term government bonds, citing recession risks, persistent uncertainty, and the potential for future central-bank rate cuts.
56
346
1,297
225,745
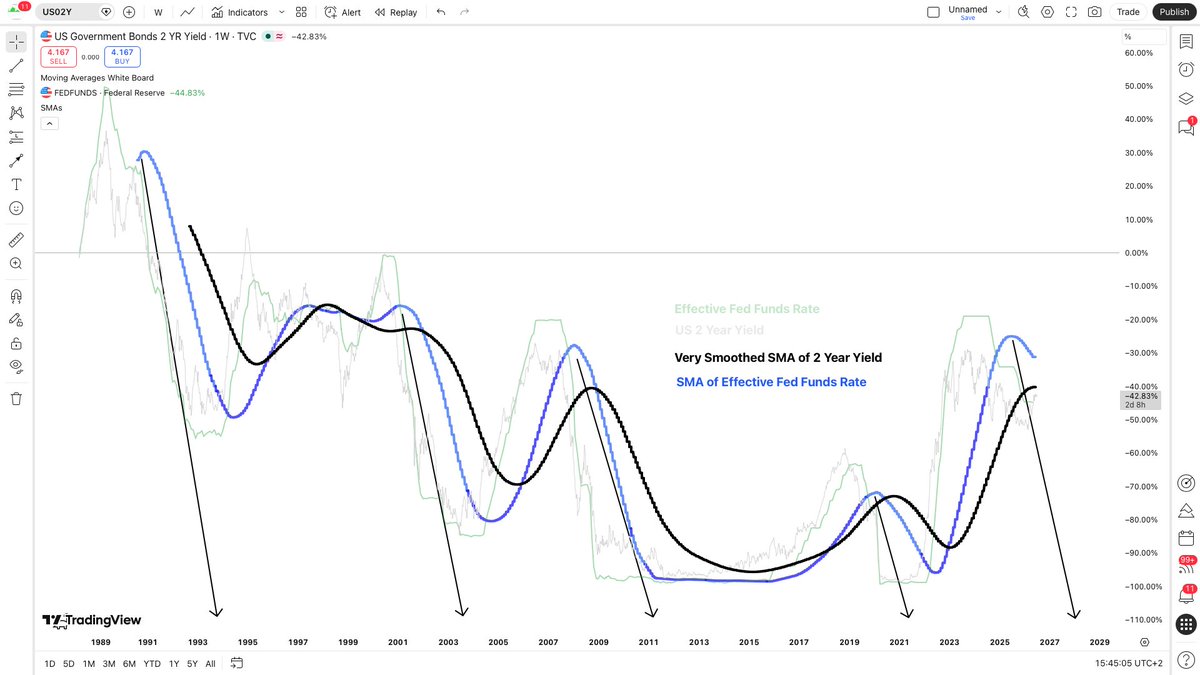
Fed Funds versus 2 Year
Got to smooth that data bros. Noise versus signal
1
3
10
570
SmedleyButlerUSMC retweeted

Jun 9
U.S. ECONOMY TEETERING ON EDGE OF RECESSION, WARNS MOODY'S CHIEF ECONOMIST
91
177
1,117
201,925
Very smoothed SMA of US 10 Year Yield
Standard top everywhere you look.
This is textbook & once it crashes everyone will say it was obvious.
No one will ever mention they thought rates would go higher because it will be so embarrassing to have not seen something so obvious.
3
5
17
873
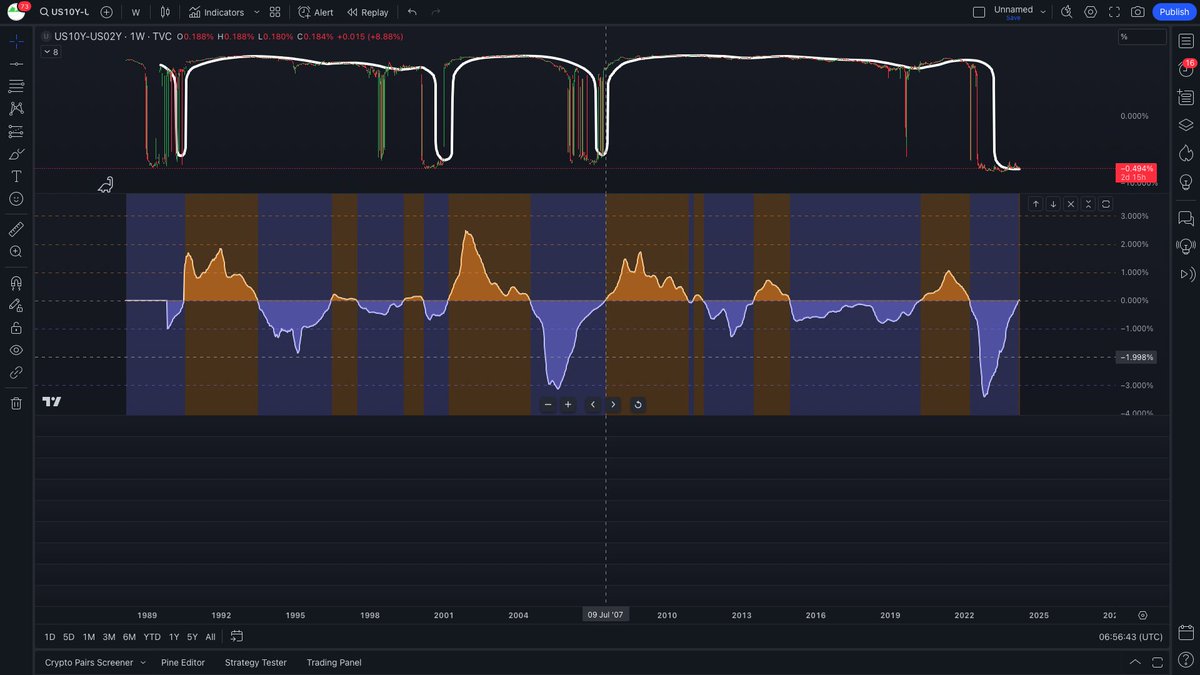
Time to check in on the yield curve
What do we think about this? This time is different or this time is delayed?
Long $TLT
4
2
13
1,160
Most similar event to what's happening now?
In my opinion the secular Paul Volcker peak in 1981. One theory is that the greater the deviation, the greater the correction, the greater the momentum, and the longer it takes for that momentum to turn around. That could apply here
1
2
123
Inflation adjusted personal interest payments over bonds versus rates
*Not my idea, but I can't remember where I saw this. If it was you, let me know and I'll give you the credit
4
360
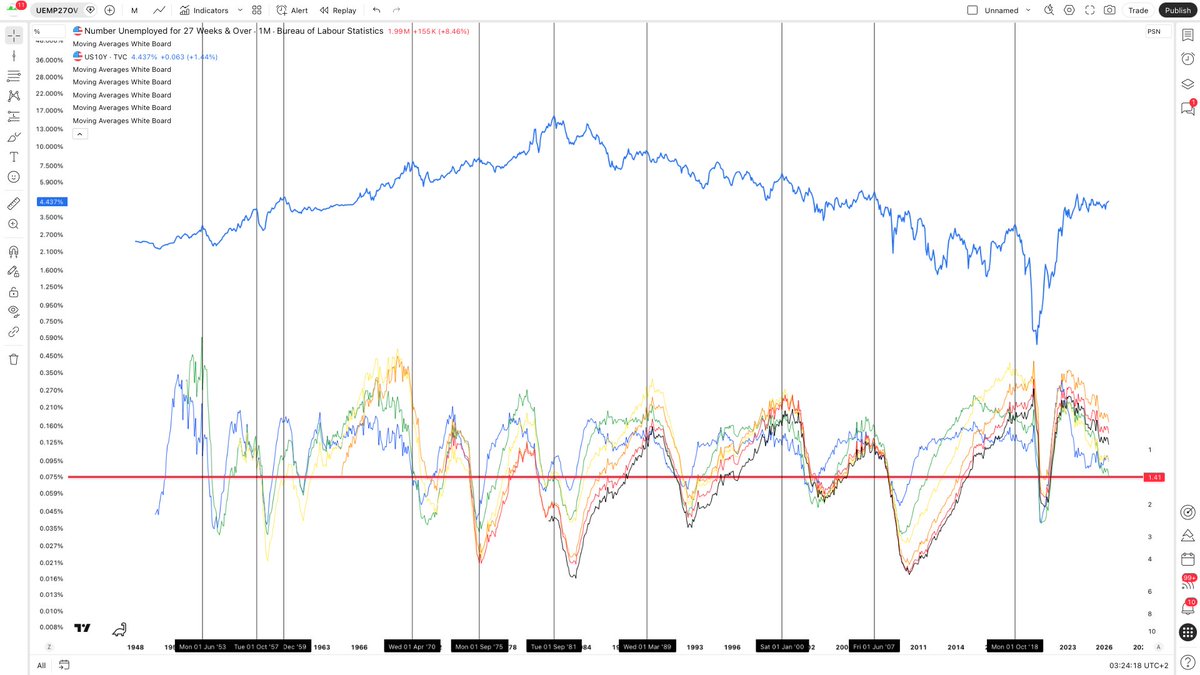
Unemployment deviation from averages ribbon
Tops in rates tend to be above the red line, while bottoms in rates tend to occur beneath it
Lags tend to be more pronounced in inflationary environments like the 1970's, with the ribbon leading rates
1
5
451