
Joined December 2021
- Tweets 1,207
- Following 90
- Followers 43
- Likes 75
Photos and videos
PS retweeted

Jun 13
The exact 12-step pre-market routine I use to know my bias before the market opens
takes 23 minutes
eliminates 90% of guessing
one of my students used this to go from 43% to 68% win rate
go do this tomorrow morning:
STEP 1: Open daily chart (6:00 AM)
- mark previous day high/low
- mark any unfilled fair value gaps
- takes 2 minutes
STEP 2: Identify the daily candle profile
- is yesterday's candle bullish or bearish?
- was there a large wick? (reversal sign)
- did it close near high/low? (continuation sign)
- takes 2 minutes
STEP 3: Check weekly context
- where are we in the weekly range?
- are we at weekly high or weekly low?
- takes 1 minute
STEP 4: Mark the 6AM candle (6:00-6:05 AM)
- did it sweep a key level?
- did it close back inside the range? (reversal)
- did it expand through? (continuation)
- takes 3 minutes
STEP 5: Identify what we did before the NY open (6:30 AM)
- hit daily level = wait for 1H structure
- hit 4H level = wait for 30M structure
- hit 1H level = wait for 5M structure
- takes 2 minutes
STEP 6: Draw your internal liquidity targets
- fair value gaps that price should fill
- takes 2 minutes
STEP 7: Draw your external liquidity targets
- previous highs/lows price should sweep
- takes 2 minutes
STEP 8: Set alerts (not watching charts constantly)
- alert at key levels
- alert at entry zones
- takes 3 minutes
STEP 9: Write your bias in ONE sentence
- "looking for longs into gap at X if we sweep the low"
- "looking for shorts after high sweep at X targeting Y"
- if you can't write it simply, you don't have a bias
- takes 1 minute
STEP 10: Set max trade count for the day
- usually 2-3 max
- write it down
- takes 30 seconds
STEP 11: Determine your "walk away" scenario
- "if I take 1 loss, I'm done for the day"
- "if I hit 2R, I'm done for the day"
- takes 30 seconds
STEP 12: Close the charts until 9:15
- no staring
- no adjusting
- no second-guessing
- go do something else
total time: 23 minutes
what you get:
- clear direction
- specific levels to trade
- defined targets
- rules for execution
- zero guessing at 9:30
most traders show up at 9:30 and stare at candles hoping for a "feeling"
you show up with a written plan and just execute
this isn't complicated
it's just work nobody wants to do
do the work.
free discord in bio. i'll show you how to make your first $10k/month
3
18
138
7,751
PS retweeted

Jun 3
“How do you decide which timeframe you want to trade on in the market?”— ICT Answers
Gem!💎

1
22
106
3,934
PS retweeted

In time, in good time, you will learn the skill that enables you to see the significant intraday price run and be content with that, as "enough".
As you were...
83
140
2,607
71,680
PS retweeted
May 29
The market is not random. I need you to really understand this
Every time you look at a chart and think "this could go either way," you're looking at a system that has RULES. Predictable, repeatable rules that institutions follow every single day because they have to
Let me show you what's actually happening behind every candle on your chart:
At 9:30am when the market opens, the chart doesn't just "start moving." What happens is billions of dollars in institutional orders hit the market simultaneously. Banks, hedge funds, pension funds. They all have orders to execute at the open
But here's the problem: these orders are MASSIVE. A single fund might need to buy $500 million worth of futures contracts. They can't just click "buy" because there aren't enough sellers at the current price. They need LIQUIDITY. They need a massive pool of sellers willing to sell to them
Where do they find this liquidity? Your stop losses
When you put a stop loss below a support level, you're creating a sell order that activates when price reaches that level. Millions of retail traders put stops in the same places. Below the previous low. Below the obvious support level. Below the round number
Institutions know this. Everyone can see where retail stops cluster. So they push price DOWN into those stop losses. The stops activate. Millions of sell orders fire simultaneously. The institutions buy against those sell orders. They now have their $500 million position filled at a discount
Then price reverses. Aggressively. Because the selling is done (it was artificial, created by stop hunts) and now institutional buying pressure takes over
This is called a liquidity sweep. It happens almost every single morning. Usually within the first 15-30 minutes of the open
It's not random. It's structural. Institutions need liquidity. Retail stops provide liquidity. The sweep happens. Price reverses. The pattern repeats forever because the underlying mechanics never change
Here's what this means for you:
If you can identify WHERE stops are sitting (below previous lows, above previous highs) and WAIT for them to get swept, you can enter in the direction of the reversal with extreme precision
The entry: after the sweep, when you see a strong displacement candle in the opposite direction
The stop loss: behind the sweep (if they sweep further, you're out with a small loss)
The target: the next major level, minimum 1:3 risk to reward
This is not a "theory." This is observable on every single chart, every single morning. Go open the NQ or ES chart on TradingView right now. Look at the first 30 minutes of any random day. You'll see price spike past a previous high or low, then reverse sharply. That's the sweep. It's right there in the data
The market isn't random. The market is a machine that processes institutional orders using retail stops as fuel. Once you see the machine, you can never unsee it. And once you understand the machine, you can position yourself on the right side of every sweep
The 90% who lose money are the ones providing the liquidity. They put their stops where everyone else puts stops. They get swept. They lose
The 10% who make money are the ones WAITING for the sweep to complete and then entering in the direction of the real move. They use the 90% as fuel
You're either the liquidity or you're the trader who profits from the liquidity grab. The education to switch sides costs $0 and takes 3-6 months of demo practice
The market has rules. Learn them and you see opportunity everywhere. Ignore them and the chart looks random forever
free discord in bio
(DM "SYSTEM" for fully private 1-on-1 coaching - this is a high ticket offer, i only take 1-2 traders at a time)
8
5
75
5,876
PS retweeted
May 29
there are 4 rules in trading that will either make you $50,000 a month or keep you broke forever
most traders learn rule 1 in year 6 of their journey
if they learn it at all
the 4 rules cost $0 to implement
they're written in plain sight
every profitable futures trader you've ever met runs all four
every broke one is missing at least three
the trading industry makes $4 billion a year off the broke ones who don't know these rules exist
RULE 1: you need ONE mechanical system, not 4 strategies
H4 bias confirmed. real body candle, one direction. that's your only side.
external liquidity swept. an old high or old low taken out. no sweep = no trade.
entry only from discount in a bullish leg or premium in a bearish leg. wrong half = no trade.
SMT triad confirmation. NQ ES YM. one refuses or a PSP prints on the close. no confirmation = no trade.
four conditions. all four required. zero exceptions.
if you're running more than one strategy you don't have multiple strategies. you have a permission slip to take any trade you want and call it the right one for current conditions
delete two. run the third for 30 sessions without changing a single rule. that's the only path
RULE 2: losing $100,000 will make you rich. losing $0 keeps you broke forever
the trader who has never lost real money has never learned anything real about himself
losing $500 teaches you nothing. losing $5,000 teaches you a little. losing $100,000 rewires your brain at a level no course, journal, or backtest can touch
you don't get to skip this
every trader making $50k a month has a previous version of himself who lost six figures learning what he now does for a living
if you've blown 1 funded account and decided "trading isn't for me" — you didn't even start
the loss isn't the failure. quitting before the loss teaches you is
RULE 3: being broke makes trading 10 times harder
a trader with $30,000 in the bank takes a $200 loss and shrugs. same trader with $400 in the bank takes a $200 loss and spirals
your account doesn't blow up because your strategy failed. it blows up because your nervous system can't handle a normal losing streak while your bank account is in survival mode
every trade you take while financially desperate is an oversized trade in disguise. you'll move stops. you'll close winners early. you'll revenge trade. not because you're undisciplined. because your brain is screaming at you to PROTECT THE LAST DOLLAR
the fix is not "more discipline"
the fix is fixing your money situation outside of trading FIRST. cover 6 months of expenses. then trade. the difference in your win rate will be 15-20% from this alone
RULE 4: risk management is not a per-trade number, it's a layered system
most traders set 1% per trade and call it risk management. it's not
real risk management is FOUR numbers:
position risk: 0.5% per trade max
correlation risk: no two correlated trades open above 1% combined exposure
session risk: 1.5% account drawdown = stop trading for the day, automatically
weekly risk: 3% account drawdown = stop trading for the week, automatically
these numbers are written BEFORE the trade. they are not overridden in real time. not for "high conviction" setups. not for "I'm just about to recover" trades. not ever.
the moment you override a written risk rule you stop being a trader and start being a gambler. doesn't matter how right you are about the setup
most traders never learn these 4 rules
they spend 5 years chasing the next strategy
they blow accounts trying to compound a $500 personal account into a lifestyle
they call themselves traders
they're not traders
learn the 4 rules
or keep paying tuition to the industry that profits when you don't
free discord in bio
(DM "SYSTEM" for fully private 1-on-1 coaching - this is a high ticket offer, i only take 1-2 traders at a time)
8
8
72
5,861
PS retweeted

May 28
For serious ICT traders. Print this on a note and study it daily
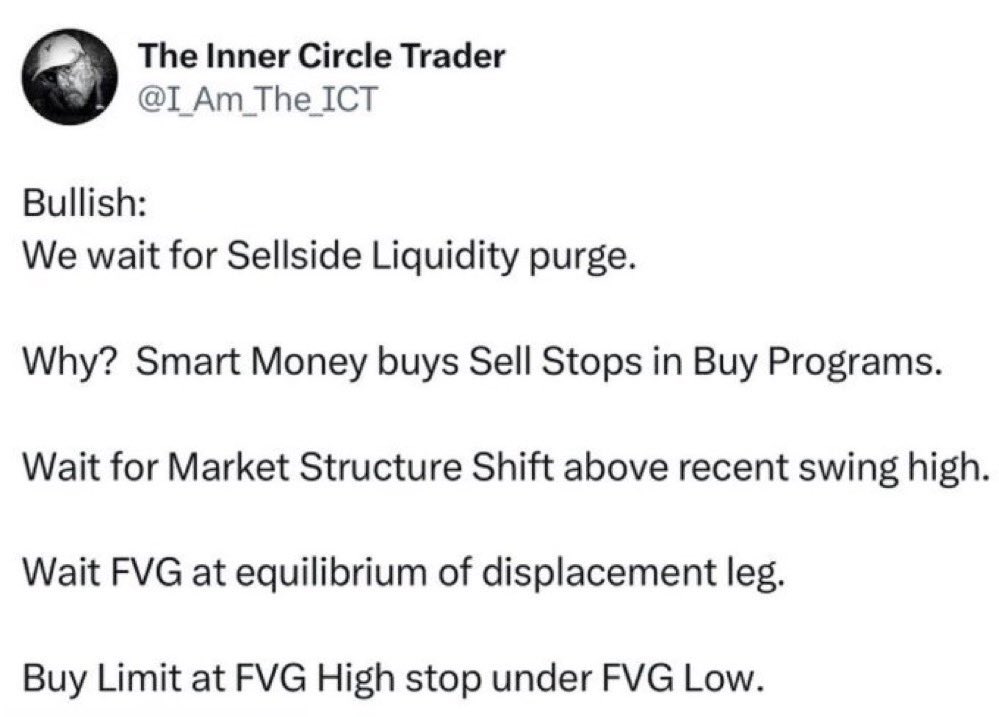
9
35
336
8,134


PS retweeted
May 26
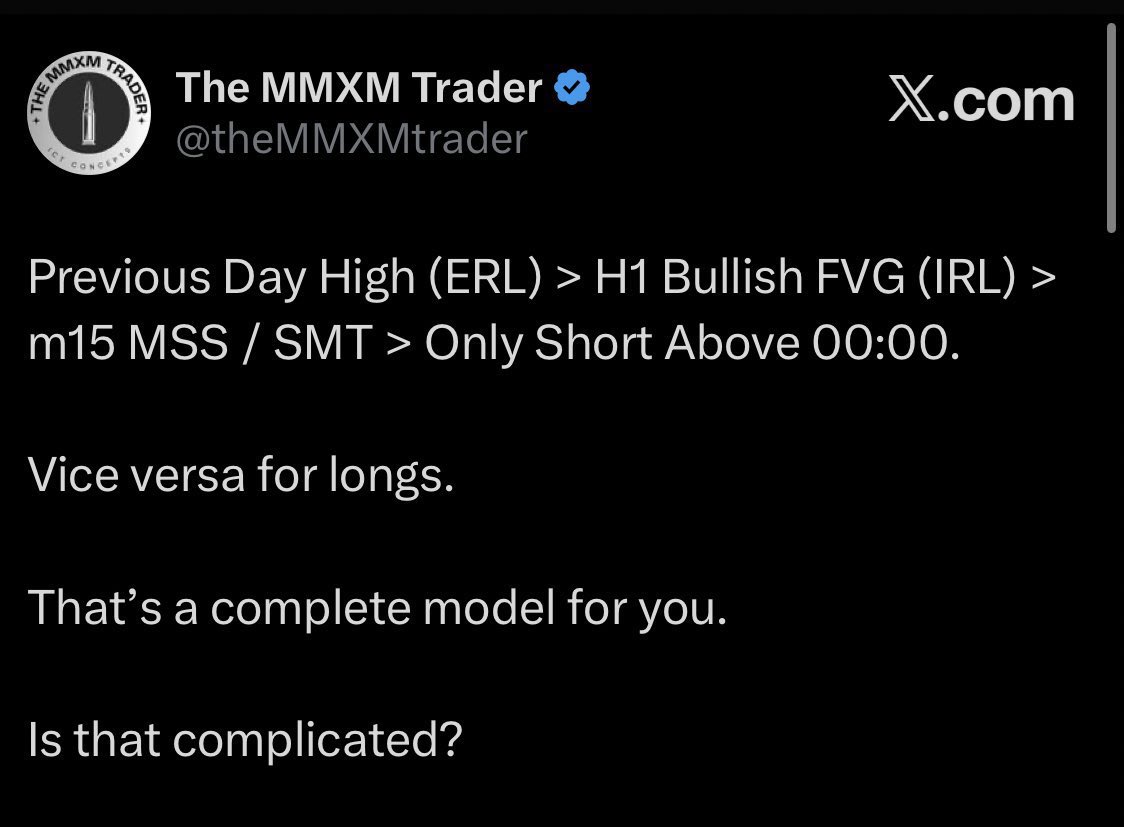
ICT OSFL, One Setup For Life by The MMXM Trader
East Day Trading Model For Your Forward-testing and Backtesting
Is that complicated?
2
7
41
1,805
PS retweeted
May 25
the exact same order block lost you $340 at 9:53 this morning would have made you $612 at 10:15.
same chart. same entry. same risk. same shape
different outcome
you're not bad at trading. you're bad at filtering.
a pattern in isolation is roughly a coin flip. an order block at random conditions wins about 50% of the time. at 1.5R that's a slow grind to a flat account
a pattern with four filters in front of it is a different animal
H4 expansion candle confirmed by candle profiling. external range liquidity swept on the LTF. entry from a discount zone aligned with the bias. true SMT on the correlated assets - a PSP where the same candle closes opposing on NQ and ES.
let me break down what each filter is actually doing.
filter 1 - the H4 expansion candle. you're checking that the higher timeframe has already committed. real body in one direction. small wicks. that candle is the institution leaving a fingerprint. without it, you have no bias. with it, you have a side.
filter 2 - external liquidity swept. price has to take out an old high or old low before the entry. that's the institution harvesting stops to fill orders. if the liquidity hasn't been swept yet, you're entering before the institution did. that's how you become the stop they're hunting.
filter 3 - entry from a discount zone aligned with the bias. on a bullish bias you only enter below the 50% of the leg. on a bearish bias you only enter above. you're not chasing price. you're letting price come to you at a level institutions are willing to defend.
filter 4 - SMT confirmation. you watch NQ, ES, YM at the moment of the entry candle. one of them prints a PSP - closes the opposite direction of the other two. that's institutional divergence printing in real time. the asset that closed opposite is the lagger refusing to follow the manipulation. you trade the side the two confirming indices are on.
now the same order block wins closer to 65 to 70%. at 2R that's an actual edge.
four filters away from random.
so why don't you use them.
because filters slow you down. filters mean sitting on your hands for 90 minutes waiting for permission. filters mean skipping 4 patterns that "look good" to take 1 that's actually qualified.
and that's the real problem. you're addicted to taking trades. not to making money.
you want to be in the market because being in the market feels like progress. being flat feels like failure. so you take the shape and skip the conditions and convince yourself the next one will work.
it won't.
not because the shape doesn't work. because the shape without the filters is a coin flip. 14 months of YouTube education does not let you outperform a coin flip.
every profitable trader you'll meet took fewer trades this month than the broke version of them used to take.
fewer setups. higher quality. more skips.
you don't need to learn another setup. you need to stop taking the ones you already know without the conditions that make them work.
every "next" strategy you buy is a tax on the one you already had. you didn't fix it. you abandoned it.
a 26-year-old in my discord with a $12,000 blown personal account and 3 failed Topstep challenges added one filter to his entry process. H4 bias must agree with the 15m setup. nothing else changed. went from 31 trades a week to 9. went from -$2,100 monthly to $3,400.
he didn't learn anything new. he subtracted.
your win rate doesn't go up because you add another tool. it goes up because you start skipping the trades you already know shouldn't be taken.
stop being a pattern collector. start being a filter operator.
your account knows the difference. you're the one still pretending it doesn't.
free discord in bio (DM "SYSTEM" for 1-on-1 coaching, I only take 1-2 traders at a time to work fully private with - this is a high ticket offer)
2
1
29
2,363
PS retweeted
May 25
you're not a 15-minute trader. you're an H4 trader who enters on the 15m. you have it inverted and that's why your win rate sits at 48%.
someone asks what timeframe you trade. you say "15 minute." wrong answer.
you don't TRADE the 15m. you enter on the 15m. you trade the H4.
every 15m setup you take against the H4 bias is a high-quality way to lose money.
price is fractal. but timeframe alignment is not optional. each higher level pairs with a specific lower-timeframe structure. daily level pairs with 1-hour. 4-hour level pairs with 30-minute or 15-minute. 1-hour level pairs with 5-minute. 30-minute pairs with 3-minute. you don't get to pick.
the H4 candle gives you three things the 15m cannot. direction. momentum. context.
candle profile the H4 first. real body in one direction with small wicks. expansion signature. the next H4 candle should respect the EQ - the midpoint of the prior candle - and continue. that's your fractalization window into the 15m.
big wicks both sides with a small body. indecision candle. you stay flat.
the 15m gives you one thing. a timing window for entry inside the H4 you already profiled.
most traders flip this. they scan the 15m for setups all session. then ask the H4 to confirm. that's not a strategy. that's confirmation bias on a faster timeframe.
here's the filter.
H4 bullish. close above the previous candle's high with a real body. longs only on the 15m. shorts don't exist.
H4 bearish. close below the previous candle's low with a real body. shorts only on the 15m. longs don't exist.
H4 indecisive. closes inside the prior candle's range with no displacement. no trade. close the platform.
my win rate moved from 48% to 61% the month i added this single layer. didn't get sharper at reading 15m candles. didn't find a new entry trigger. just stopped taking 15m trades that fought the H4.
40% fewer trades. 30% more revenue.
you have a 15m setup. you don't have a 15m trade. those are different things.
every funded trader you envy uses some version of this filter. multi-timeframe alignment is not a buzzword. it's the only reason an edge has any persistence.
a 15m breakout into an H4 supply zone is not a long. it's exit liquidity.
a 15m breakdown into an H4 demand zone is not a short. it's a stop hunt.
read the H4 before you look at the LTF.
if the H4 doesn't give you a side, you don't get a trade.
stop being a 15m gambler. start being an H4 trader who uses the 15m as a watch.
my full system is free (discord in bio)
(DM "SYSTEM" for 1-on-1 coaching, I only take 1-2 traders at a time to work fully private with - this is a high ticket offer)
8
9
69
5,350
PS retweeted
May 23
the entire futures market does one thing. it moves with intent to take liquidity. that's it. that's the whole game.
stop sweep. fair value gap fill. next stop sweep. next fair value gap fill. repeat until close.
90% of you are trying to predict tops and bottoms based on indicators when the market isn't predicting anything. it's just hunting.
let me reframe this so you can never unsee it.
there are exactly two types of liquidity that matter on a futures chart.
external range liquidity. every old high and every old low. every equal high. every equal low. every session high and low. these are where stops accumulate. price goes hunting these.
internal range liquidity. every fair value gap. every imbalance. every unfilled inefficiency in the prior leg. these are where price returns to fill before extending.
the only thing the market does is move between these two states. external to internal. internal to external. external. internal. external. internal.
it sweeps the high (external). fills the gap below (internal). sweeps the low (external). fills the gap above (internal). that's the move. there is no other movement.
every "breakout" you've ever chased that failed was a sweep of external liquidity. there was no fundamental breakout. there was just price taking the stops, then turning to fill internal liquidity below.
every "support level holding" that suddenly broke wasn't support failing. it was the market needing to sweep external below to harvest stops before reversing higher.
the candles you see are the result of this dance. not the cause.
and this is fractal. it happens on the daily. it happens on the 4-hour. it happens on the 15-minute. it happens on the 1-minute. same exact mechanism. just different timeframes. that's why timeframe alignment matters. daily external pairs with 1-hour internal. 4-hour external pairs with 30-minute internal. each level has its own pools but they all do the same thing.
one of my discord traders went from 48 trades a week trying to "catch moves" to 5 to 7 trades a week waiting for liquidity sequences. his win rate moved from 41% to 67% in 90 days.
he didn't get better at chart reading. he stopped fighting the algorithm and started anticipating where it was going next.
the framework is simple.
step one. identify the nearest external liquidity. high or low.
step two. wait for it to be swept.
step three. identify the internal liquidity. fair value gap on the corresponding lower timeframe.
step four. enter on the return to fill the imbalance.
step five. target the next external liquidity in the opposite direction.
most traders try to enter before the sweep. they get caught in continuation. then they watch the very move they predicted happen, just in the wrong order, after they've already been stopped out.
stop predicting tops and bottoms. you don't need to. the market tells you exactly where it's going if you read it in pools instead of patterns.
external. internal. external.
that's the trade.
(DM "SYSTEM" for 1-on-1 coaching, I only take 1-2 traders at a time to work fully private with - this is a high ticket offer)
3
10
104
7,448
PS retweeted
May 22
The market shows you every reversal 15 minutes before it happens
Not with RSI. Not with volume. Not with "gut feeling"
With three charts that disagree with each other in real time
95% of retail traders watch one chart. The 5% who watch three indices side by side see manipulation print before the move even starts
Here's what nobody teaches you:
Smart money cannot manipulate three correlated indices at the same time
They can push NQ to a new high. They can push ES to a new high. They can push YM to a new high. But when they're engineering a reversal, the triad breaks down. One index sweeps the level. The other two refuse to confirm. That refusal is the institutional fingerprint
That breakdown is called SMT - Smart Money Technique
It works like this:
NQ, ES, and YM are the three US index futures. They move together 90% of the time. When they DON'T - at a key level - that's not noise. That's a setup printing
The rule:
If all three confirm the move together - continuation
If one sweeps and the other two refuse - manipulation in progress
The institution that pushed the one chart through the level doesn't have enough volume to push all three. The two that refused are telling you the move is fake
That's the entire signal. Three charts. One refuses. Reversal incoming
Here's how the signal plays out on a real chart:
SCENARIO 1: NQ sweeps the high, ES and YM refuse
NQ runs into the previous day's high at 10:15. Takes the stops out above it. Clean breakout on NQ alone
You check ES. ES is 8 points below its previous day's high. Refusing to follow
You check YM. YM is 80 points below its previous day's high. Not even close
That's the divergence. NQ swept. ES refused. YM refused harder
This is the manipulation signature. The institution had enough volume to push NQ. They couldn't get ES or YM there. The breakout is the engineered grab. ES and YM are telling you the truth in real time
Within 15 minutes NQ is reversing back below the high. ES follows. YM was already there
SCENARIO 2: YM sweeps the low, NQ and ES refuse
Different day. Different asset leads the sweep. Same mechanic
YM dumps into the overnight low at 9:45. Sweeps the liquidity below
You check ES. ES is testing its overnight low but holding above it
You check NQ. NQ is 30 points above its overnight low. Refusing to follow
Reversal is confirmed before NQ or ES even move. YM was the engineered sweep. The other two refused. Smart money grabbed liquidity on YM to load a long. The refusing assets tell you everything
You enter long. Stop below the failed sweep. Target the daily high
Now the deep dive
SCENARIO 3: 2-stage SMT - the highest probability reversal in the entire market
This is the one I run every morning. Most traders who use SMT stop at stage 1. That's why their win rate stalls in the 60s. Stage 2 is where the win rate jumps
Stage 1 - the higher timeframe SMT:
Price runs into a daily or weekly high or low. One of the three indices sweeps it. The other two don't
That sweep alone isn't the signal. You need confirmation. The confirmation is displacement - a strong move AWAY from the swept level immediately after the sweep
If price sweeps the daily high on NQ, ES and YM refuse, and then all three displace bearishly away from the level - stage 1 SMT is confirmed. The HTF level is protected
Stage 1 win rate alone: 60-65%. Good. Not great. The institution still sometimes pushes price back to that level for a second attempt
Stage 2 - the lower timeframe confirmation:
After stage 1 prints on the higher timeframe, you drop down. Price will usually pull back toward the protected level. You're not entering yet. You're waiting for stage 2 to confirm the reversal has actually started
Stage 2 shows up in one of two forms:
FORM A - another SMT:
One asset takes out a smaller high or low - a session high, a 15-minute swing, an overnight high. The other two refuse. Same mechanic as stage 1 but on a smaller scale
You now have HTF SMT LTF SMT. Two failed manipulation attempts. The reversal is locked in
FORM B - a PSP:
PSP stands for Precision Swing Point
A PSP is when one of the three indices closes a candle in the opposite direction of the other two on the same timeframe at the same time
Example: the 9:30 30-minute candle closes
NQ closes bearish
ES closes bullish
YM closes bullish
That's a PSP. Two bullish closes, one bearish. The divergence is in the candle closures, not the swept highs/lows
If you're bullish-biased on the day, you trade YM - the strongest of the two confirming closes. The bearish closer (NQ) is the lagger refusing to confirm the move you want. The strongest closer (YM) is your entry vehicle
The direction of the PSP doesn't matter. What matters is that the divergence exists. Could be 2 bullish 1 bearish. Could be 2 bearish 1 bullish. Either way, the odd one out is the asset that's failing to confirm
Stage 2 SMT - whether in the form of another SMT or a PSP - win rate in my data: 81% across 240 entries last year
How to read it on the chart:
You need three charts open. NQ, ES, and YM. Same timeframe. Same time
You mark the daily and weekly highs and lows on all three
You wait for the HTF sweep - one asset takes out a daily or weekly level, the other two refuse
You wait for displacement away from that level. Stage 1 confirmed
You drop down to the lower timeframe. You wait for either another SMT on a smaller level OR a PSP on the candle close
When stage 2 prints - entry triggered. Stop above/below the failed sweep. Target the opposite side of the daily range
That's it. Three charts. Two stages. Two ways to confirm stage 2. Repeated daily
The model behind all of this:
Institutions cannot move three correlated assets in lockstep when they're engineering a reversal. They have enough volume to manipulate one. The other two leak the truth - either through refusing to sweep the same level, or through closing a candle in the opposite direction
The triad breakdown IS the manipulation signature. Every reversal in the US index futures market leaves this fingerprint. You just need all three charts open to see it
How I use this every morning:
8:30 AM - Open NQ, ES, and YM side by side. Mark previous day high, low, weekly high, weekly low on all three
9:30 AM - Watch for the first sweep on any of the three indices into a marked level. Check the other two. If they refuse - flag stage 1
9:45 AM - Wait for displacement away from the swept level to confirm stage 1
10:00 AM - Drop to the 15min or 30min. Watch for either another SMT or a PSP on the candle close
10:15-10:30 AM - Stage 2 prints. Entry triggered. Stop behind the failed sweep. Target the opposite side of the daily range
11:00 AM - Either in profit or stopped out. Done. Laptop closed
A trader I work with used to enter every sweep he saw on NQ alone. 52% win rate. Slowly bleeding through prop firm accounts
I told him one thing: never enter a sweep without checking the other two indices
He started running NQ, ES, and YM side by side. He stopped entering single-chart sweeps. He only took stage 2 confirmations - either second SMT or a PSP on the candle close
Same strategy. Same setups. Same risk. Added one filter
Win rate went from 52% to 78%. Passed his next funded challenge in 9 trading days. Now he runs 3 funded accounts and sees the manipulation before the move starts
He didn't learn a new strategy. He learned to read what the other two indices were already telling him
Three charts. Two stages. HTF SMT plus displacement. Then either another SMT or a PSP. That's the entire model
Most traders spend years searching for an "edge" while the edge is sitting on the two charts next to the one they're staring at
The signal is free. It prints on every reversal. You just have to open the other two charts
Or keep watching one chart and wondering why every "breakout" reverses on you
Your choice
(DM "SYSTEM" for 1-on-1 coaching. i take 1-2 traders at a time a work with you fully private. this is a high ticket offer)
15
36
294
24,610
PS retweeted

May 22
“Indian society respects a man losing his health in a corporate cubicle more than a man trying to survive honestly in the markets.”
That sentence will offend a lot of people.
But every serious trader in this country knows it’s true. Because the moment you say you’re a trader in India, people look at you differently.
Like you’re irresponsible. Unstable.
Jobless. One step away from gambling your life away. Nobody sees the reality behind that screen. Nobody sees the boy who skipped vacations for years because he blew up an account and had to rebuild from zero silently. Nobody sees the man staring at charts till midnight, replaying expiry candles again and again, trying to understand whether it was his mistake… or just market chaos. Nobody sees the trader sitting quietly during family functions because his mind is still stuck on the one revenge trade that destroyed three months of hard earned consistency.
Trading in India is one of the few professions where you can work harder than everyone around you… and still end the month questioning yourself.
There are no promotions here. No fixed salary. No manager telling you “good job.”
No guarantee that tomorrow will pay you for today’s discipline.
Just you. Your mind. And a market that owes you absolutely nothing.
People think traders are addicted to money.
No.
Most traders are addicted to hope. Hope that one day the discipline will finally click.
Hope that one day they can look at their parents and say, “It worked.” Hope that one day they can live life without asking permission from anybody.
But what nobody talks about is the emotional cost of chasing that freedom. The isolation. The self doubt. The guilt after losses. The silent anxiety before every market open. The emotional numbness that slowly creeps into your personality after years of uncertainty.
A real trader doesn’t just learn price action.
He learns emotional survival. He learns how to stay calm after losing money. How to avoid revenge trading when frustration is boiling inside him. How to control greed when profits come easy. How to sit on his hands while the market moves without him.
How to protect capital when his own emotions are begging him to take one more trade.
And the worst part? Even after mastering all this… the battle still doesn’t end. Because a trader is not only fighting the market anymore.He is fighting an entire ecosystem.
Weekly expiry chaos. Violent gap openings.
Random policy announcements. Liquidity traps. Manipulative moves. Constant regulatory uncertainty. Rising turnover charges. Taxes at every possible layer.
Sometimes it genuinely feels like a trader in this country is surviving despite the system… not because of it. And yet… every morning at 9:15… lakhs of traders still sit in front of their screens quietly. Not because they are reckless. Not because they are lazy. Not because they are gamblers.
But because somewhere deep inside, they still believe discipline can defeat uncertainty. That belief comes at a cost. A very heavy cost. Missed memories. Sleepless nights. Broken confidence.
Mental exhaustion. Loneliness so deep that anonymous people from Twitter Spaces start feeling more emotionally relatable than people in your own house. And still… traders continue.
Because once you truly fall in love with markets, it stops being about money. It becomes a test of character. So maybe it’s time people stopped mocking traders as if they are doing something shameful.
And maybe it’s time policymakers too understood the difference between reckless speculation and serious market participation. A genuine trader already carries enough risk every single day.
He should not also feel punished by excessive charges, double taxation, and an ecosystem that keeps becoming harder for small participants to survive in. Behind every trading terminal in India…
there is a human being fighting one of the toughest psychological battles imaginable.

40
35
205
18,483
PS retweeted

May 22
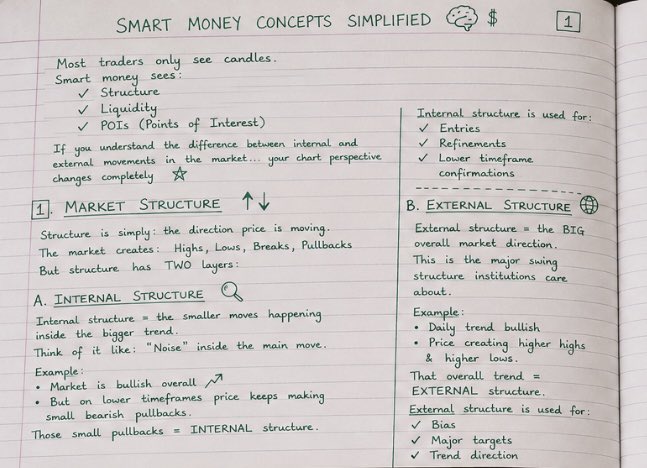
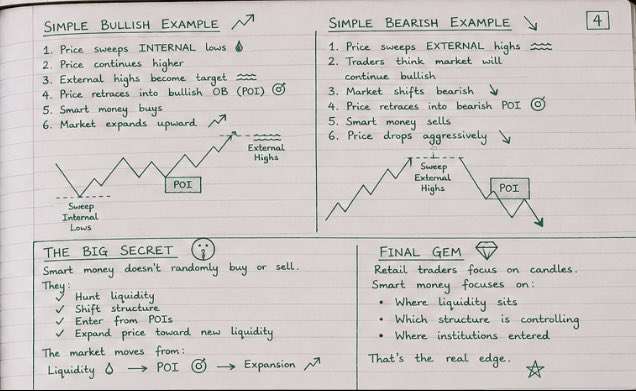
Internal vs External Structure & Liquidity.


11
40
162
5,688
PS retweeted

May 20
Every profitable trader I know got there by quitting something, not adding something.
Here's what they stopped doing 👇🧵
1
3
16
2,811
PS retweeted

This is Michael Marcus.
He turned $30,000 into $80 million trading futures and currencies.
Here's his trading philosophy
34
333
2,605
305,283


PS retweeted
May 18
you're addicted to learning
and allergic to doing
you've watched 8 hours of "new ICT model"
you're "backtesting" a new "90% WR" system
you're in 5 discord groups
you're looking for the "magic strategy"
you're not a trader
you're a strategy collector
and you're broke
the killer?
he's been trading the same fucking setup for 3 years
he's not "learning"
he's executing
he's not "backtesting"
he's printing
but here's the part nobody explains:
WHAT does "mastering one system" actually look like week by week?
because "pick one system and stick with it" is useless advice if you don't know what DEPTH looks like
here's what depth looks like:
WEEK 1-2: you learn the cycle
price moves from external liquidity to internal liquidity. sweep the stops. fill the gap. target the opposite side
you mark 100 examples. not 10. one hundred. you sit there and mark the cycle on historical charts until your eyes burn. by the end of week 2 you see the cycle everywhere. on every chart. every timeframe. you can't unsee it
that's not mastery yet. that's just literacy
WEEK 3-4: you learn to read the candle above you
every setup exists INSIDE a higher timeframe candle. the candle determines whether your setup has room to work
you learn OHLC vs OLHC. how the 4-hour candle formed. not how it looks - how it FORMED. did it open low first and push higher? or open high first and drop?
you go back through your 100 examples. tag each one: was the setup inside an expansion candle or a reversal candle?
the wins were inside expansion candles. the losses were inside reversal candles. you see it in YOUR data. not because i told you. because you tracked it
WEEK 5-6: you learn the session rotation
you go back through 30 trading days. mark what London did. mark what the 6AM candle confirmed. mark what NY did after
London reversed → NY continued. every time. nobody reversed → NY reversed. every time
you stop showing up at 9:30 blind. you start showing up knowing the direction. because you tracked 30 days of session rotation and the pattern is undeniable in YOUR data
WEEK 7-8: you learn to check the second chart
you pull up ES next to NQ on every one of your previous entries. the breakout entries where you got wicked out - ES didn't confirm. the reversal entries that ran to target ES diverged at the level
you add YM. same thing. YM diverges and the strong asset switches to weak at every reversal. you see it 40 times in your data. now you can't enter without checking
WEEK 9-10: you learn the confirmation
you tag every entry: was the V-shape there? expansion in, displacement out, gap forms
the entries WITH V-shape: 63% win rate
the entries WITHOUT: 29%
same levels. same gaps. one had displacement. the other drifted in sideways
by week 10 you have a system that's not built from a youtube video
it's built from YOUR data. YOUR trades. YOUR charts. YOUR evidence
and here's what happens to strategy collectors during those same 10 weeks:
week 1-2: "learning" ICT silver bullet
week 3-4: "that didn't work, trying SMC now"
week 5-6: "SMC is confusing, found a new guy on youtube"
week 7-8: "this new system has a 90% win rate backtest"
week 9-10: "it doesn't work live, maybe I need a course"
10 weeks. 4 strategies. zero depth on any of them. zero personal data. zero conviction. same win rate as week 1
you spent 10 weeks going WIDE
the killer spent 10 weeks going DEEP
you have 4 strategies you can explain but can't trade
he has 1 system backed by 300 data points from his own charts that he trusts with his life
that's why he clicks buy without hesitation
and you hover over the button wondering if this is "the right strategy"
depth beats width
every single time
stop collecting
start digging
(free discord in bio. if you think you're a good fit - DM me "SYSTEM" for 1-on-1 coaching. i only take on 1-2 traders at a time to work with fully private)
1
4
41
2,349