- Tweets 1,859
- Following 789
- Followers 277
- Likes 9,823


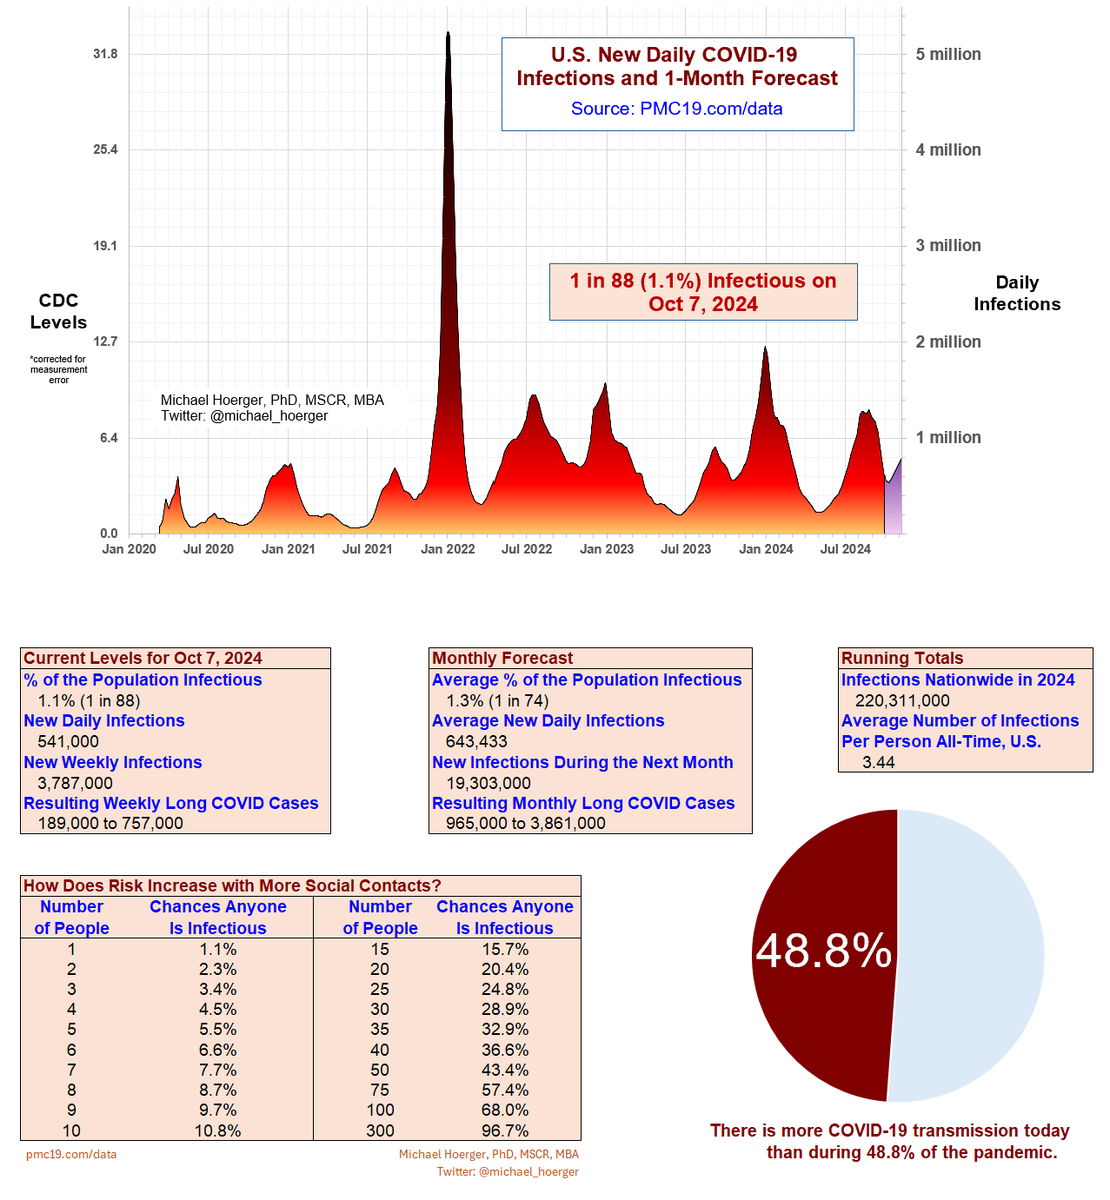
ALT Graph: 10 waves of the pandemic Tables/stats: Current Levels for Oct 7, 2024 % of the Population Infectious 1.1% (1 in 88) New Daily Infections 541,000 New Weekly Infections 3,787,000 Resulting Weekly Long COVID Cases 189,000 to 757,000 Monthly Forecast Average % of the Population Infectious 1.3% (1 in 74) Average New Daily Infections 643,433 New Infections During the Next Month 19,303,000 Resulting Monthly Long COVID Cases 965,000 to 3,861,000 Running Totals Infections Nationwide in 2024 220,311,000 Average Number of Infections Per Person All-Time, U.S. 3.44 How Does Risk Increase with More Social Contacts? Number of people | chances anyone is infectious 1 1.1% 2 2.3% 3 3.4% 4 4.5% 5 5.5% 6 6.6% 7 7.7% 8 8.7% 9 9.7% 10 10.8% 15 15.7% 20 20.4% 25 24.8% 30 28.9% 35 32.9% 40 36.6% 50 43.4% 75 57.4% 100 68.0% 300 96.7% There is more COVID-19 transmission today than during 48.8% of the pandemic.