
Statistical Data Analyst , Statistical programmer, Applied statistician & Bio-statistician. ⛔No Private messages 👉 🚫📩❌.
Joined October 2017
- Tweets 9,102
- Following 2,160
- Followers 7,981
- Likes 9,494
3,115 Photos and videos


Pinned Tweet

How would you rate the accuracy and practical usefulness of my long-range forecasts for Autumn 2025 and Winter 2026 so far?
(Rating Scale):
(5🌟) Excellent (Highly accurate & very useful)
(4🌟) Good (Mostly accurate & useful)
(3🌟) Moderate (Mixed performance)
(2🌟) Low accuracy (Limited usefulness )
(1🌟) Not useful / Missed expectations
Your feedback helps refine future outlooks and improve regional targeting.
Please also mention your country/region in the comments so I can prioritize areas of highest relevance and usability .

20
3
20
9,446
🚨#HeadsUp: Early Polar SSW & Vortex Weakening Signal — Autumn 2026 .
Last year, I highlighted the potential for an unusually early and (rare occurrence) November Polar Vortex disruption and Sudden Stratospheric Warming events, months before it became widely discussed by forecasting centers and analysts .
🔗 See the 2025 early SSW forecast:
x.com/Statisticizer/status/1…
This year, a multivariable framework incorporating solar, planetary, space-atmospheric weather, and stratospheric factors has been used to assess the upcoming season’s polar behavior .
After examining the latest analog composites (n=20, with additional supporting cases) and stratospheric diagnostics for November 2026, a SSW event signal is again emerging that warrants attention.
🔷 Key Signals
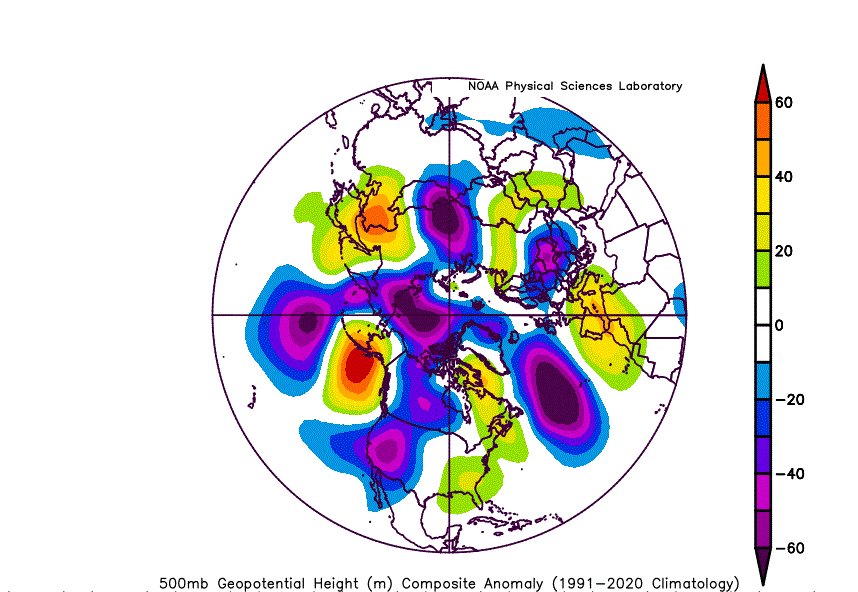
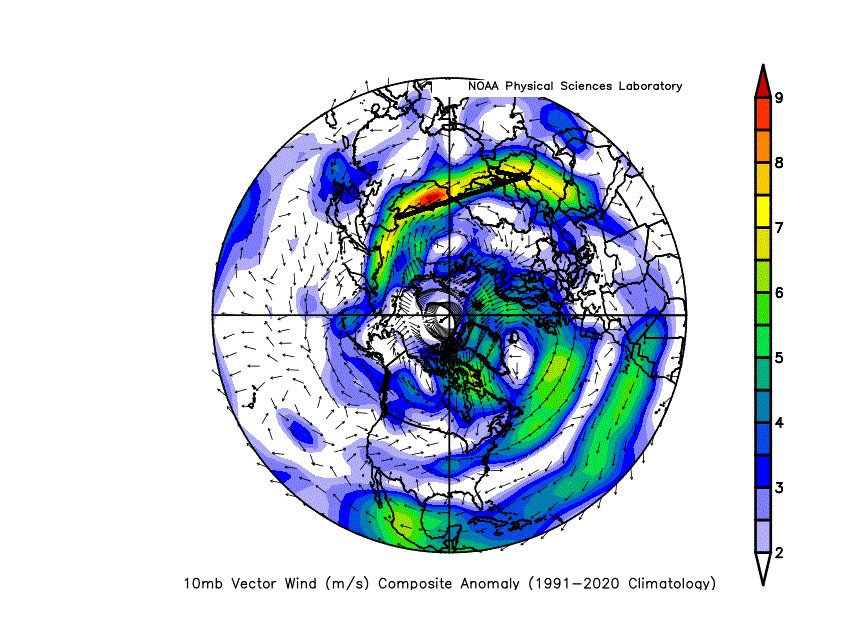
🔹 10 hPa temperatures indicate developing polar warming during the second half of November, with persistent anomalies extending across North America, Alaska, and parts of southern Europe between ~15–30 November.
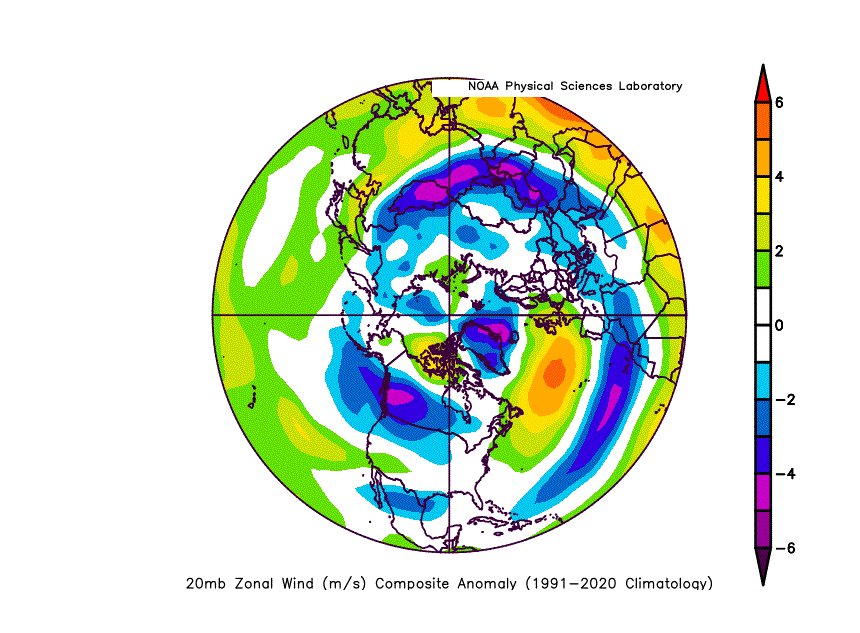
🔹 30–100 hPa geopotential height anomalies show strong upward-propagating wave activity into the polar stratosphere, with indications of zonal wind deceleration and partial reversal above ~65–70°N.
🔹 The vortex appears increasingly susceptible to displacement and deformation, particularly during the 15–25 November window.
🔹 A coherent Rossby wave train is evident across multiple atmospheric layers, suggesting active troposphere–stratosphere coupling.
🔷 Interpretation
The current signal supports:
✔ Elevated probability of early-season vortex weakening
✔ Increased likelihood of a displacement-type warming event
✔ Enhanced planetary wave activity
⚠️ Moderate probability of vortex stretch / partial split
🔷 Key Uncertainty
I am not yet concluding a major SSW, but signals from this early outlook do support it.
The decisive factor remains:
Whether warming intensifies enough to produce a full zonal wind reversal at 10 hPa near 60°N. Yet this early analyses do point for definite reversal of wind. see comment.
🔷 Bottom Line
A dynamically active stratospheric regime is likely during late autumn 2026, with a credible signal for early vortex disturbance.
However, confirmation of a major SSW or full split remains conditional.
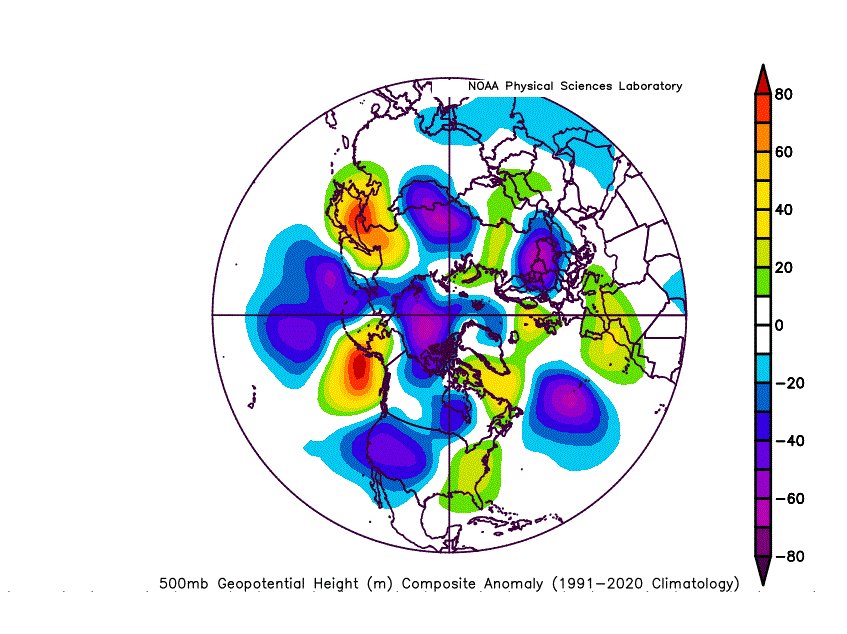
📊 The attached maps summarize the evolving signal.
More diagnostics (geopotential heights, wind anomalies, and vertical structure) are included in the thread.
⚠️ This forecast is probabilistic, not deterministic, based on composite analysis, AI-assisted downscaling, and advanced statistical methods.
Statistical Analog Model
By M. @Statisticizer
Chief Data Scientist — hodhodata.com

29 Aug 2025

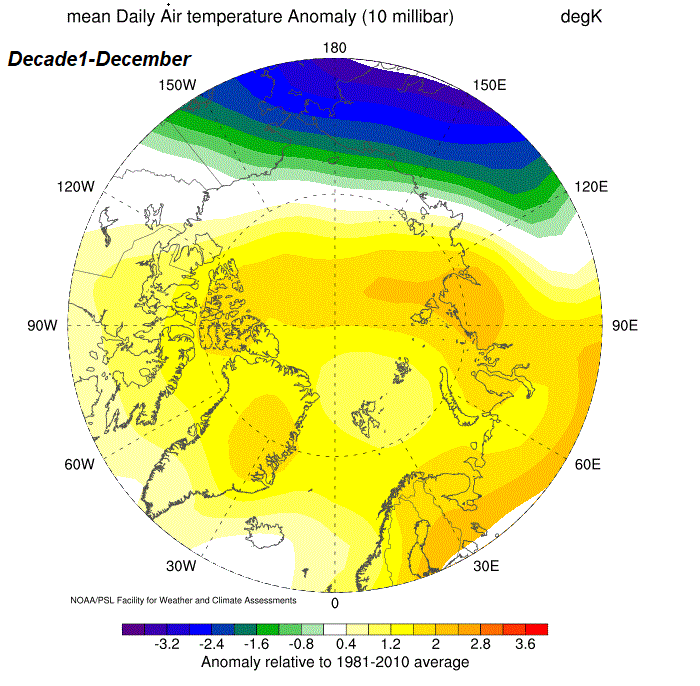
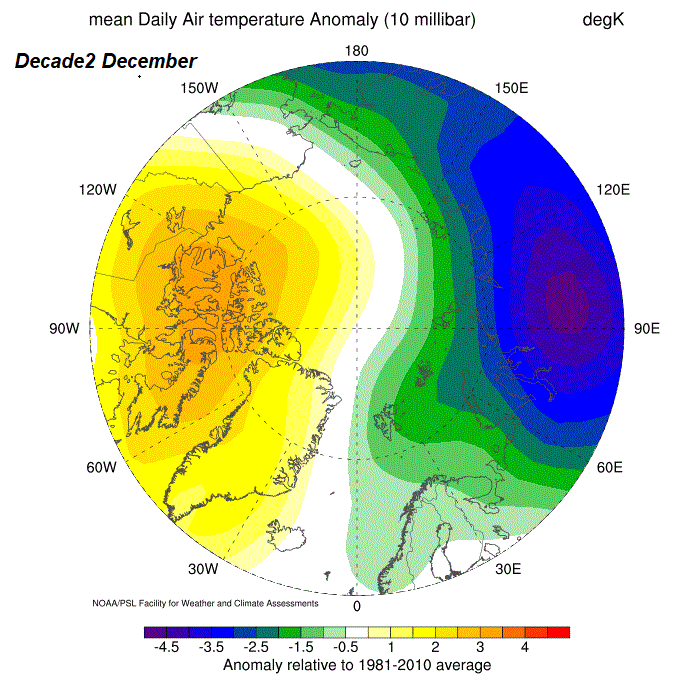
#SSW Polar Vortex Sudden Stratospheric Warming SSW Watch – December 2025 Outlook.
Based on a set of 33 autumn analogs for 2025, the following assessment provides a probabilistic, not deterministic, interim view of stratosphere–troposphere dynamics heading into early winter. Signals at 10 hPa show a marked wave-1 disturbance with strong polar-cap warming beginning in the first December dekad, intensifying sharply into the second dekad (10–21 Dec). The 10hpa Geopotential height anomalies climb over Siberia and Greenland while zonal winds weaken and flip easterly—hallmarks of a major possible polar vortex displacement-type SSW. By late December, the cold pool shifts toward Asia, confirming the vortex may will be pushed off the pole rather than a polar vortex split .
At 500 hPa, tropospheric coupling may begin to emerge: early December favors troughing across the North Atlantic and eastern North America, see comments section, followed by deeper negative heights over Canada and Greenland by mid-month, and a pronounced low-height center over Hudson Bay by late December.
This evolution suggests colder, stormier conditions may prevail for central and eastern North America, while Europe trends toward ridging and relative mildness, especially in the east and southeast.
In summary, the analogs point to a high probability of an early Polar Sudden Stratospheric Warming SSW onset around mid-December 2025, with downward influence most likely to manifest more fully in late December into January . This outlook remains interim and probabilistic, but the early-season disruption of the polar vortex is a key feature to watch closely.


4
4
22
1,208
Rossby-Wave Train possible event near the end of second decade and the final decade of November-2026. These analyses remain probabilistic Not deterministic .

1
8
125
The combined zonal wind deceleration, geopotential height anomalies at 30–100 hPa, and coherent vertical wave structure support a strongly disturbed polar vortex regime in late November, with a high likelihood of displacement and meaningful troposphere–stratosphere coupling. However, current diagnostics remain insufficient to confirm a full major SSW event, pending evidence of zonal wind reversal at 10 hPa near 60°N when we approach early November.


1
4
164
Hodhodata@statistics retweeted
👇Based on statistical modelling, the odds of Lanina is higher next year, although this is tentative. x.com/Statisticizer/status/2…
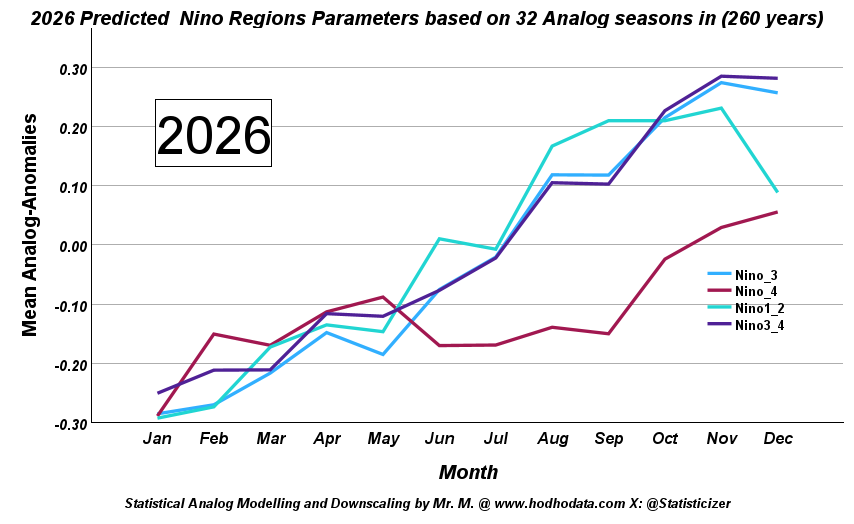
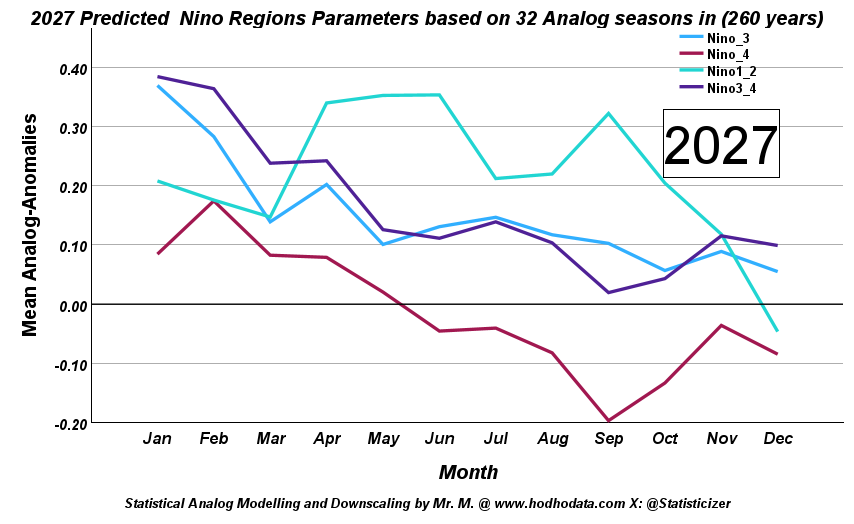
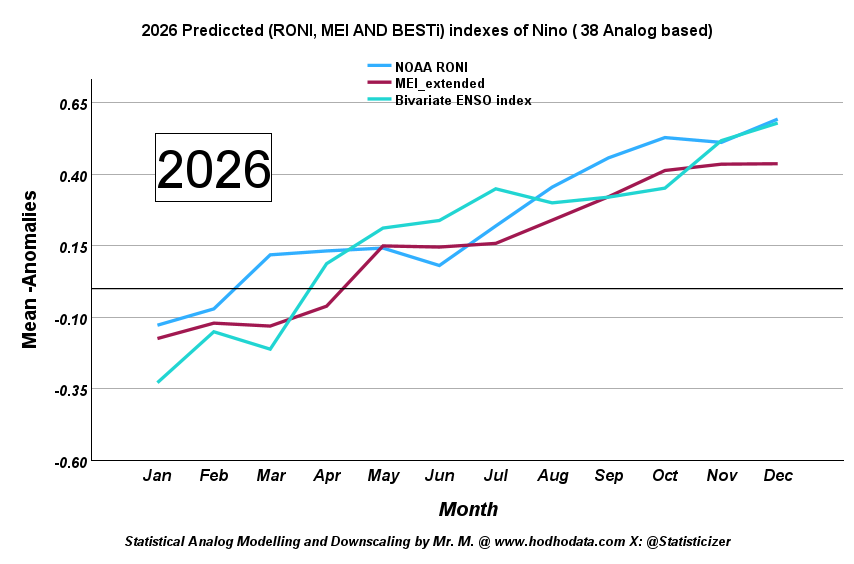
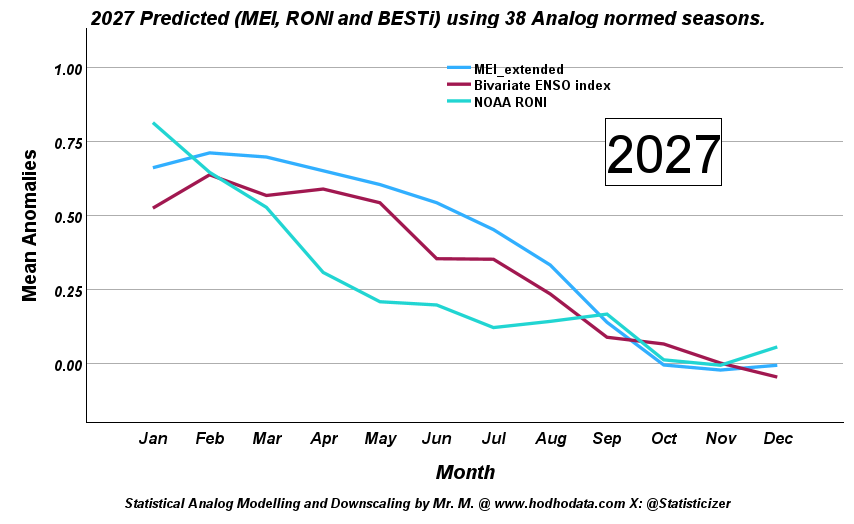
⚡️🌍 ENSO 2026–2027 Outlook — Analog based analysis vs “Super El Niño” Narrative.
Lately there’s been a lot of noise on social media about a possible “super El Niño” developing, linked to panic and fear from heat waves, droughts and famines . I understand where that excitement comes from—ENSO always draws attention—but after digging deeply into the data, I think the situation is possibly being overstated.
I’ve been working on a reconstructed ENSO framework that extends beyond the modern record, using ~260–280 years of analog conditions, adjusted for today’s warmer climate background . The approach combines analog matching, clustering, latent factor and growth modeling, and machine learning, all within a physically constrained setup that links oceanic, atmospheric, and external forcings via Granger-Causality Analytic framework .
So instead of relying on one index or short-term signals, this is more of a trajectory-based view of ENSO evolution using 38 ensembles .
📊 What the signal actually suggests
🔹 2026 — A gradual, structured El Niño
The system starts off weak, then moves into positive territory around late spring, and continues strengthening through the year, peaking toward October–December.
But here’s the key point:
The amplitude is moderate, not extreme
Several indicators don’t even reach Modoki thresholds (~0.5) until maybe autumn.
The structure looks more basin-wide than sharply central-Pacific driven
In plain terms, this doesn’t behave like a “super El Niño.” It looks more like a well-organized moderate to strong but controlled event.
🔹 2027 — A slow fade, not a flip
Going into 2027, the system doesn’t crash or reverse aggressively.
Instead: Residual warmth lingers early in the year
Then a gradual weakening takes over
By late 2027, most signals are back near neutral
There’s no strong evidence here for a rapid La Niña transition, at least from this analog perspective.
⚖️ Putting it into context
If this were truly heading toward a super El Niño, we would expect:
Stronger and more synchronized peaks across indices even during summer months
Clear and sustained threshold exceedance
A more aggressive coupling between ocean and atmosphere
That’s simply not what the data is showing right now .
🌐 Why this matters
ENSO strength and structure shape a lot of downstream impacts.
A moderate event like this still matters—but it behaves differently:
Impacts tend to be more uneven geographically
Teleconnections are present but less extreme
The system shows variability rather than dominance
🧭 My take
If I had to summarize it simply:
➡️ 2026: Moderate El Niño, well-coupled but not too extreme and peaking near November-December , there are no ( No hunger or starvation or heat waves fears ) because the climax would be in Autumn Not summer although there is fast develoment.
➡️ 2027: Gradual decay toward neutral
➡️ No strong support (at this stage) for a “super El Niño” scenario even during summer.
Forecasting ENSO is never about certainty—it’s about probabilities and structure.
And from what I’m seeing, this is a coherent, physically consistent signal… just not an extreme one.
In this analysis the Spring-predictability barrier had been constrained to allow smoothed parameters . Also, the modern super-Nino's were considered as a background possible scenario ( total = 6-8 seasons in last 175 years that I could pinpoint )
—
Statistical Modelling By Mr. M the chief data scientist at Hodhodata.com | @Statisticizer
1
4
15
1,269
Hodhodata@statistics retweeted
العالم لا يحترم الضعف والاستكانة. نحن نعيش في عالمٍ لا يُصان فيه العدل إلا بامتلاك القوة والقدرة على ردع الظلم، لا بالاكتفاء بالشعارات أو التمنيات. فالاستكانة في هذا الزمن قد تتحول إلى دعوة مفتوحة للاعتداء والتجاوز على الحقوق.
من هنا، فإن دعوة من سمو الأمير إلى بناء حلف عربي عسكري قائم على التطوير والحداثة وتعزيز القدرات الذاتية قد تكون خطوة في الاتجاه الصحيح. فالقوة الرادعة هي التي تحفظ السلام وتمنح الدبلوماسية وزنها وتأثيرها، ثم يأتي الحوار والتفاهم من موقع الندية والاحترام المتبادل.
تحية احترام وتقدير لسمو الأمير.
1
6
1,181
#AMOC #ColdBlob
Not only that, but the analog-based forecast of Atlantic Subpolar Gyre SST anomalies for the remainder of 2026 suggests that the recent attention surrounding the North Atlantic "cold blob" is not unexpected.
Given the current multivariable climate background—including evolving ENSO conditions, solar variability, volcanic forcing, oceanic processes, and other atmospheric factors incorporated into the latent growth modelling framework—a cooling tendency in both the Atlantic and Pacific Subpolar Gyres was anticipated. Much of the discussion has focused on the Atlantic, but the Pacific Subpolar Gyre may also develop a colder "#blob" during the remainder of the year, albeit with a temporal lag relative to the Atlantic.
The appearance of these cooling and warming SST blobs may also be linked to longer-term ocean–atmosphere variability associated with the Jupiter–Saturn (J-S) synodic cycle and, potentially, Solar System barycentric dynamics. While the physical mechanisms remain an area of ongoing investigation, the statistical relationships appear sufficiently recurrent to warrant further study. A post explaining Jovian planets convergences on the Subpolar Gyre is added as a link in the first comments.
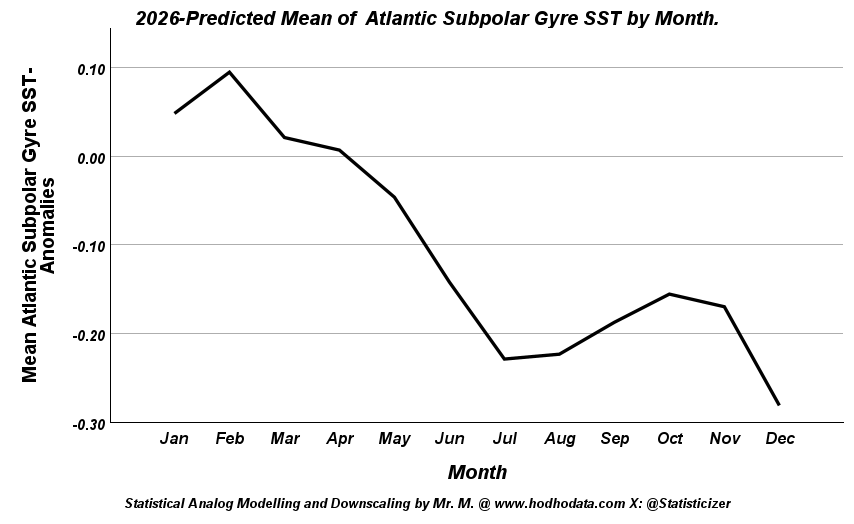
The attached forecast indicates a gradual cooling of the North Atlantic Subpolar Gyre from approximately April through August, followed by a temporary rebound during early autumn, potentially peaking around September–October before cooling resumes later in the year.
In other words, the recent emergence of cooler SST anomalies in the North Atlantic is broadly consistent with the expected seasonal evolution of the Subpolar Gyre and does not represent an unforeseen development within the context of this year's climate configuration.
While the exact magnitude and timing may vary, the overall tendency toward cooler Subpolar Gyre SSTs through late summer was anticipated by the analog modelling approach.
The attached analysis represents the cumulative probability density forecast for Atlantic Subpolar Gyre SST anomalies through the remainder of 2026. Historically, the Subpolar Gyre often warms sharply around September and can occasionally return to positive anomaly territory during early autumn.
A cold blob is not, by itself, evidence of imminent AMOC collapse; it is one component of a much broader ocean–atmosphere system that must be evaluated within the context of long-term variability, background climate conditions, and other relevant indicators.
Statistical Modelling and climatic downscaling by @Statisticizer.
The Subpolar Atlantic cold blob is not unprecedented. Similar-and often colder-events have occurred dozens of times during the past 170 years, under much cooler ocean conditions than today, without any evidence of an AMOC collapse. A cold blob alone is not proof of a failing AMOC.
5
3
27
4,748
This discussion with @RCutler34 tries to arrive at better understanding on how Jovian planets ( Jupiter-Saturn) associate with the Oceanic SST variability, with no causal inference conclusiveness. x.com/Statisticizer/status/2…
Dear Robert,
Thank you for your input.
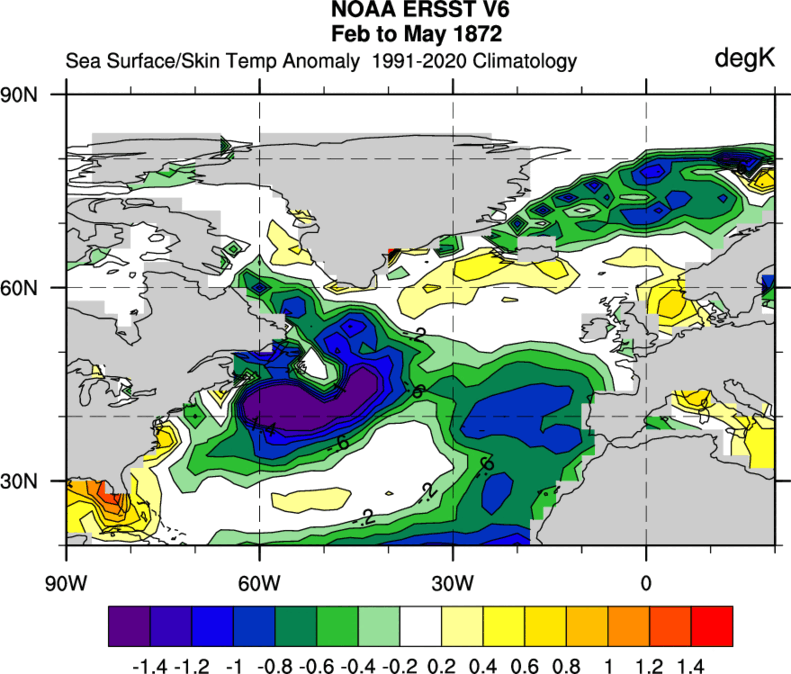
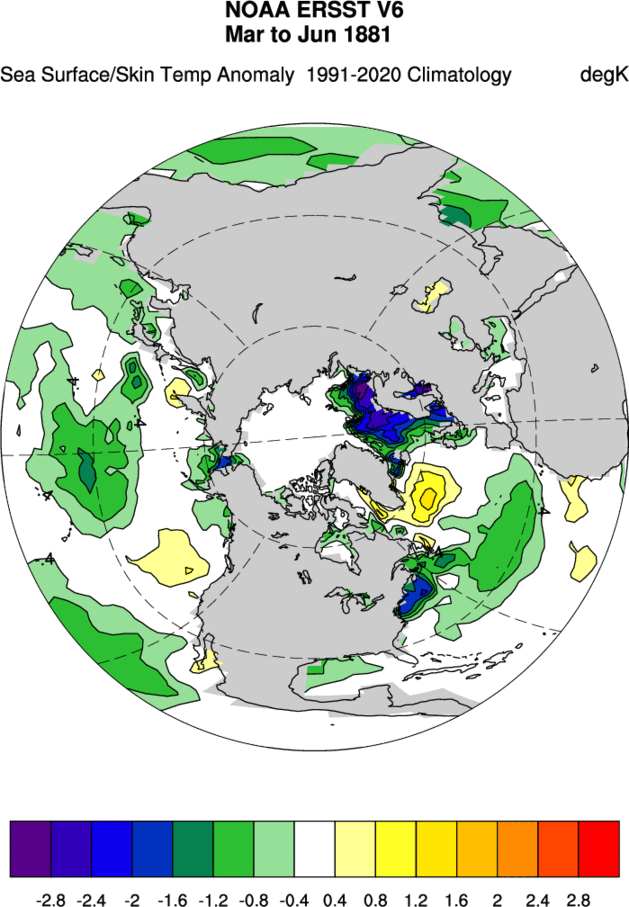
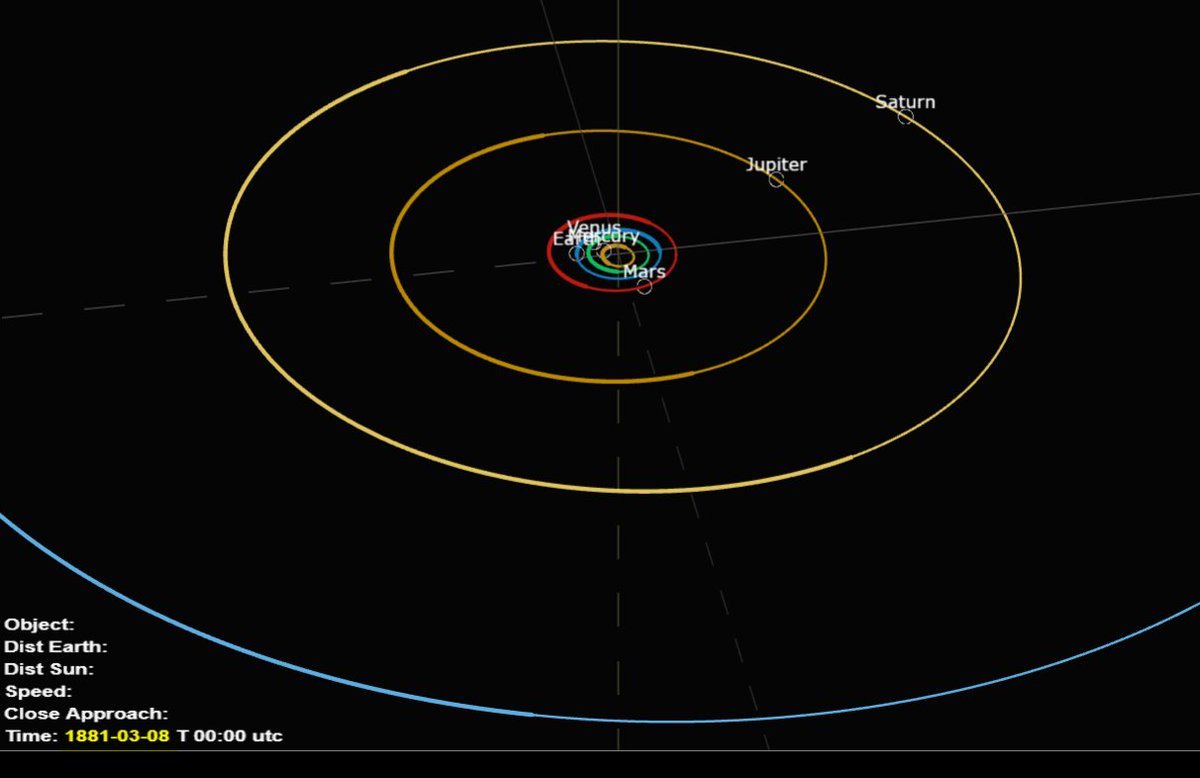
The Jupiter–Saturn conjunction reaches a peak approximately every 20–21 years. The closest alignment typically persists for about 1–3 months as both planets appear nearly aligned relative to the Sun. Since the late 1860s, these synodic peaks have occurred at least eight times: 1881 (May–Jun), 1901 (Oct–Nov), 1921 (Sep–Oct), 1940–1941 (Dec–Jan), 1961 (May–Jun), 1981 (May–Jun), 2000 (Jul–Aug), and 2020–2021 (Dec–Jan).
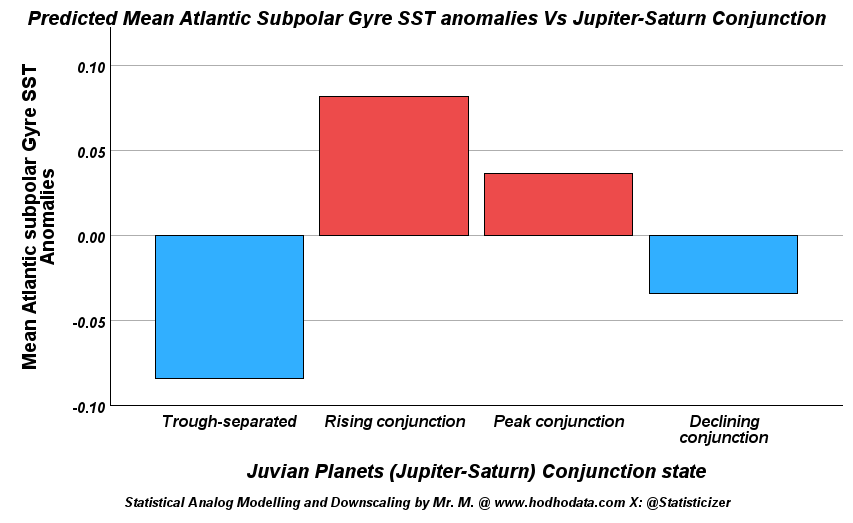
Based on my ephemerides analysis, the conjunction cycle can be broadly divided into a rising phase (~7 years), a peak phase (~1–3 months), a declining phase (~8 years), and a trough period (~6 years).
An interesting feature is that during the rising phase of the Jupiter–Saturn cycle, the Subpolar Gyre SST frequently exhibits substantial warming, often peaking near or shortly before the conjunction maximum. In several cases, the gyre then begins to cool approximately 6–8 months after the conjunction peak, during the declining phase of the cycle.
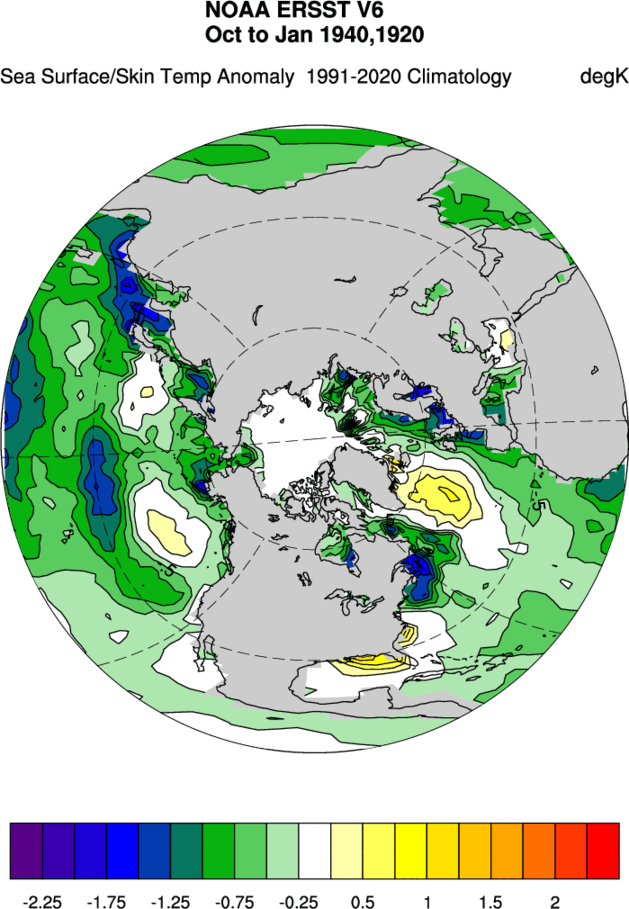
I have attached the 1881 example, when Jupiter and Saturn were fully aligned near May 1881. The corresponding SST anomaly maps show notable warming in the Subpolar Gyre region. Similar spatial patterns appear around the 1921 conjunction (orbital configuration shown in the comments) and again during the 2020–2021 conjunction. Although global ocean temperatures were elevated in 2020–2021, the Subpolar Gyre displayed particularly pronounced positive SST anomalies. Definitely you can try to re-analyze the other calendar conjunction dates, but kindly make sure you test 6 months before peak and 6 after.
Whether these recurring patterns reflect a physical connection or a coincident synchronization remains an open question. However, the repeated appearance of similar SST behavior near multiple Jupiter–Saturn conjunction peaks suggests that the relationship may warrant further investigation rather than being dismissed outright as random chance.
More SST maps and orbital configuration images are provided in the comments replies to this post.
8
1,078
Hodhodata@statistics retweeted
🌍🚨📊 إشارات إنذار مبكر لصيف 2026: مخاطر محتملة للفيضانات مدفوعة بتحرّك نطاق التقارب بين المدارين (ITCZ) و "ارتفاع الفاصل المداري شمالا".
هذا أحد توقعاتي بعيدة المدى المبكرة التي تتعلق بصيف العام الجاري 2026 .
مقدمة سريعة : خلال صيف عام 2023 الماضي، تحرّك نطاق التقارب بين المدارين (ITCZ) شمالًا بدرجة غير اعتيادية، ما أدى إلى فيضانات واسعة في أجزاء كبيرة من الصحراء الكبرى وإفريقيا جنوب الصحراء. سُجّلت أمطار استثنائية في عدة دول، من بينها السودان واليمن، حيث فشلت عدة سدود ومنشآت للتحكم بالفيضانات، وكذلك في تشاد حيث تسببت الفيضانات في تشريد أكثر من 100 ألف شخص—وهي أزمة إنسانية لم تحظَ باهتمام عالمي كافٍ.
ومن اللافت أيضًا أنه خلال تلك الفترة عادت للحياة واحاتٌ وبحيراتٌ صحراوية كانت قد جفّت منذ 30–40 عامًا، وتبع ذلك ازدياد واضح في غزوات الجراد في إفريقيا.و هذا موثق ايضا في حسابي من سنتين . كثير من الحسابات المعروفة بتوقع الطقس وصفت الحدث انه غير مسبوق و الواقع الاصح انه حدث طبيعي متكرر . عملي كاحصائي يتركز في اعادة بناء النمط و احتمالات تكراره .
الامر #الجديد:
🟢 تشير التحليلات التجميعية الجديدة لعام 2026 إلى احتمال تكرار هذا النمط خلال صيف العام القادم.
تُظهر خرائط شذوذ الهطول JAS (يوليو–سبتمبر) المرفقة امتدادًا شماليًا متجددًا لـ ITCZ وتعاظم نقل الرطوبة الموسمية خلال يونيو–أكتوبر 2026، مع ذروة للمخاطر بين يوليو وسبتمبر.
وتُبرز التظليلات الخضراء المناطق التي قد تشهد هطولًا أعلى من المعدل الطبيعي وارتفاعًا في مخاطر الفيضانات، ما قد يقود إلى آثار هيدرولوجية شديدة، خاصةً عند تزامنها مع ضعف البنية التحتية أو تشبّع التربة أو الجريان السطحي السريع.
📌 المناطق والدول التي تُظهر شذوذات إيجابية ملحوظة في الهطول تشمل:
#السودان
#جنوب_السودان
#تشاد
#النيجر
#نيجيريا
#مالي
#موريتانيا، #ليبيا، وجنوب #الجزائر و#المغرب
#إثيوبيا
#إريتريا
#اليمن
#السعودية (الجنوب الغربي)
#الساحل_الإفريقي
#القرن_الإفريقي
#غرب_إفريقيا
تشير هذه الإشارات إلى ارتفاع احتمالية حدوث نوبات أمطار غزيرة وفيضانات خاطفة وفيضانات نهرية خلال صيف وبداية خريف 2026.
➡️ سأواصل مراقبة هذه المخاطر وتحديثها عبر توقعات مُحسّنة خلال ربيع 2026، مع التركيز على التأثيرات الإقليمية واحتمالات الفيضانات وإشارات الإنذار المبكر مع تزايد وضوح العوامل الموسمية. و الله اعلم .
—
@Statisticizer
🌍📊


8
9
42
10,174
Hodhodata@statistics retweeted

Jun 10
*الثلث الأخير من الشهر يبدأ إضمحلال وضعف الموجات العلوية والتيار النفاث الغربي في البحر المتوسط، معه تبدأ سيادة الأنماط الطبيعية صيفا.
*يبتعد مرتفع جنوب الجزيرة غربا من الجزيرة العربية في مكانه الطبيعي صيفا في يونيو ويوليو معه يبدأ التيار الشرقي في السيادة جنوب الجزيرة العربية مرتفعات سلطنة عمان واليمن وجنوب غرب السعودية؛ ويتوقع إمتداد الأمطار الموسمية لباكستان وشرق بحر عمان.
*فرص ظهور موجة تكونات لجبال الحجر قد تكون جيدة أواخر الشهر بإذن الله.

14
19
131
20,139
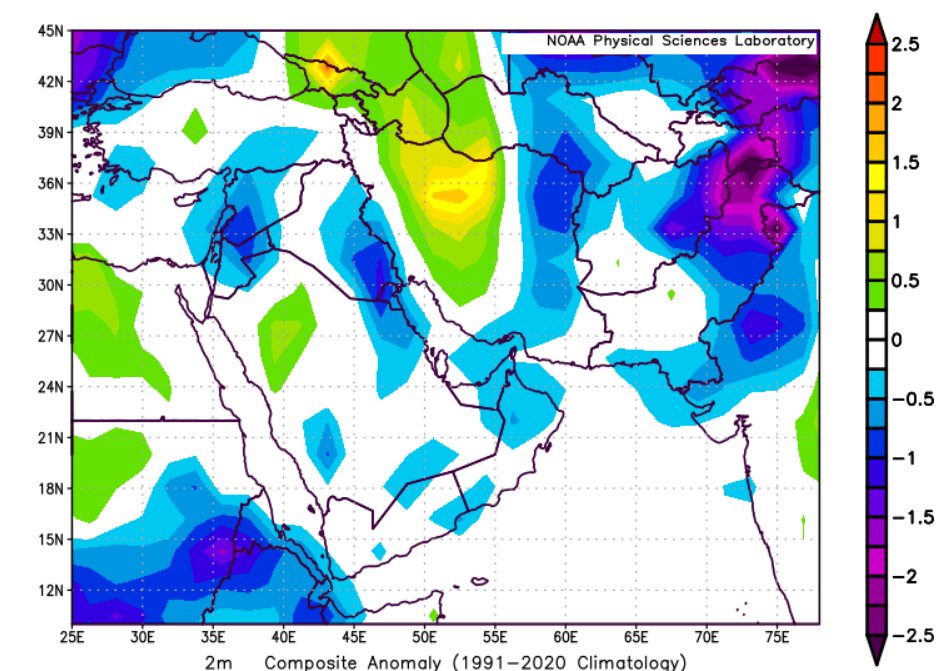
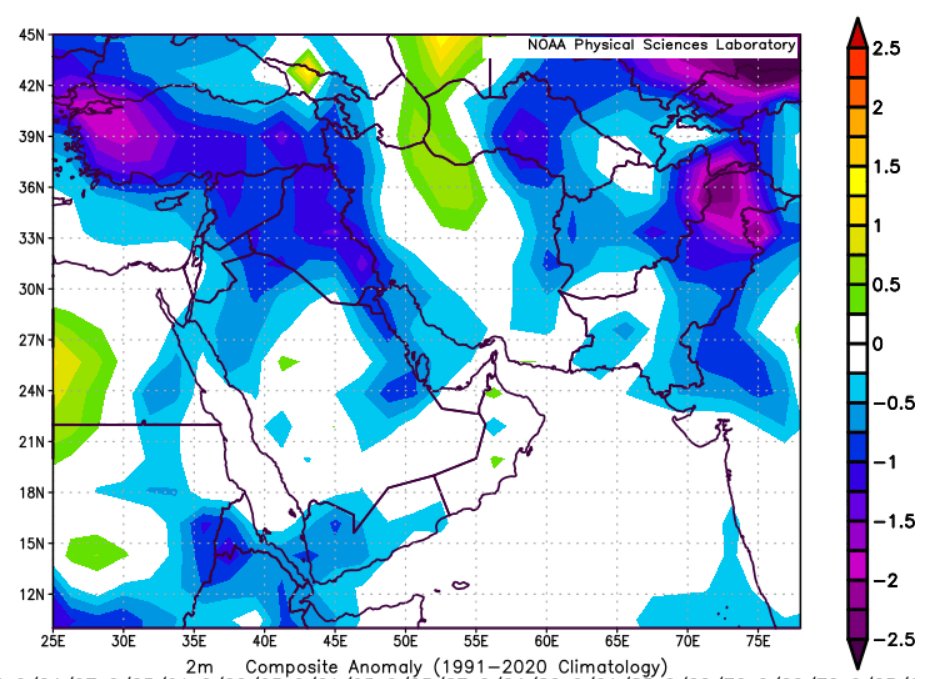
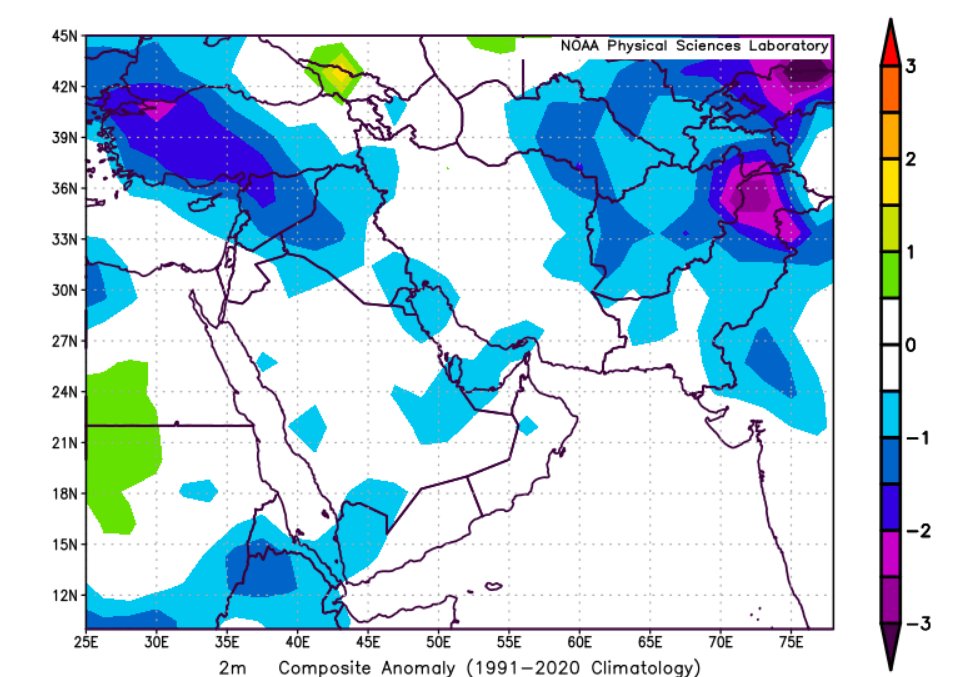
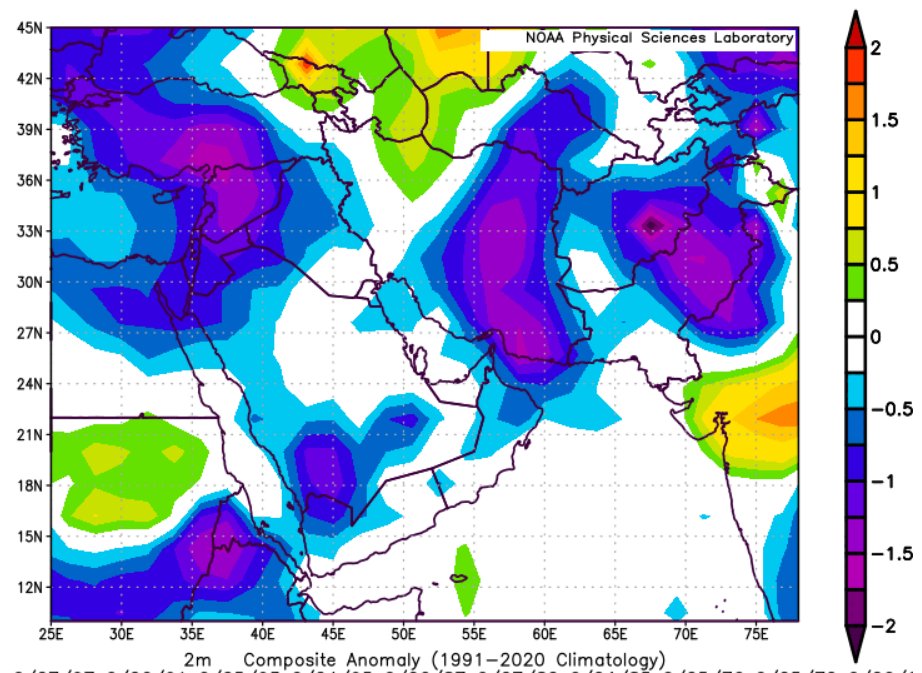
#الشرق_الأوسط
توقعات #درجات #الحرارة بالثلث الاخير من الشهر الحالي:
بين 19-30 يونيو .
محتمل تعمّق كتلة هوائية أبرد من المعتاد عبر منطقة الأناضول باتجاه بلاد الشام وشمال الجزيرة العربية خلال الثلث الأخير من الشهر الجاري، يرافقها تباين ملحوظ بين درجات الحرارة النهارية والليلية، مع ميل الأجواء نحو الاعتدال في أجزاء واسعة من الجزيرة العربية، بما في ذلك مناطق من جنوبها.
في الخرائط المرفقة و هي عينة متحركة لمعدلات الحرارة عند مستوى 2 متر الارشيفية ضمن الثلث الاخير من يو نيو, اللون الازرق يشي بميل الاجواء للاعتدال و البرودة ربما ليلا .
تباين الحرارة بين النهار و الليل يساعد بتفريغ المحتوى الحراري الكامن ضمن المباني و يساعد بتقليل احتمالات تشكل موجات الحر ضمن المدى الاسبوعي .
ومن المتوقع أن تسبق هذه الحالة فترة أكثر حرارة نسبياً خلال الثلث الثاني من الشهر، خاصةً في مصر وجنوب بلاد الشام (الأردن وفلسطين) بالتزامن مع فترة منتصف الشهر. ومع بداية الثلث الأخير، قد تميل الأجواء إلى الاعتدال، وربما البرودة النسبية، في وسط تركيا وسوريا وشمال بلاد الشام، قبل أن يمتد تأثير الاعتدال تدريجياً نحو شمال وجنوب وجنوب شرق الجزيرة العربية لاحقاً.
والله أعلم.
📌 هذه النشرة احتمالية ليست حتمية يفضل مقارنتها بنماذج توقع الطقس التشغيلية GFS & ECWMF قرب نهاية الشهر ،
تم إعدادها الجزء الحسابي باستخدام تطبيقات الإحصاء والذكاء الاصطناعي من قبل كبير المبرمجين والإحصائيين السيد محمد الخطيب، عبر منصة الهدهد للخدمات الإحصائية والبحوث .
🌐 hodhodata.com
3
17
105
19,651
🚨⚡️#Shiveluch #Volcano in Kamchatka-Russia has erupted twice within the last 48 hours, with both eruptions reaching near-stratospheric altitudes. Will such volcanic activity affect our next Autumn and Winter weather?
The short answer is: Yes, that is plausible.
But , Why and How?
Several reasons. Although Kamchatka is located in the mid-latitudes rather than the tropics, such major eruptions may still exert a measurable influence on the terrestrial climate for several reasons:
a) Both eruptions were powerful enough to inject substantial amounts of ash and aerosols into the upper troposphere and near the stratosphere. Successive eruptions can produce cumulative climatic effects. Notably, the major Ethiopian eruption of late 2025 (Lyo Gobi/Hayli Gubbi), which reportedly lofted material to nearly 30 km altitude, occurred only a few months ago ( November 2025) .
b) The climatic imprint of such substantive eruptions (with VEI >=4 )may persist for at least 24 months. Their weather impact usually appears( as cooling) in less than 6-8 weeks.
c) Volcanic eruptions occurring east of major continental landmasses can, under certain atmospheric configurations, exert a climatic forcing comparable to some equatorial eruptions. Additionally, the stratosphere is lower in the mid-latitudes than in the tropics, making stratospheric injection more attainable for sufficiently explosive eruptions.
d) Published scientific evidence suggests that major volcanic eruptions occurring near, or shortly before, the middle of the year often have a greater likelihood of influencing the subsequent winter season through their impacts on atmospheric circulation. To me, the timing of those substantive volcanic eruptions ( Just around mid-year ) adds extra weight to their possible impact on next winter more than the other reasons.
e) We do Not know what other eruptions are coming ahead the coming few months, the more of those VEI=4 eruptions we get the greater the cumulative effect on the terrestrial weather.
A tentative conclusion is that we had the three substantive eruptions observed during the past seven months may collectively influence the upcoming winter, regional cooling in the NH is possible for some parts of Europe and Asia . One plausible pathway is through modifications to large-scale atmospheric circulation patterns, including effects on the Walker Circulation and related teleconnection systems. Impact differs from region to another, no fixed cooling impact across land.
The Video was copied from @StefanBurnsGeo .
#VolcanicForcing #VolcanicEruption #ClimateImpact #VolcanoClimate #StratosphericAerosols #AtmosphericScience #Shiveluch #Kamchatka #WalkerCirculation #ClimateVariability #Volcanology #WinterForecast🚨⚡️
1
9
23
4,684
Hodhodata@statistics retweeted

El concepto de "ríos atmosféricos sobrecargados" y cómo la física de la atmósfera puede generar las condiciones perfectas para catástrofes hidrológicas (Valencia-Grazalema):
🌋 El volcán Titan Ridge (en Papúa Nueva Guinea) es increíblemente clave. Su erupción inyecta enormes columnas de vapor de agua y gases térmicos al Pacífico Occidental, sumándose al enorme reservorio de humedad residual que el Hunga Tonga dejó en la alta atmósfera.
Para entender cómo esto se traduce en desastres como las históricas e intensas lluvias torrenciales (como las inundaciones por DANA en España de octubre de 2024), la clave está en ver la atmósfera como una gran "fábrica de lluvia" donde los volcanes ponen la materia prima y los detonantes.
1. La "Materia Prima": Clausius-Clapeyron potenciado
La física básica nos dice (por la ecuación de Clausius-Clapeyron) que por cada grado Celsius que se calienta la atmósfera, esta puede retener aproximadamente un 7% más de vapor de agua.
• El rol del Titan Ridge y Hunga Tonga: Al inyectar toneladas de vapor de agua en las capas altas y calentar la atmósfera media por efecto invernadero, rompen el récord de "Agua Precipitable Total" (PWAT) disponible en el aire. La atmósfera se convierte en una esponja gigantesca sumamente cargada.
2. Los Aerosoles del Shiveluch como "Semillas" (Núcleos de Condensación)
Para que el vapor de agua se convierta en gotas de lluvia, necesita una superficie física sobre la que condensarse. Aquí es donde entran los aerosoles de sulfato del Shiveluch y los volcanes continentales.
• Física de nubes: El azufre (SO_2) inyectado se transforma en aerosoles de ácido sulfúrico. Aunque en la estratosfera reflejan la luz, las partículas que logran descender a la troposfera superior actúan como núcleos de condensación de nubes (CCN) de una eficiencia tremenda.
• El efecto "semilla": Tienes una atmósfera con niveles de humedad sin precedentes (gracias a los volcanes submarinos) y, al mismo tiempo, la estás sembrando con miles de millones de partículas microscópicas listas para aglutinar esa humedad.
3. Los Puntos de Convergencia: El Disparador
Tener la esponja cargada y las semillas listas no es suficiente; necesitas un mecanismo que "exprima" la esponja. Ahí es donde entra la dinámica de circulación analizada por amplia literatura científica y que detonó los desastres de 2024:
1. Bloqueo Atmosférico
Ondas de Rossby amplificadas
El enfriamiento del norte por el Shiveluch deforma la corriente en chorro (jet stream), haciendo que se curve de forma pronunciada. Esto genera "bloqueos", aislando masas de aire frío en latitudes medias (como las DANAs o gotas frías).
2. Atracción del Río Atmosférico
Efecto bomba de humedad
Esta perturbación de aire frío actúa como un gigantesco engranaje que succiona el aire tropical y subtropical del océano, el cual está mucho más caliente y cargado de vapor debido al forzamiento de los volcanes submarinos.
3. Condensación Explosiva
Microfísica de nubes
Al chocar el río atmosférico (cargado de agua) contra el aire frío y ascender bruscamente, se encuentra con las masas de aerosoles volcánicos. La condensación ocurre a una velocidad e intensidad brutales.
El Paralelo con Octubre de 2024:
Lo que ocurrió en octubre de 2024 (donde el Mediterráneo batió récords de temperatura marina y la atmósfera global venía alterada por la inyección térmica de años anteriores) es el ejemplo perfecto de este peligro.
Cuando un sistema de baja presión se estaciona y logra conectarse con una atmósfera sobrecargada de humedad, la precipitación ya no es una tormenta normal: se convierte en un sistema convectivo de escala mesocosmática (tren de tormentas). Las nubes se regeneran en el mismo punto una y otra vez porque la atmósfera tiene un suministro infinito de vapor de agua para alimentar el sistema.
------------------
El caso de Grazalema (en la Sierra de Cádiz, España) durante el pasado invierno de 2025/2026 es el laboratorio perfecto en el mundo real de todo lo que acabamos de exponer.
Para ponerlo en contexto geográfico, Grazalema es tradicionalmente uno de los puntos más lluviosos de la Península Ibérica debido a la orografía: cuando los vientos húmedos del Atlántico entran por el Golfo de Cádiz, chocan contra esa sierra, se ven obligados a ascender bruscamente (efecto retroalimentado por el relieve) y descargan con una fuerza brutal.
Pero lo que ocurrió en este último invierno de 2025/2026 superó los límites climáticos habituales debido, precisamente, a los ingredientes globales que describimos:
La Anatomía del Desastre en Grazalema (Invierno 2025/2026)
1. El Río Atmosférico "Submarino":
El Atlántico subtropical estaba inusualmente cálido, alimentado por el forzamiento de gases de efecto invernadero y el exceso de vapor de agua residual en la alta atmósfera (ese pulso global del Hunga Tonga y las emisiones continuas de los volcanes submarinos). Esto creó "autopistas" de humedad (ríos atmosféricos) con índices de Agua Precipitable Total (PWAT) nunca antes vistos para la época invernal.
2. El Bloqueo y el Semillero
Tal y como analizamos, la inyección de aerosoles de los volcanes del norte (como el Shiveluch y el Hayli Gubbi a finales de 2025) alteró el gradiente térmico de la estratosfera, ayudando a debilitar el vórtice polar y a ondular la corriente en chorro.
• Esto provocó que las borrascas atlánticas bajaran mucho más de latitud de lo normal, apuntando directamente hacia el sur de España.
• Al mismo tiempo, los aerosoles microscópicos en suspensión actuaron como esos núcleos de condensación (CCN) ultraeficientes.
3. El Efecto "Expresor" Orográfico
Cuando ese río atmosférico sobrecargado de humedad y "sembrado" de aerosoles impactó contra la Sierra de Grazalema, el ascenso forzado del aire no provocó una lluvia normal. La microfísica de las nubes estaba tan alterada que la eficiencia de la precipitación fue máxima: el agua condensaba y caía de forma masiva y continua, generando acumulados de lluvia en pocos días que normalmente tomarían meses en registrarse.
El Patrón se Repite
> Lo de Grazalema en el invierno de 2025/2026 fue la demostración práctica de que el clima global está interconectado. Un volcán en el Pacífico y otro en Kamchatka pueden alterar la densidad y la trayectoria de una tormenta que termina descargando con una violencia histórica en un pueblo de la sierra gaditana.
Este precedente es precisamente el que tiene a los meteorólogos en alerta máxima para las próximas estaciones. Las piezas del rompecabezas atmosférico (humedad extrema en capas altas y perturbaciones por aerosoles) siguen estando activas y moviéndose por el tablero planetario.
🚨⚡️#Shiveluch #Volcano in Kamchatka-Russia has erupted twice within the last 48 hours, with both eruptions reaching near-stratospheric altitudes. Will such volcanic activity affect our next Autumn and Winter weather?
The short answer is: Yes, that is plausible.
But , Why and How?
Several reasons. Although Kamchatka is located in the mid-latitudes rather than the tropics, such major eruptions may still exert a measurable influence on the terrestrial climate for several reasons:
a) Both eruptions were powerful enough to inject substantial amounts of ash and aerosols into the upper troposphere and near the stratosphere. Successive eruptions can produce cumulative climatic effects. Notably, the major Ethiopian eruption of late 2025 (Lyo Gobi/Hayli Gubbi), which reportedly lofted material to nearly 30 km altitude, occurred only a few months ago ( November 2025) .
b) The climatic imprint of such substantive eruptions (with VEI >=4 )may persist for at least 24 months. Their weather impact usually appears( as cooling) in less than 6-8 weeks.
c) Volcanic eruptions occurring east of major continental landmasses can, under certain atmospheric configurations, exert a climatic forcing comparable to some equatorial eruptions. Additionally, the stratosphere is lower in the mid-latitudes than in the tropics, making stratospheric injection more attainable for sufficiently explosive eruptions.
d) Published scientific evidence suggests that major volcanic eruptions occurring near, or shortly before, the middle of the year often have a greater likelihood of influencing the subsequent winter season through their impacts on atmospheric circulation. To me, the timing of those substantive volcanic eruptions ( Just around mid-year ) adds extra weight to their possible impact on next winter more than the other reasons.
e) We do Not know what other eruptions are coming ahead the coming few months, the more of those VEI=4 eruptions we get the greater the cumulative effect on the terrestrial weather.
A tentative conclusion is that we had the three substantive eruptions observed during the past seven months may collectively influence the upcoming winter, regional cooling in the NH is possible for some parts of Europe and Asia . One plausible pathway is through modifications to large-scale atmospheric circulation patterns, including effects on the Walker Circulation and related teleconnection systems. Impact differs from region to another, no fixed cooling impact across land.
The Video was copied from @StefanBurnsGeo .
#VolcanicForcing #VolcanicEruption #ClimateImpact #VolcanoClimate #StratosphericAerosols #AtmosphericScience #Shiveluch #Kamchatka #WalkerCirculation #ClimateVariability #Volcanology #WinterForecast🚨⚡️
3
13
32
2,499
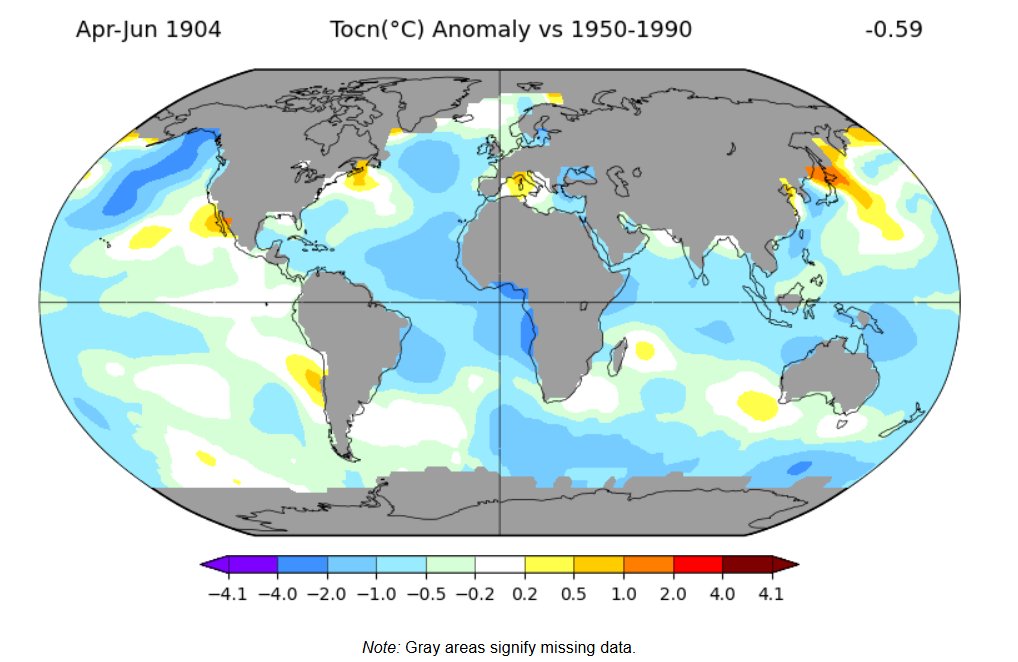
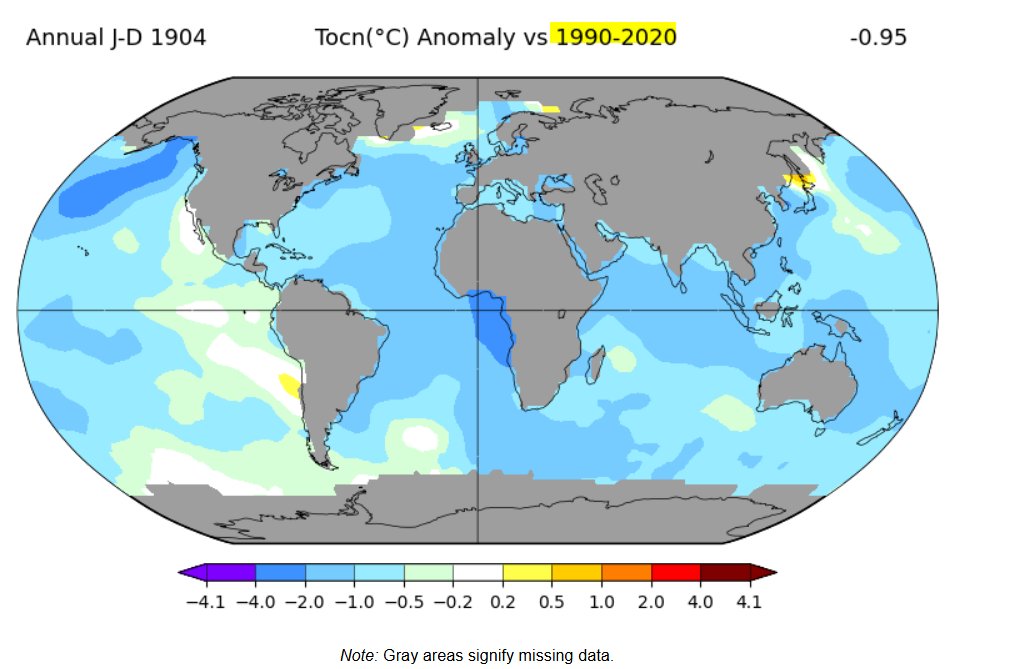
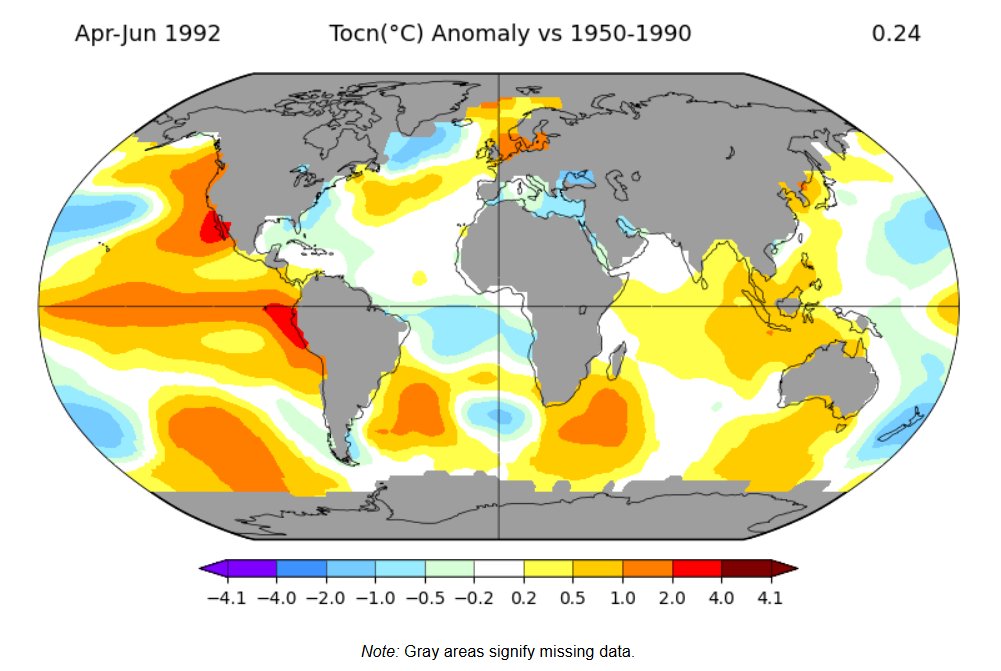
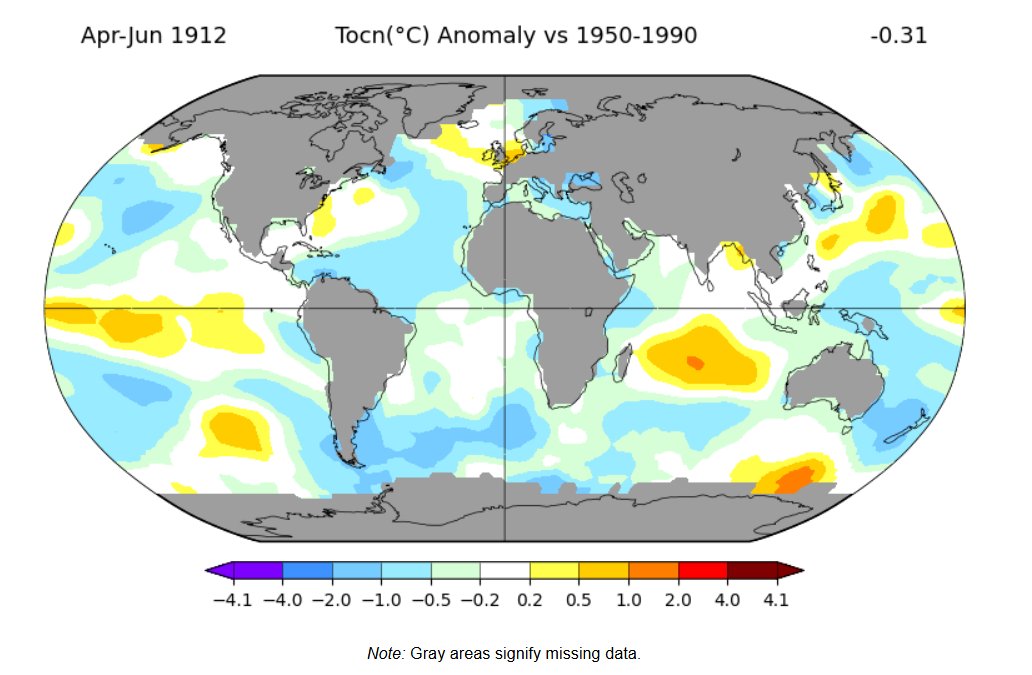
The Subpolar Atlantic cold blob is not unprecedented. Similar-and often colder-events have occurred dozens of times during the past 170 years, under much cooler ocean conditions than today, without any evidence of an AMOC collapse. A cold blob alone is not proof of a failing AMOC.
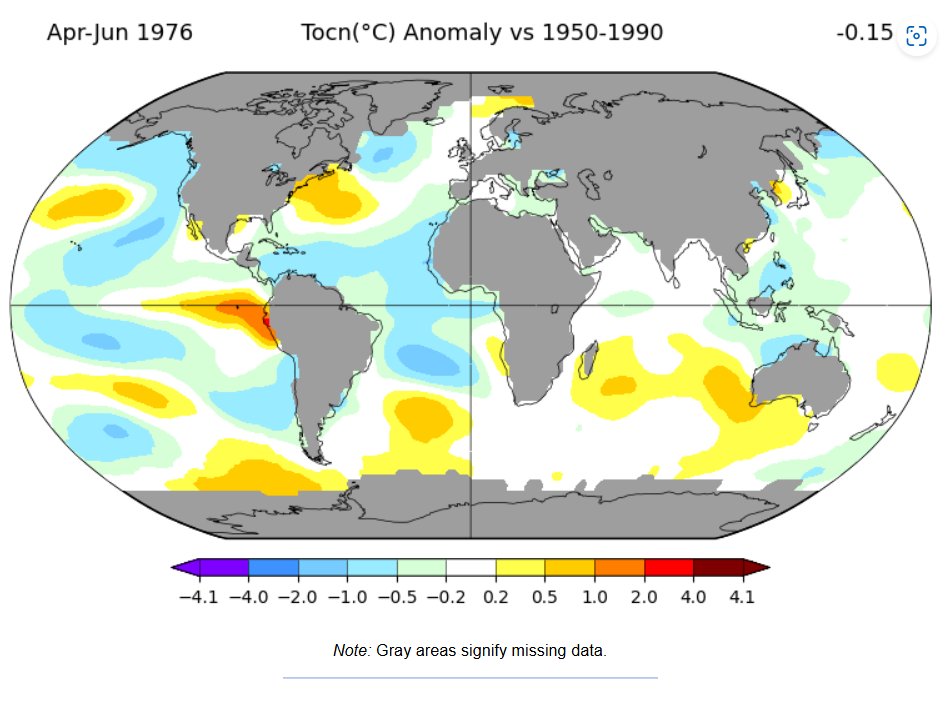
No, I don't think so. The Atlantic Subpolar Gyre has experienced SST anomalies substantially colder than those observed today on numerous occasions between 1870 and 2026.
If the presence of a cold blob alone were sufficient evidence of a weakening or collapsing AMOC, then many of those earlier episodes should also have corresponded to major AMOC weakening events or even reversals-which is not supported by the observational record (at the meantime) . Most of that goes over the social media is (hype)⁹.
The following years rank among the coolest Subpolar Gyre SST states in my analysis (ordered from coolest to less cool): 1904, 1973, 1976, 1992, 1912, 1982, 1974, 1903, 1985, 1987, 1913, 1986, 1984, 1983, 1914, 1977, 1947, 1972, 1922, 1969, 1975, 1994, 2015, 1905, 1920, 1991, 1970, 1872, 1921, 1990, 1968, 1918, 1923, 1884, 1906, 2016, 1930, 1989, 1883, 1882, 1963, 1980, 1943.
A cold Subpolar Gyre may be consistent with a weaker AMOC, but it is not, by itself, definitive proof of AMOC weakening. Other oceanic and atmospheric processes can produce similar SST patterns.
The relationship is more nuanced than often portrayed on social media. attached is few example cold Atlantic subpolar gyre years and the heavens did Not fall to ground.
2
10
47
7,439