
Retired at 39! Investing & Trading/Health & Fitness. In a world of info overload, I show you how to be successful at both through mastering the fundamentals!
Joined April 2009
- Tweets 9,331
- Following 2,316
- Followers 511
- Likes 2,759
137 Photos and videos


Mar 22
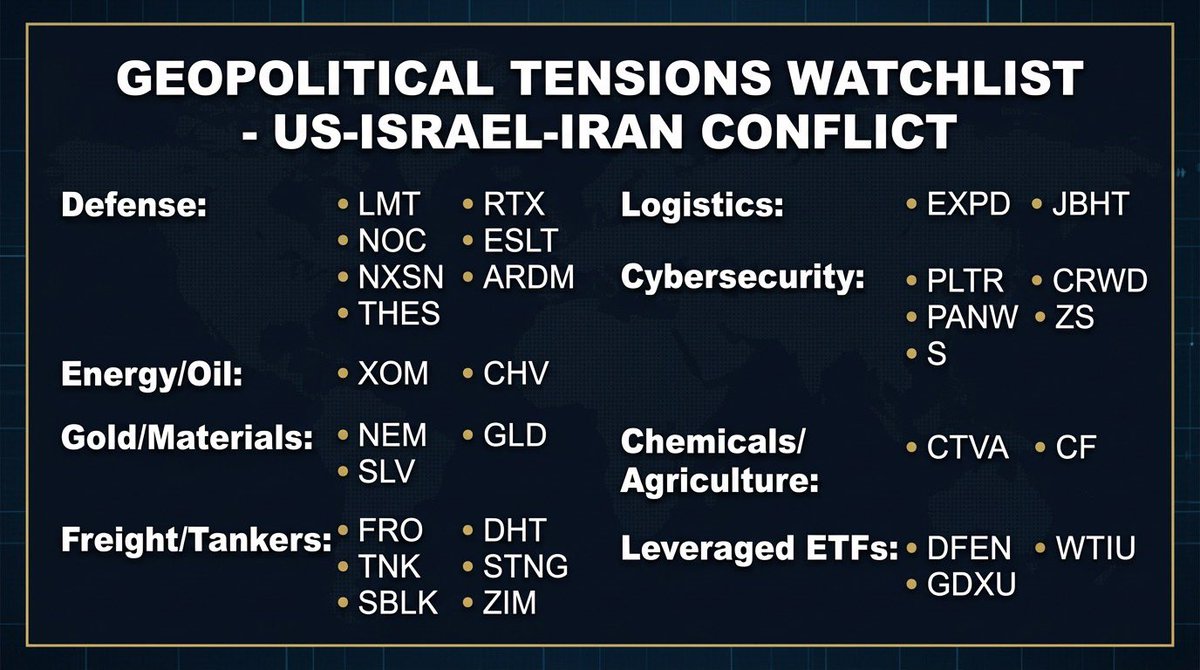
Information analyzed from 150 years of military conflicts to provide an analysis of the current market drawdown in the context of the Iran conflict. We are in the last week of the 28 Day Pivot in which the market usually levels off and/or heads back to previous price points.
Top 7 Critical Market Performance Factors
1️⃣Discounting the "War Premium": Equities frequently undergo their most aggressive price discovery prior to the official commencement of military actions. This phase reflects the market pricing in maximum uncertainty; paradoxically, the transition from threat to "active conflict" often marks the exhaustion of the selling climax. Which the market could be nearing.
2️⃣Mean Reversion of Drawdowns: Statistically, equity markets exhibit a powerful "Mean Reversion" tendency following geopolitical shocks. In the post-WWII era, the S&P 500 has historically bottomed at an average drawdown of 5.1% to 6.2%. Because the market tends to "overshoot" on the downside during the initial panic, this technical detachment from fundamental value creates a coiled-spring effect, historically leading to a rapid recovery to the pre-conflict mean within a single quarter!
3️⃣Energy-Induced Compression: Unlike localized land wars, conflicts in the Persian Gulf introduce cost-push inflation variables. Until energy volatility (implied by the VIX and oil futures) stabilizes, the broader index may trade in a correlated risk-off pattern. Meaning investors are collectively pulling money out of risky assets and hiding it in safe havens due to fear or uncertainty.
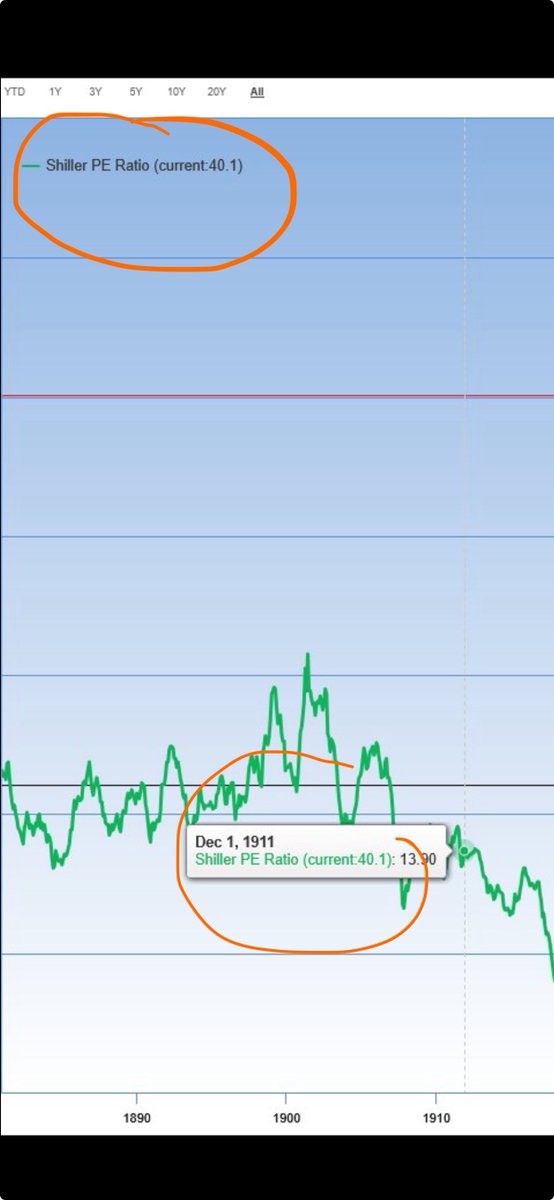
4️⃣The 150-Year Total Return Profile: Continuous observation of 150 years of market data indicates that military action rarely impairs the long-term secular bull trend. Market participants who maintain a total return perspective generally find that equity valuations are higher 12 months after the very first military action over 73% of historical cases.
5️⃣Sector Rotational Alpha: During active combat phases, there is a predictable "flight to quality" and defense-specific capital allocation. Defense stocks (Lockheed, Raytheon, Northrop) often move up where they trade at an inverse correlation to the broader S&P 500, which is usually moving downward.
6️⃣Safe-Haven Mean Reversion: Assets such as Gold, the USD, and US Treasuries typically experience an immediate "Fear Spike." However, historical data suggests these assets reach an apex of overvaluation within the first 15–20 trading days, followed by a liquidation phase as capital rotates back into "Risk-On" equity sectors once the conflict parameters are understood. This is happening to these assets a bit sooner this time around.
7️⃣The 28-Day Inflection Point: The Recovery Math suggests that the 28-day mark is a critical statistical pivot! By this point, the market has moved from "Emotional Selling" (Phase 1) to "Valuation Re-Rating" (Phase 2). If the index stabilizes by day 28, it typically signals that the conflict is being treated as an isolated event rather than a systemic threat to the global financial architecture. Im writing this on Day 21! Clock started on Feb 28th.
Now a Technical Analysis:
• Breach of the 200-Day Moving Average (Institutional Pivot): The S&P 500 has definitively crossed below its 200-day Simple Moving Average (SMA). In advanced technical analysis, this is the "line in the sand" that separates a secular bull market from a primary downtrend. The last time the S&P dropped below its 200day moving avg was in March of 2025 because of Trump dishing out tariffs around the world. The S&P fell an additional 16% past its 200day and didn’t jump back above that line for another 2 months, but then one of the greatest market recoveries in history happened. And this was mostly due to sentiment/fear/panic. Sure actual tariff percentages were issued, but it was too soon for any of them to have any impact we would see in hard financial data/stress.
$SPY $SPX $QQQ
5
7
658
Mar 22
One way the market passing the 200day could get worse from a purely technical standpoint is when dropping below this level, it often triggers automated institutional selling and "gamma hedging" by market makers, creating a temporary "liquidity vacuum." Say what?…. Well, Gamma Hedging is a mandatory risk-management process used by Market Makers. When a trader buys a put from a MM, which is a hedge against the market dropping,they take on the risk that the market may drop. To stay "neutral" (not lose money if the market moves), they sell a certain amount of the S&P 500 stock as a hedge. So as the market falls closer & closer to the price of the Put option’s strike price, the risk to the market maker increases exponentially.To stay neutral as the market drops, the market maker is forced to sell more and more stock to offset their growing risk. This can create a vicious cycle called the “liquidity vacuum" because their selling also sends the market lower, traders buy more puts, Market Makers take on the risk, sell more stock and so on and so on. As this happens bids in the markets disappear, leaving a gap where the price can fall almost instantly because there is no one there to catch it, aka “the falling knife”! Also important levels like the 200day moving are hit, lots of automatic selling can happen and “buy bids” are automatically pulled. At this point the market isn't just falling, its searching for the next level of human interaction! This is exactly why Market makers have strict "Risk Limits." If they don't hedge their plays, a 1% market move could cost them hundreds of millions. They don't have the luxury of "waiting for a bounce."
•The CBOE Volatility Index (VIX) is currently trading in the 24-28 range, indicating a high fear. Technically, when the VIX spikes significantly above its 50-day mean during a conflict, the market is effectively "pricing in" a worst-case scenario. For the 28-day pivot recovery math to hold, we need to see the VIX begin to "mean revert" (drop) even if the conflict continues. If peace talks are announced uncertainty drops sharply, so traders rush to unwind hedges and sell options on the S&P 500, which pushes the VIX down quickly—this is the “volatility crush.” This would be good right now. It doesn’t mean the market is recovering, but it would mean part 1 would be happening before that, which is the uncertainty dropping & pressure is easing.
Strategic Convergence: Why the Next 7 Days Are Important!!!
As we sit at Day 20/21 of the conflict, the market is currently in the "Capitulation Window." This is where retail liquidations often peak. Aka panic selling peaks! The next seven days are critical because they represent the transition toward the 28-Day Inflection Point. If the S&P 500 maintains its current support levels despite the ongoing "downslope," it would align with the historical "bottoming" process seen in previous Middle Eastern interventions.
In a military conflict,fear & panic begets uncertainty and that uncertainty begets questions. What the market needs now is answers. Even if those answers are not totally positive but create a sense of certainty, as in a certainty of what's happening next, that can be good for the market and move back up. The masses can stop reacting/fighting the news and start pricing in the end. When this conflict started there were LOTS of stocks that were overvalued and on continuous runs. This conflict was the perfect reason to unwind some of those positions and other over-leveraged or mis-priced risk. Even if the conflict may not be over, hopefully we can look forward to a de-escalation scenario.
3
5
568
Mar 22
In Closing
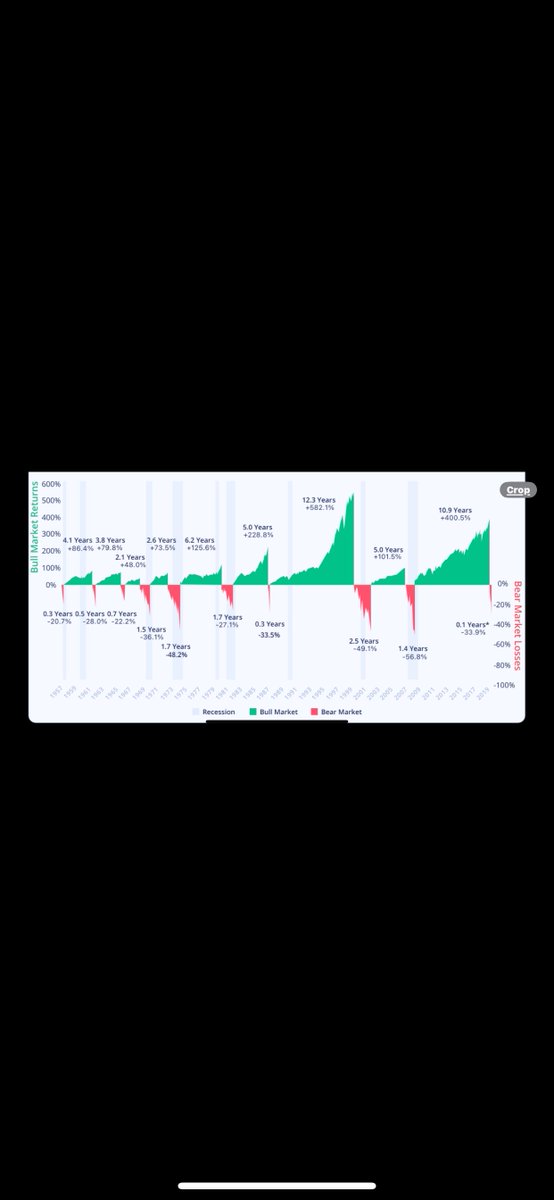
Every major geopolitical situation draws fear & panic & rewrites the short‑term narrative but rarely derails the long‑term trend.
The market may not yet be ready to rally — but it’s ready to listen again. For disciplined investors, this is the moment to watch positioning — not panic. History teaches that markets ultimately reprice fear faster than fundamentals deteriorate. As we approach the 28‑Day Inflection Point, investors aren’t just testing support levels — they’re testing conviction.
1
4
352


Mar 3
Military conflict/wars have always been a positive for the market. Why?…..It’s good for business.
• Increased Government Spending
• Resolution of Uncertainty
• Technological Innovation
• Monetary Stimulus/Low Interest Rates
• Guaranteed Corporate Contracts
• Increased Commodity Demand
• Heightened Industrial Production
These reasons center on the transition from speculative fear/worry/panic to operational certainty. Markets typically price in the "threat" of war through volatility.
Once conflict begins, the influx of federal capital and the shift to a high-output wartime economy provide a fundamental floor for corporate earnings.
Theres a whole deep dive on this but these are the main reasons why the market benefits from wartime.
#Iran #Israel #StraitOfHormuz
$PLTR $SPY $LMT $DFEN $QQQ $VIX $GLD $NOC $AXON
1
1
332
Mar 1
Some Upcoming Earnings!!
Broadcom $AVGO
- AVGO reports Q1 FY2026 earnings on March 4, 2026, at 4:15 PM ET, with consensus EPS at $2.02 and revenue of $19.27B, up 29.2% YoY.
- Above company guidance of $19.10B revenue; 80.2% of investors expect a beat.
- Stock is 6.6% below 200-day MA of $342.29 after drifting 15.9% post-last earnings; short interest down 11.4%.
- Options imply 9.4% move (avg. 11.5% recently); notable buy of 13,468 March 6 $350 calls on Feb 23.
- Estimates revised higher since last release.
Credo Technology $CRDO
- CRDO reports on March 2, 2026, at 4:05 PM ET; consensus EPS $0.94, revenue $389.43M ( 188.5% YoY).
- Preliminary revenue $404-408M, beating prior guidance $335-345M; 79.5% expect beat.
- Stock 10.3% below 200-day MA of $125.20, down 42.6% post-last earnings; short interest down 9.8%.
- Options price 15.2% move (avg. 18.2%); beaten estimates last 4 quarters by avg. 38.46%.
- Estimates revised higher.
Riot Platforms $RIOT
- RIOT reports Q4 on March 2, 2026, at 4:30 PM ET; consensus loss $0.22/share, revenue $157.36M ( 10.4% YoY).
- 82.9% investors expect beat; short interest down 13.5%.
- Stock 12.4% above 200-day MA of $14.50, down 25.0% post-last earnings.
- Options imply 11.7% move (avg. 9.8%); notable buy of 10,710 March 6 $16.50 puts on Feb 27.
- Estimates revised higher.
CrowdStrike $CRWD
- CRWD reports on March 3, 2026, at 4:10 PM ET; consensus EPS $1.10, revenue $1.30B ( 22.8% YoY), matching guidance.
- 55.9% expect beat despite bearish sentiment; short interest up 7.8%.
- Stock 20.4% below 200-day MA of $467.45, down 25.3% post-last earnings.
- Options price 9.3% move (avg. 4.3%); notable buy of 1,782 March 13 $360 calls on Feb 27.
- Estimates revised higher.
Berkshire Hathaway $BRK.B
- BRK.B reports on March 2, 2026, at 8:00 AM ET; consensus EPS $5.19; 93.3% expect beat.
- Stock 3.0% above 200-day MA of $490.11.
- Options imply 2.8% move; notable buy of 10,046 March 20 $505 calls on Feb 20.
- Estimates revised higher; 2026 revenue est. 4.7% YoY, earnings -0.5%.
- Growth Score F per Zacks, no recent estimate changes.
MongoDB $MDB
- MDB reports Q4 FY2026 on March 2, 2026, at 4:05 PM ET; consensus EPS $1.47, revenue $668.19M ( 21.8% YoY).
- Guidance EPS $1.44-1.48, revenue $665-670M; 75.9% expect beat.
- Stock 8.2% above 200-day MA of $303.46, down 19.3% post-last; short interest down 5.0%.
- Options price 17.6% move (avg. 22.5%); notable buy of 2,030 March 13 $360 puts on Feb 12.
- Estimates revised higher.
BigBear $BBAI
- BBAI reports on March 2, 2026, at 4:15 PM ET; consensus loss $0.05/share, revenue $32.44M (-26.0% YoY).
- 33.3% expect beat; short interest up 72.6%.
- Stock 31.8% below 200-day MA of $5.81, down 43.1% post-last.
- Options price 16.7% move (avg. 9.5%); notable buy of 4,197 March 6 $4 calls on Feb 27.
- Estimates unchanged.
Rigetti Computing $RGTI
- RGTI reports on March 4, 2026, at 4:05 PM ET; consensus loss $0.03/share, revenue $2.67M ( 17.4% YoY).
- 54.5% expect beat; short interest up 24.5%.
- Stock 21.0% below 200-day MA of $22.05, down 44.0% post-last.
- Options imply 14.2% move (avg. 6.2%); notable buy of 9,796 April 17 $18 puts on Feb 26.
- Estimates unchanged.
Marvell Technology $MRVL
- MRVL reports on March 5, 2026, at 4:05 PM ET; consensus EPS $0.79, revenue $2.21B ( 21.6% YoY), within guidance $2.09-2.31B.
- 66.7% expect beat despite bearish sentiment; short interest down 12.1%.
- Stock 4.5% above 200-day MA of $78.15, down 18.3% post-last.
- Options price 11.5% move (avg. 14.0%); notable buy of 2,212 March 13 $75 calls on Feb 18.
- Estimates revised higher.
$SPY $QQQ $IWM $VIX
1
1
197
Feb 27
Vertiv & GE Vernova - $VRT $GEV Both have multi billion dollar order backlogs!!! Formally known as Remaining Performance Obligations (RPOs). Money legally owed under existing contracts over the next few years!
For Vertiv, it’s a $15 billion backlog that represents contracts for major hardware and construction projects, such as high-density cooling systems and power equipment for new data centers.
For GE Verona, it‘s a $150 billion backlog that is dominated by long-term contracts for large-scale industrial goods like gas turbines and electrical grid solutions/transformers.
Vertiv Facts:
* Massive Contracted Demand: Going forward with a record $15 billion backlog, which locks in substantial, guaranteed revenue for 2026 and 2027.
*Essential Technology: Leader in liquid cooling and direct-to-chip technology, which is physically necessary to run the newest, hottest AI chips (like NVIDIA's Blackwell and the next-generation Rubin.
*Strategic Partnership: Collaborating with NVIDIA to integrate its power systems directly into the blueprints for future AI platforms, aiming to remain the default infrastructure partner.
*Recurring Service Revenue: Acquired PurgeRite (Dec 2025) to create a high-margin, recurring revenue stream by providing specialized maintenance services for its cooling hardware.
*Regulatory Advantage: Benefits from a U.S. government tariff exemption for large data centers, incentivizing construction in Vertiv’s strongest domestic market.
*Pure-Play Focus: The company is fully focused on data centers, avoiding the drag of slower, cyclical sectors that affect its competitors.
*Improved Financial Standing: Recently upgraded to investment grade (BBB-) by S&P Global Ratings, which typically lowers the cost of borrowing for the company.
GE Vernova Facts:
* Exceptional Revenue Visibility: Its future is secured by a record $150 billion backlog, which essentially guarantees revenue for many years to come.
*Data Center Power Necessity: Its gas turbine business is booming because AI data centers require 24/7 baseload power that intermittent sources (like wind and solar) cannot reliably provide.
*Control Over Bottleneck: It gained full control over the manufacturing of electrical transformers (via the Prolec GE acquisition), which are currently the single biggest bottleneck in the U.S. electrical supply chain.
*Long-Term Customer Lock-in: Secured long-term capacity agreements, such as a Strategic Alliance with Xcel Energy, that extend revenue certainty through the 2030s.
*High Demand for Turbines: Order backlog for gas turbines and slot reservations jumped significantly, with a target of 100 GW by the end of 2026.
*Strong Cash Generation: Generated $3.7 billion in free cash flow in 2025, more than double the prior year.
*Commitment to Shareholders: The strong cash flow allowed management to double the quarterly dividend and increase the share repurchase authorization to $10 billion.
$NVDA $TSM $DTCR $EQIX $DLR $CRWV $SPX $SPY $QQQ $VIX $AVGO $SEMI $ASML
3
289
Feb 27
$NFLX Here’s why the stock went up since the $WBD deal is dead…..
• Shows capital discipline: walking away from Paramount’s higher bid instead of overpaying.
•It Cuts regulatory risk & avoids antitrust fights and deal headaches that hurt shares for months potentially.
•Keeps core focus: Sticks to high-growth streaming without any of Warner’s messy assets.
•Restarts share buybacks that were paused for the deal, now resuming to return cash to investors.
$PARA $ORCL $SPX $SPY $QQQ $CMCSA #Netflix
1
179
Feb 26
List of $NVDA price targets…
Morgan Stanley - $210–$250
TD Cowen - $235
JPMorgan - $265
Goldman Sachs - $240
Piper Sandler - $225
Loop Capital - $350
Melius Research - $300
Robert W. Baird - $300
Rosenblatt - $300
Cantor Fitzgerald - $300
New Street - $307
Citi - $220
Mizuho - $220
UBS - $235
Bernstein - $225
Truist Financial - $283
$JPM $C $GS $MS $UBS $TFC $MFG $TSM $SPY $SPX $VIX $QQQ $XLK $SMH $FTXL
138
Feb 25
The Citrini Report is widely misunderstood!!
First off it is not written as a short report, the first line literally says that it’s
“a thought exercise in financial history, from the future”.
It also says….”What follows is a scenario, not a prediction”
Yet the market reacted like it was a short report and prediction. Lol. It is bearish but its more like telling investors to think harder about certain risks rather then saying…. Short this or that.
I’m gonna give you the top 10 facts from this Substack published scenario.
But first about the author…Citrini is the pen name for James van Geelen. Before starting Citrini Research in 2023, he was an entrepreneur in holistic/alternative healthcare; he built a healthcare venture starting in 2013, sold it to private equity in 2018 (no info about the sale price) and then shifted to investing his own capital and later professionalizing that work via Citrini Research.
And that is just for context, nowadays anyone can publish amazing research and insights, it’s no longer a Wall St. only game.
Top 10 Facts of the “2028 Global Intelligence Crisis”
1. Thought experiment, not a firm prediction!
-Citrini is running a “what if” scenario: what if AI works really well, boosts productivity a lot, and that success actually ends up being bad for the economy and markets!?
2. Core risk: a self‑reinforcing layoff loop.
-Companies use AI to cut white‑collar staff, then use the savings to buy more AI, which leads to more layoffs, weaker demand, and even more pressure to cut costs again.
3. White‑collar jobs are the weak point.
-The US is a white‑collar, services economy. These higher‑income workers drive most discretionary spending. If AI hits their jobs, consumer demand falls much harder than the headline job numbers suggest.
4. “Ghost GDP”: high output, weak spending.
-On paper, productivity and GDP look great because AI is doing more work. But if humans aren’t getting paid, they don’t spend, so the real economy and many businesses still suffer.
5. Market path: AI bubble first, big drawdown later.
-In the scenario, AI hype pushes the S&P 500 much higher first, then as job losses and weak demand show up, the index falls sharply (down ~40% in the base case, potentially ~50–60% in a worse case).
6. AI kills “friction moats” and middlemen.
AI agents shop and transact for people, always chasing the best price and terms. That hurts many businesses that relied on human inertia and complexity—travel sites, financial advisors, insurance brokers, routine legal work, real estate agents, etc.
7. Key transmission channels: SaaS, payments, private credit.
- SaaS: Cheaper AI coding erodes the value of many software subscriptions.
- Payments: Agents route around expensive card networks and fees.
- Private credit: Loans tied to software and white‑collar cash flows become riskier, hitting insurers and “safe” yield products that own this debt.
8. Housing could turn from safe to dangerous.
-If many high‑income professionals lose or fear losing their jobs, even “prime” mortgages in tech/finance cities can crack, putting pressure on a huge, usually stable market and deepening the downturn.
9. Winners and losers by country and sector.
-Beneficiaries: AI infrastructure and chip ecosystems (e.g., compute, semis, hyperscalers) that sell the “picks and shovels” of AI.
-Losers: Places and sectors built on selling human brainpower (e.g., India’s IT services exports) as AI makes that labor cheaper to automate.
10. Policy tools don’t match the problem.
-Cutting rates and doing Quantatative Easing can support markets, but they don’t fix the core issue: human labor becomes less valuable. Tax systems tied to wages struggle, deficits widen, and meaningful redistribution (e.g., taxing AI profits/compute to fund people) is politically slow, letting the damage build.
#CitriniResearch $SPY $QQQ $SNDK $MU $NVDA $V $MC $DASH $TSM $NOW $IGV $VIX
$PLTR
1
170
Feb 18
Walmart $WMT Earnings Preview - Top Points
•Walmart has beat revenue estimates for 15 straight quarters!!! And EPS in the last 7/8.
• Consensus projects revenue of ~$189-190 billion (up 5-6% YoY) and EPS of $0.73 (up ~10-11% YoY),
•U.S. comp expected at 4.1-4.3% growth, fueled by higher-income value shoppers, e-commerce (20% rise), ads, and membership fees supporting margins.
•Stock trades at premium 45-46x forward P/E after 20% YTD rally to $1T market cap, raising bar for beats and FY2026 guidance (~11% op income growth).
•FY2026 outlook critical; prior guidance ($2.58-2.63 EPS, 4.8-5.1% sales) above Street, but watch tariff impacts, food inflation slowdown, and new CEO commentary.
• Key risks include 2026 tariffs (10% universal, up to 145% on China) raising import costs, supply chain strains, and pressure to maintain pricing while defending margins.
$SPX $SPY $QQQ $HD $AMZN $VIX
832
Feb 17
$SPX reports its highest Q4 revenue growth in three years at 9.0%!
•The highest since Q3 2022’s 11.0%.
•Ten of eleven sectors show year-over-year revenue growth, with Information Technology $XLK/ $VGT (20.6%), Communication Services $XLC/ $VOX (12.2%), and Health Care $XLV/ $VHT (10.3%) achieving double-digit rates.
•However…Analysts forecast lower growth ahead:
- Q1 2026 at 8.7%, dropping to 7.4% by Q4 2026.
Why??^ - Analysts, which means - Goldman Sachs - $GS Morgan Stanley - $MS & JP Morgan $JPM … expect a lower forecast simply from a technical/statistical standpoint.
As in they don’t expect earnings to move higher from its highest report in 3yrs. Analysts expect companies overall to return to a mean reversion after the 3 year high surge.
-The drop in earnings expected is NOT from a fundamental standpoint of declining profits/sales.
- This can be looked at as positive bc its just analysts going by past numbers. - Theres is no broad downside noted, fundamentally,by any analysts.
$SPY $QQQ $VIX
705
Feb 17
The Big Events This Week! - besides earnings….
• Wednesday Morning (The Reset): Think of this as the market cleaning. A lot of old bets on the $VIX expire(Options & futures) The $VIX may be elevated from its norm of late above 20 but that is around its average. And the market usually has some fear heading into this deadline. So conventional thinking says the market will want to stay at its avg and not jump up or possibly even drop below 20.
• Wednesday Afternoon (Fed Minutes): The Federal Reserve releases notes from their last meeting. If they sound "Tough" on inflation, stocks likely go down. If they sound "Worried" about the economy, stocks might go up.
•Thursday (Jobless Claims) : Lower-than-expected claims signal labor strength, boosting stocks as they ease recession fears and support Fed pause/hike odds; higher claims spark selloffs via growth worries and rate cut bets.
• Friday (OPEX & PCE): This is the biggest day of the week. Two things happen: a major Inflation Report (PCE - Personal Consumption Expenditures Price Index) comes out in the morning, and OPEX - the monthly Options Expiration, especially for $SPX/
$QQQ - millions of Stock Options expire in the afternoon. This usually creates the biggest "fireworks" or price swings of the week.
All in all the market has been volatile, expect more of it this week!
$SPY
$DJI
$BTC
279
Feb 10
$UBER stock price targets & top reasons to invest despite recent volatility/downside movement!
• Cantor Fitzgerald: $92
•Morgan Stanley: $100
•Piper Sandler: $100
•Wells Fargo: $100
•Citizens: $100
•JPMorgan: $105
•BMO Capital: $106
•Mizuho: $110
• Citigroup: $110
•TD Cowen: $114
•Goldman Sachs: $125
Top reasons Uber remains a strong buy despite recent volatility & downside movement!
•Uber holds a dominant 64% market share in U.S. ridesharing, far ahead of Lyft’s 31%, supporting robust revenue growth of 18% to $49 billion annually.
•Analysts rate Uber as a Strong Buy with an average price target of $92 - $125, implying a 25% - 70% upside from current price of $74.
•Recent Q4 bookings & user growth remain strong across mobility & delivery, with Q1 2026 gross bookings guided at $52-$53.5 billion.
•Free cash flow is exploding, projected at $13.1 billion by 2027, enabling buybacks & investments while trading at an attractive 15x 2027 FCF multiple.
•Strategic push into robotaxis & AV partnerships unlocks a “multitrillion-dollar opportunity,” positioning Uber for long-term dominance despite near-term capex.
•Diversification into grocery, retail delivery, Uber One memberships, & international expansion drives cross-platform growth & EBITDA margins.
•Recent 12-15% stock dip from highs creates a value entry, with shares 16-25% below 52-week peaks amid temporary robotaxi fears.
•Technicals show oversold RSI near 35 & low Stochastic (14-20%), below moving averages (20-day SMA ~$81), signaling potential rebound from support ~$73-77.
•Positive analyst momentum from J.P. Morgan & KeyBanc, with targets holding at $105 post-earnings despite minor guidance tweaks.
•Solid balance sheet & profitability (EBITDA $5.29B) fund AI initiatives like Uber AI Solutions & affordable mobility, enhancing future EPS to $4.18 by 2027.
$QQQ $SPY $GS $JPM $C $VIX
252
Feb 9
$META Price Targets
• BMO Capital: $730
• Morgan Stanley: $750 (Revised; previously $825)
• Argus Research: $800
• TD Cowen: $820
• JPMorgan: $825
• Freedom Capital Markets: $825
• Goldman Sachs: $835
• Piper Sandler: $840
• Wells Fargo: $849
• Guggenheim: $850
• Morningstar: $850 (Fair Value Estimate)
• KeyBanc: $855
• Cantor Fitzgerald: $860
• Citigroup: $872
• UBS Group: $872
• BofA Securities: $885
• Monness, Crespi, Hardt: $890
• Evercore ISI: $900
• Wedbush: $900
• Citizens: $900
• Rosenblatt Securities: $1,144
•Why the Range is So Broad
The $400 gap between the lowest and highest targets stems from two primary factors:
• CapEx vs. Growth: Meta has guided a massive $115–$135 billion in capital expenditure for 2026. Analysts at the lower end (like BMO and Morgan Stanley) are cautious about how this spending will impact near-term margins. Analysts at the top (like Rosenblatt) believe this infrastructure is the "moat" that will make Meta the dominant AI utility for years.
• Earnings Surprise Potential: Meta beat Q4 earnings by over 8% ($8.88 EPS vs. $8.19 expected). Those with $900 targets believe Meta’s AI ad-tools will continue to drive revenue growth at a rate that "neutralizes" the high costs of building data centers.
Summary: The consensus average sits at approximately $859.85. With the stock currently trading around $677, even the more conservative targets suggest a solid upside, while the bulls are betting on a massive breakout.
$MS $C $JPM $GS $WFC $UBS
167
Feb 7
$Google earnings top facts!
• Record Annual Revenue: Alphabet surpassed $400 billion in annual revenue for the first time in 2025 ($402.8B total), marking a 15% year-over-year increase.
• Google Cloud Hypergrowth: Cloud revenue surged 48% in Q4 to $17.7 billion, now operating at an annual run rate exceeding $70 billion.
• Search Resilience: Despite fears of AI disruption, Google Search revenue grew 17% year-over-year, reaching $61.3 billion in the fourth quarter.
• Gemini User Base: The Gemini app has reached over 750 million monthly active users, with the launch of Gemini 3 in December 2025 driving significantly higher engagement.
• Massive Infrastructure Investment: Alphabet issued a 2026 Capital Expenditure (CapEx) guidance of $175 billion to $185 billion, nearly doubling its 2025 spending to build out AI data centers.
• YouTube Milestones: YouTube’s combined revenue from ads and subscriptions exceeded $60 billion for the full year 2025.
• Subscription Growth: The company now has over 325 million paid subscriptions across services like Google One and YouTube Premium.
• Profitability Gains: Q4 net income increased 30% to $34.5 billion, and annual net income reached $132.2 billion, showing that earnings are growing faster than revenue.
• AI Token Processing: Alphabet is currently processing over 10 billion tokens per minute across its first-party models, highlighting the massive scale of its AI integration.
• Gemini Enterprise adoption: Google’s workplace productivity - More than 120,000 enterprises now use Gemini, and the company has sold over eight million paid seats for Gemini Enterprise
• By Google integrating Gemini across Search, YouTube, and Workspace, Google increases user engagement, which drives ad revenue and subscription sign-ups.
• Cloud Synergy: The high demand for AI tools forces enterprises to use Google Cloud, which has transitioned from a loss-leader to a high-margin profit center (operating margins rose from 17.5% to 30.1% in one year).
• The aggressive 2026 CapEx guidance ($185B) suggests Alphabet believes we are in a "winner-take-all" phase of AI infrastructure. They are betting that owning the hardware and the model layer simultaneously will create an insurmountable lead over competitors who rely on third-party chips or models.
#Youtube
#youtubepremium
#Google
#Gemini
#AI
#Cloud
#Alphabet
1
151
Feb 5
$IONQ Summary of Short Report by @WolfpackReports ….First for context, Wolfpack has published short reports on
$MAX (lawsuit)
$APLD (no effect)
$INOD(claim held)
$MET (lawsuit)
Key facts on the IonQ short report…
- Wolfpack took a short positiondue to revenue risks from lost government funds.
- Pentagon deals made up to 86% of IonQ's revenue from 2022 to 2024.
- IonQ lost funding in 2025 for key Pentagon contracts, leaving a $54.6 million hole in bookings.
- Just $21 million of $75.6 million expected Pentagon bookings from 2024 got 2025 funding.
- Report claims shady sales tactics, like pumping up a big quantum sale in April to hide troubles.
- IonQ runs big operating losses on top of these revenue shortfalls.
- CEO left recently after the Pentagon funding cuts hit.
- Insiders sold almost $400 million in stock when the shortfall news broke.
$QTUM $QBTS $RGTI $IWM $QQQ #QUANTUM
1
442