Data-driven, multi-strategy trader. Trading large trends, key themes, & smaller opportunities in between.
Joined November 2024
- Tweets 1,274
- Following 176
- Followers 53,709
- Likes 9,928
740 Photos and videos

Pinned Tweet

Feb 7
Since 1957, any random day for $SPX has been higher:
• 1 year later: 72.8% of the time ( 8.8% average)
• 6 months later: 68.9% of the time ( 4.3% average)
• 3 months later: 66.1% of the time ( 2.1% average)
• 1 month later: 61.6% of the time ( 0.7% average)
• 1 week later: 56.7% of the time ( 0.2% average)
This is the baseline.
Without this benchmark, forward-return statistics are meaningless. They tell you nothing about how bullish or bearish a signal really is.
32
61
500
122,938
Apr 10
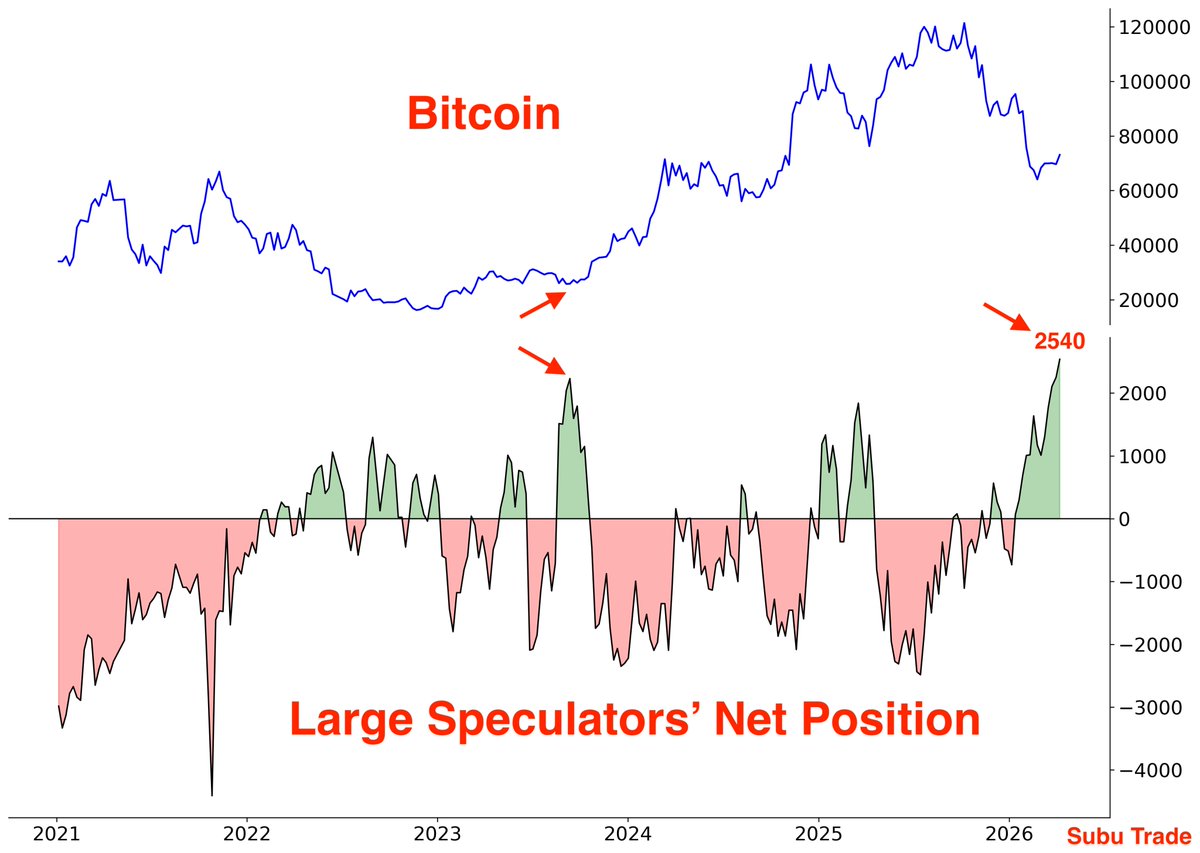
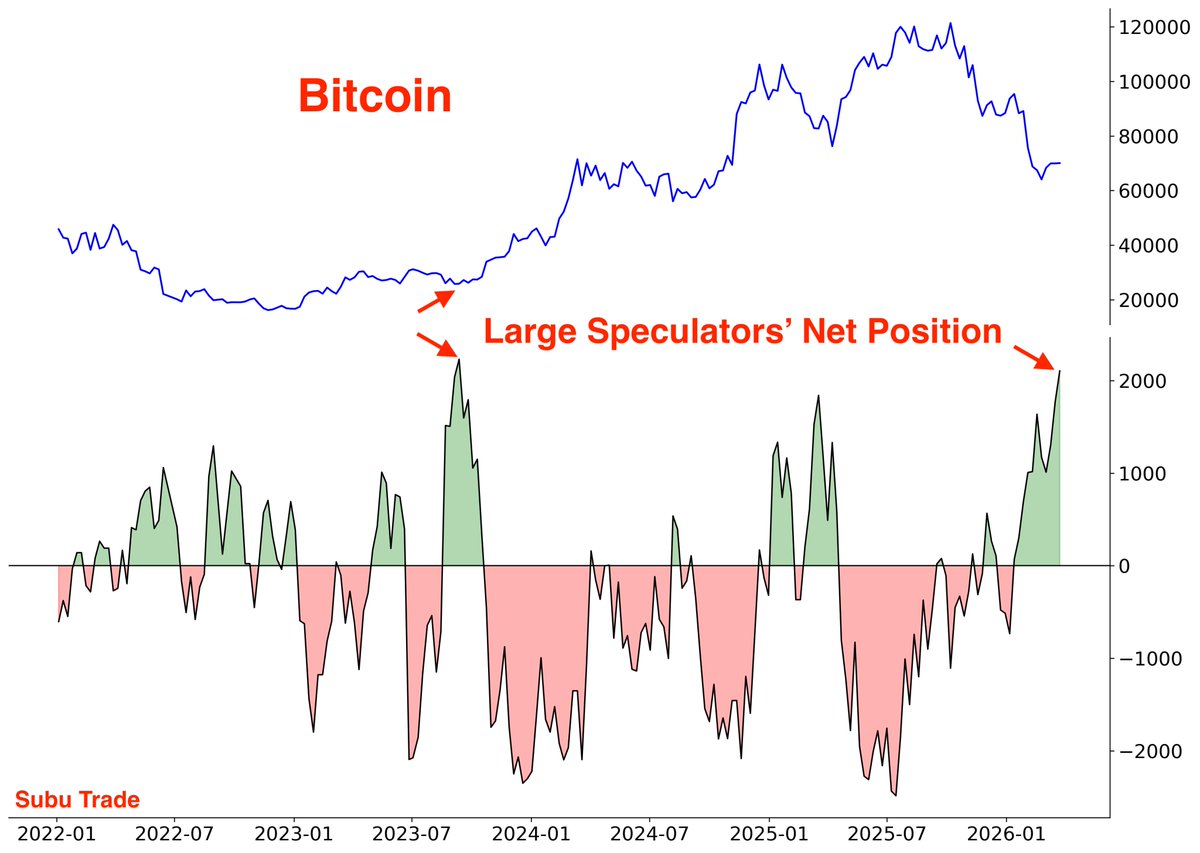
Large Speculators are RECORD net-long Bitcoin.
This breaks the previous record from September 2023, before Bitcoin rallied.
$BTC
40
152
945
85,791
Apr 9
Market breadth jumped.
For the first time in 4 months, the S&P 500's McClellan Oscillator is above 50
We've seen 11 similar cases before, and 10 of those 11 saw $SPX higher a month later. Average gain 3.2%
H/T @TheMarketStats
10
66
397
32,315
Apr 9
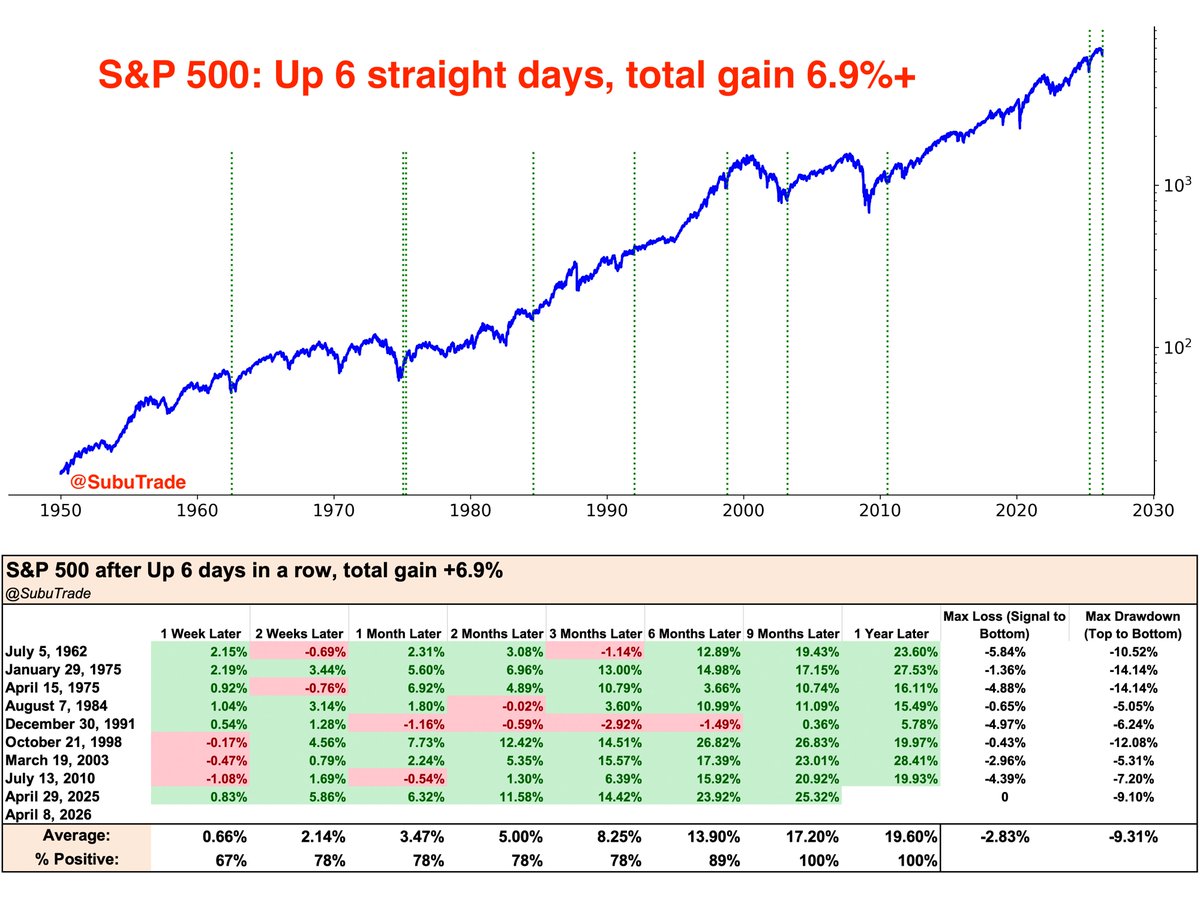
S&P 500 is up 6 days in a row, with a total gain of 6.9%
This only happened 9 other times, and $SPX was consistently higher 6-12 months later.
Average maximum drawdown in the next year was 9.3%
h/t @Norseman1 @RyanDetrick
31
99
637
95,368
Mar 29
Large Speculators are extremely net-long Bitcoin.
Such extreme positioning was last seen in 2023, before Bitcoin rallied.
81
160
1,095
134,330
Mar 29
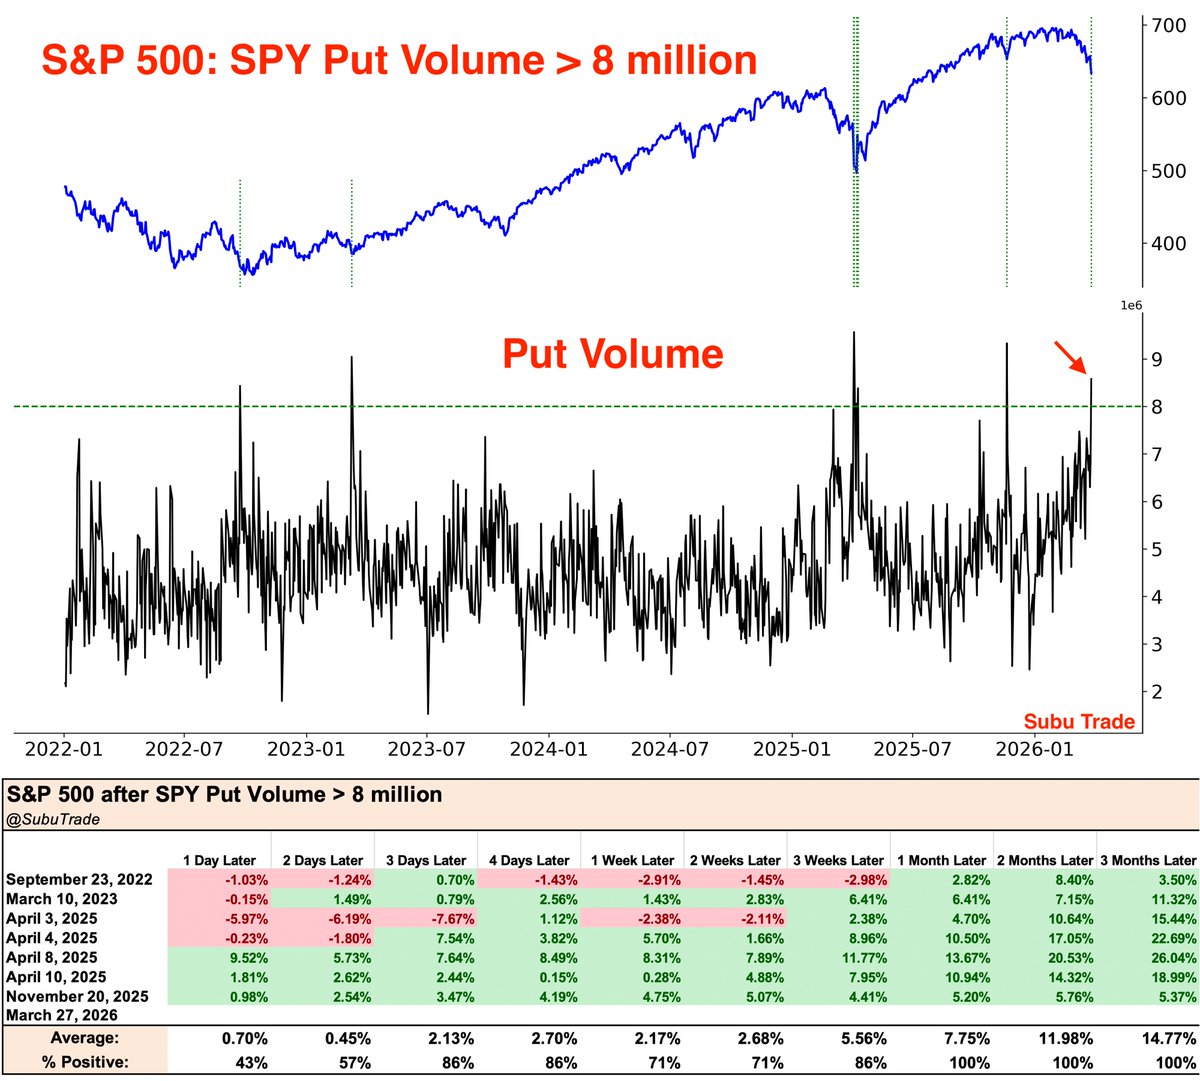
$SPY Put Volume spiked on Friday.
Previous spikes came close to marking bottoms for the S&P 500.
Will this time be different?
90
200
1,133
230,860
Mar 26
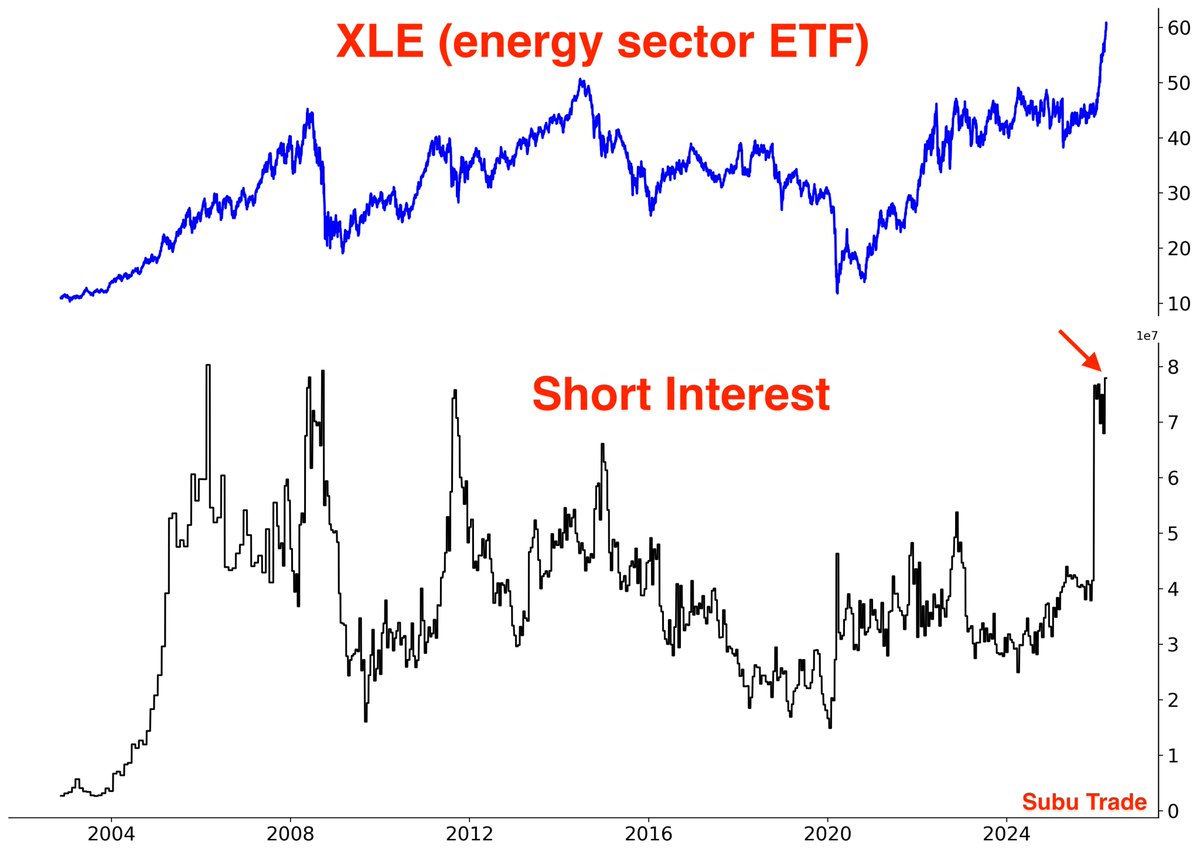
Energy sector $XLE Short Interest is at the highest level since 2008.
Energy stocks are being squeezed higher
26
52
375
81,395
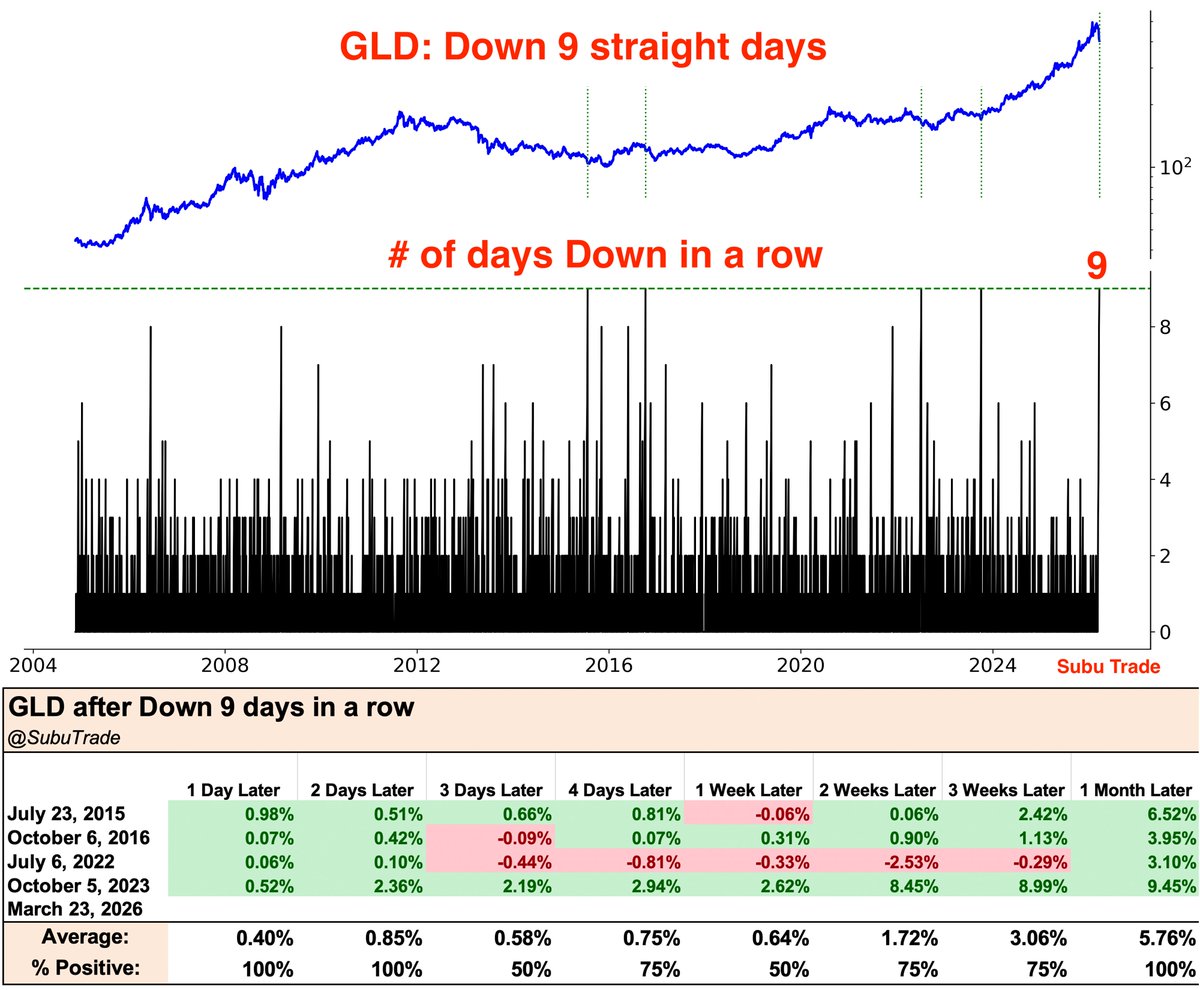
Mar 24
$GLD (gold ETF) is Down 9 days in a row.
It has never gone Down 10 days in a row before.
H/T @Mr_Derivatives
14
45
398
49,291
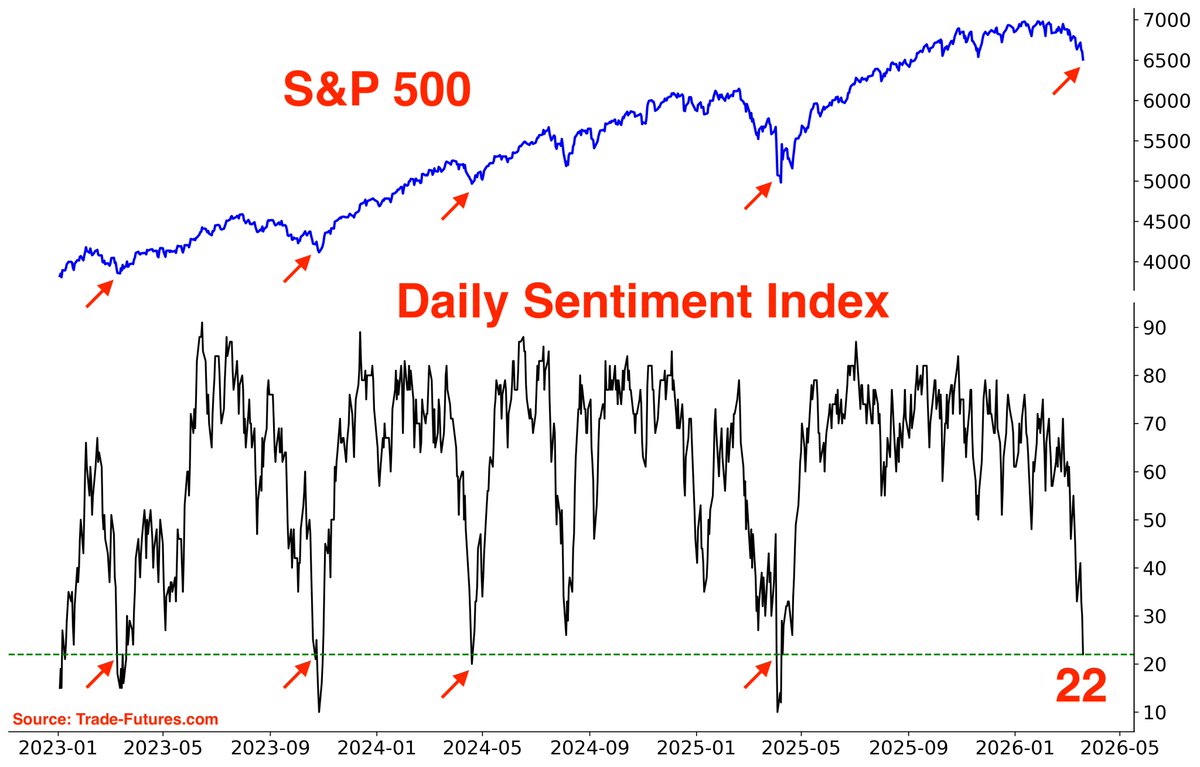
Mar 21
S&P 500's Daily Sentiment Index is at 22, the lowest since last April's crash.
Similar depressed sentiment readings came close to marking bottoms for $SPX
76
186
1,272
200,642
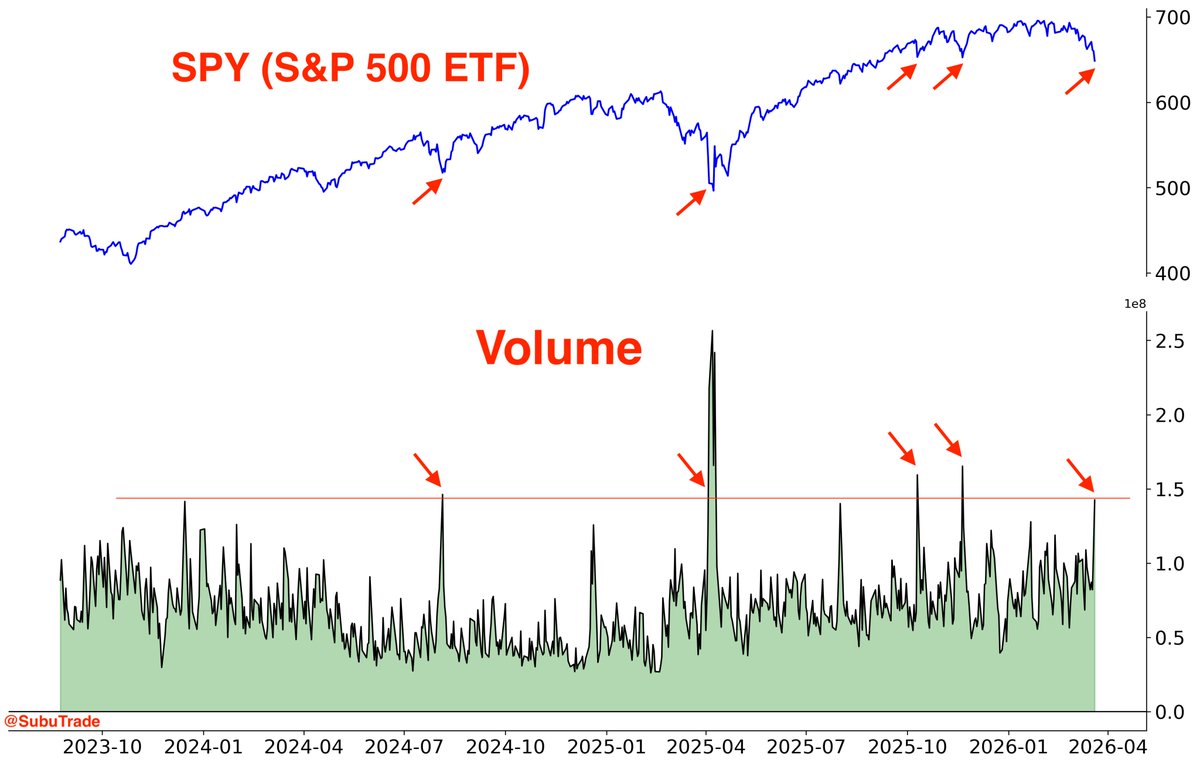
Mar 20
$SPY volume today jumped to the highest since last November's bottom.
Are we getting closer to capitulation? ⬇️
75
104
908
147,443
Mar 19
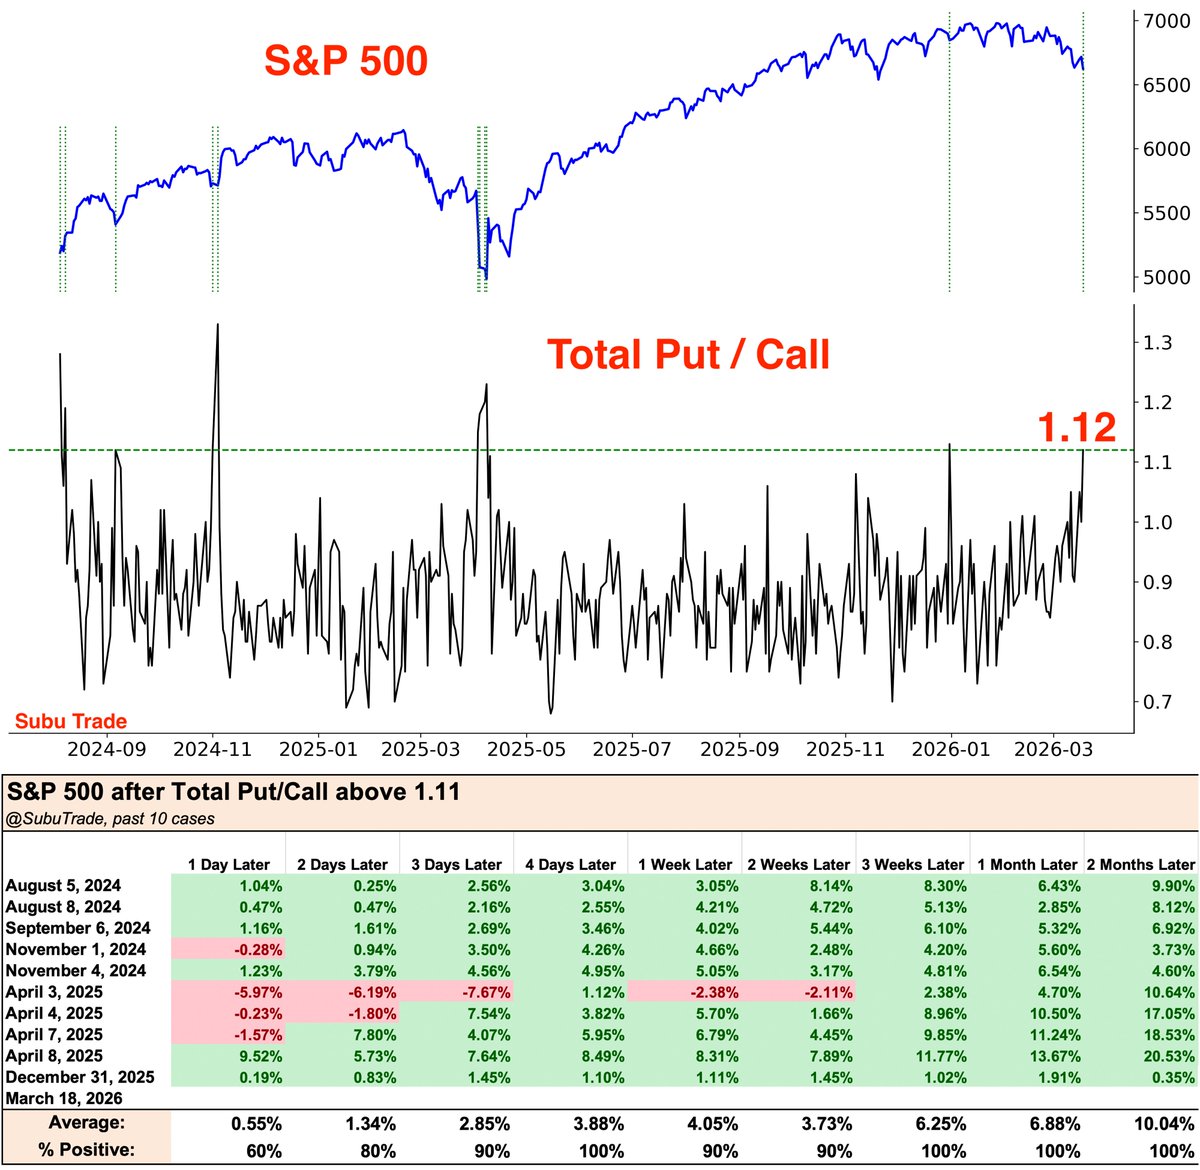
Total Put/Call Ratio jumped to 1.12
The last 10 spikes came close to marking bottoms for $SPX
Will this time be different?
74
189
980
148,097
Mar 17
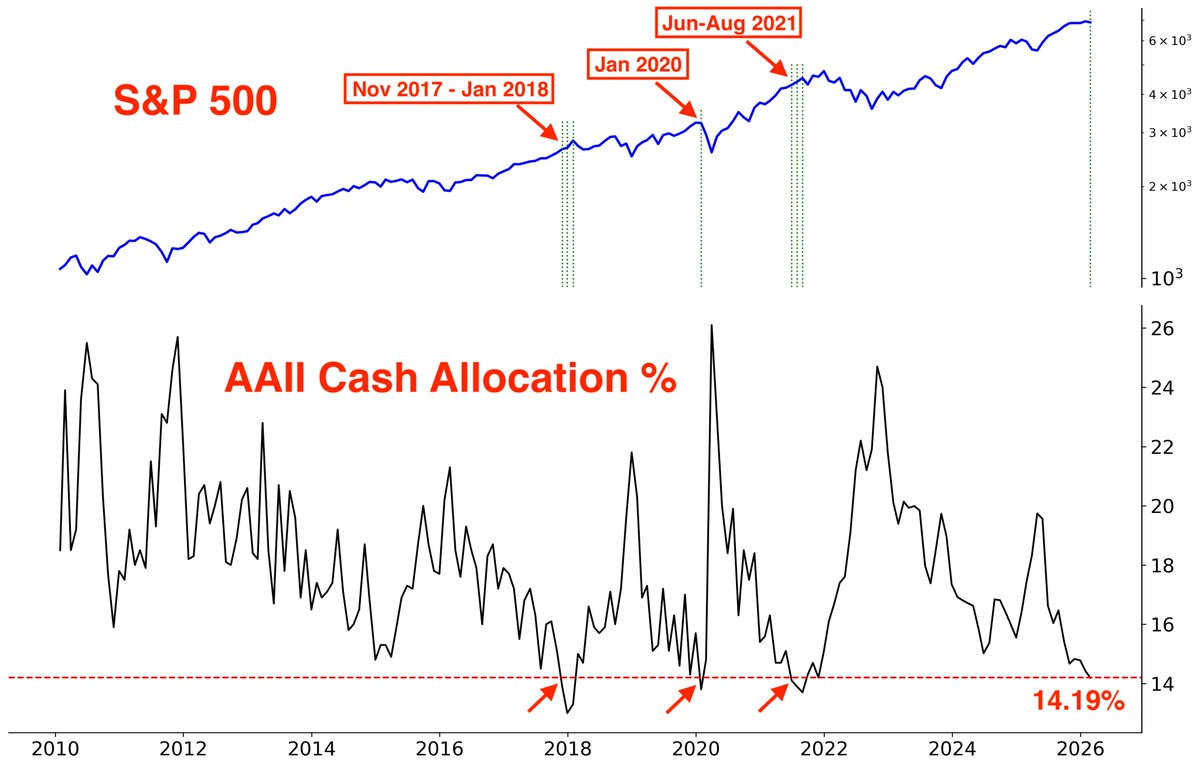
From the AAII Sentiment Survey:
Cash Allocations is at 14.19%. Investors are holding the least cash in 4 years.
This happened 3 times in the past 20 years: late-2017, Jan 2020, late-2021.
Each case preceded significant market volatility and losses for $SPX
71
193
967
158,443
Mar 15
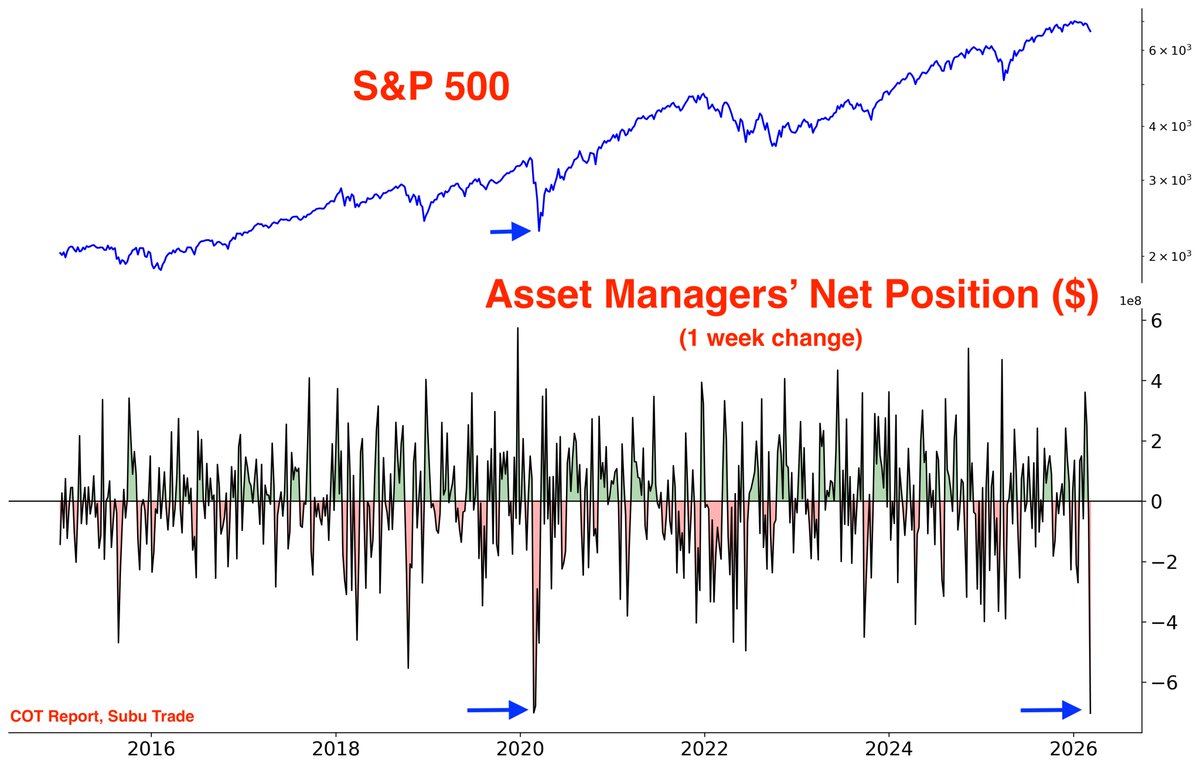
From the COT Report:
Asset Managers dumped a record amount of S&P 500 futures this week
Even more than during the COVID crash
61
184
971
197,076
Mar 15
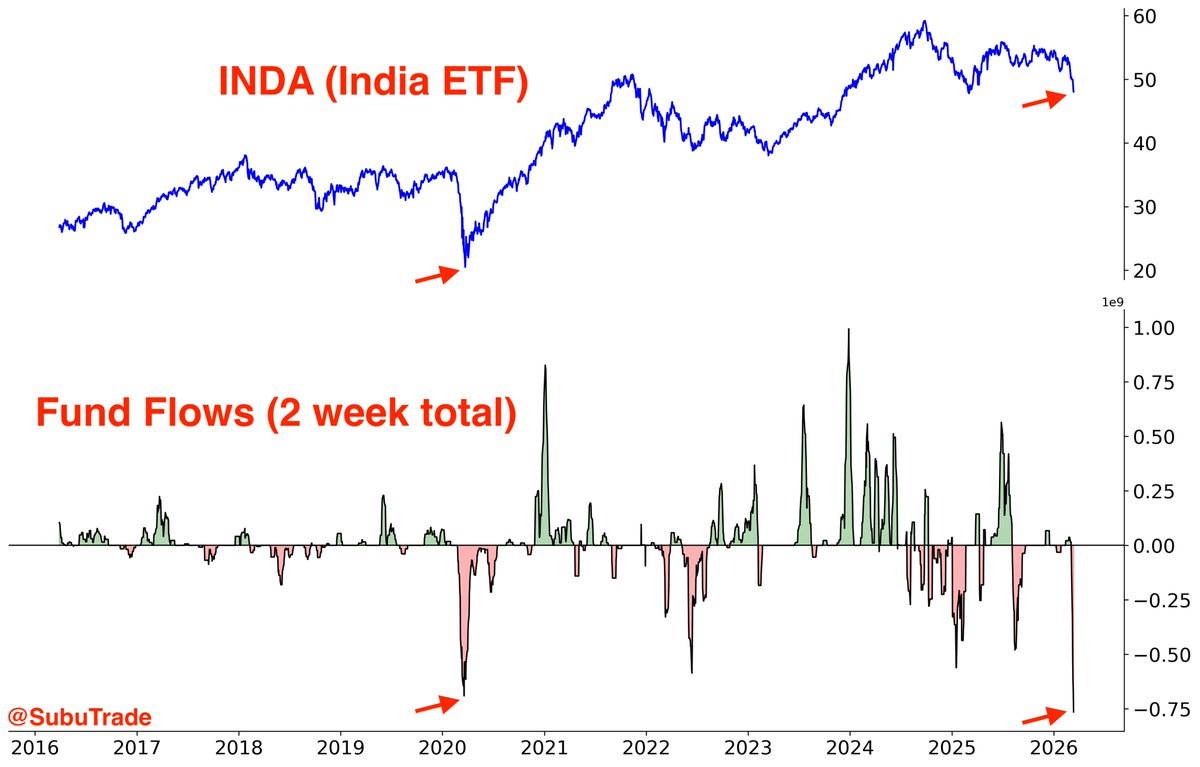
Time to buy Indian stocks? 🇮🇳
India ETF $INDA has seen RECORD outflows over the past 2 weeks.
Even more outflows than during the COVID crash.
35
33
414
55,908

Mar 13
Despite being within 5% an all-time high, the $SPX McClellan Oscillator is extremely oversold.
This setup has occurred 10 times previously, and $SPX was higher every single time 1 month later.
Average gain over next month was 3.2%
h/t @eliant_capital

58
177
994
270,591