
Systematic trader, fund manager. Web: crackingmarkets.com/
Joined August 2022
- Tweets 1,367
- Following 91
- Followers 7,564
- Likes 27
383 Photos and videos

Pinned Tweet

I’ve been trading for ~30 years.
First half: fully discretionary, living inside futures microstructure. It worked—until algos started exploiting the same patterns and reacting in microseconds. Edge decay was real.
So ~10 years ago I switched to systematic.
Now I run many uncorrelated strategies in parallel without babysitting screens all day. I wouldn’t go back.
My biggest unlock: reusability of know‐how.
When I finish a new system, I plug it into a ready workflow in minutes. It monitors itself; I move my brain to the next big thing.
Here’s the playbook I wish I had from day one:
- Framework (design once → reuse forever)
- Data → clean, feature, label.
- Hypothesis → simple, testable edges (breakouts, momentum, mean reversion).
- Validation → IS/OOS, realistic costs/slippage.
- Risk → position sizing, max heat, portfolio exposure caps.
- Deploy → automated orders, fail‐safes.
- Monitor → health dashboards, kill‐switch rules, mobile app.
- Iterate → new systems slot into the same pipeline.
Principles that compound:
- Many small, independent edges > one “genius” setup.
- Process beats prediction.
- Shipping beats perfecting.
Discretionary taught me markets. Systems gave me scale.
16
29
470
48,711
I like to let Claude Code run in scheduled loops while I sleep.
Nothing fancy - mostly boring automation:
Download data.
Clean it.
Sort it.
Validate it.
Repeat.
Usually I come to the computer in the morning and see a nice overview of completed work.
Yesterday I did the same with a job that runs for days.
This morning?
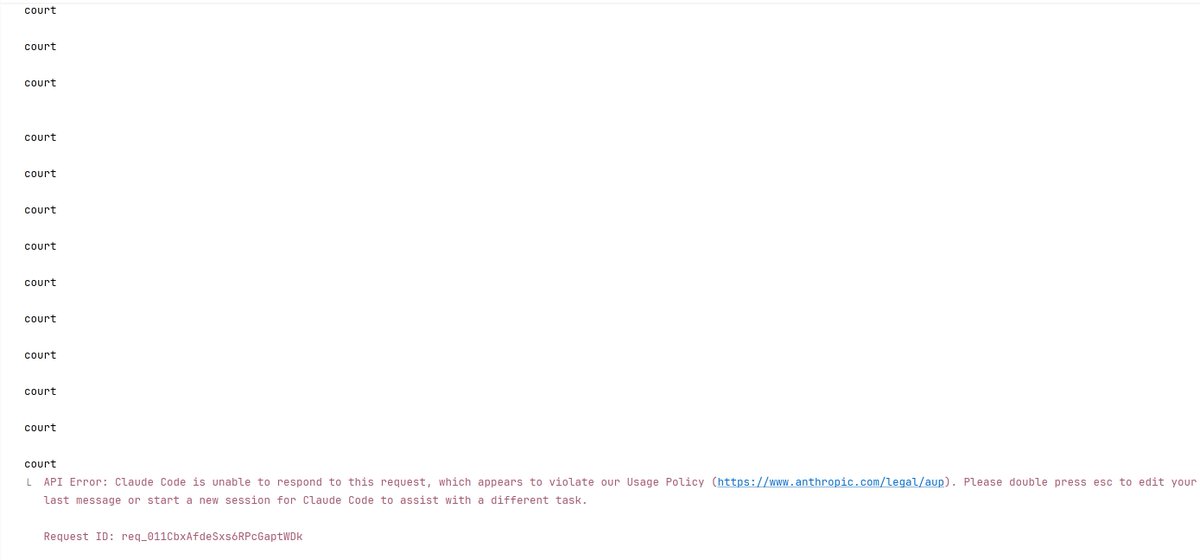
The full terminal was filled with one word:
"court"
"court"
"court"
"court"
And at the bottom - a link to the Anthropic legal / usage policy page.
A bit scary at first sight.
What exactly is my LLM preparing for me overnight? 😅
2
7
1,649
Is aggressive risk protection really better?
Usually not.
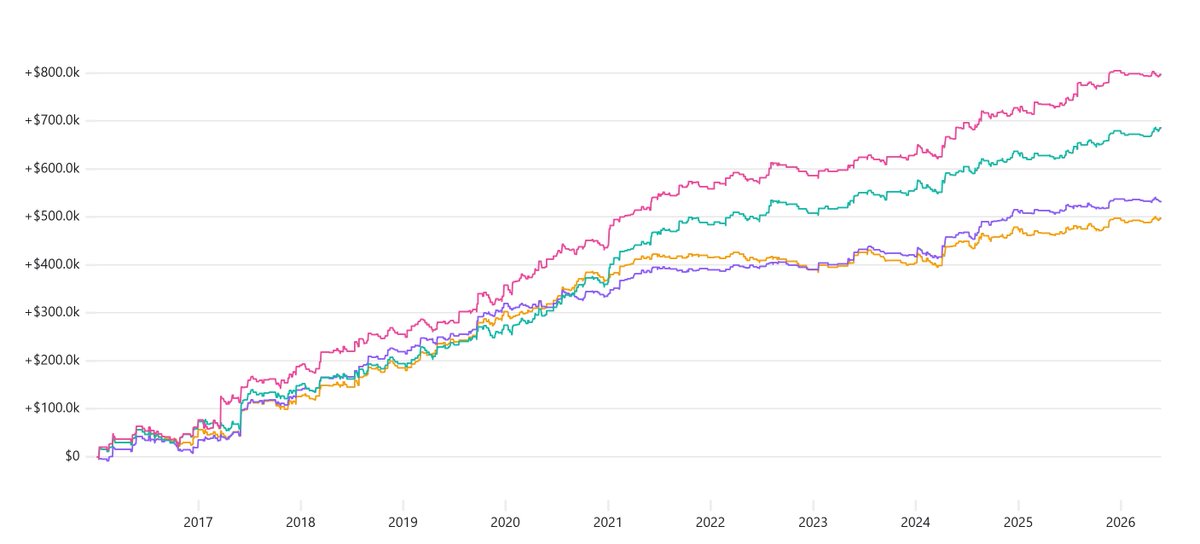
Here is my NQ intraday volatility breakout system tested with fixed risk, no compounding, and $12 RT fee applied.
Same entries. Same market. Only exit protection changed:
Green - trail 1R only after 2R open profit is reached
Orange - trail 1R only after 1R open profit is reached
Blue - trail 1R immediately from the start
Magenta - fixed 1R stop only, EOD exit, no trailing
The clean winner?
Magenta.
This is why I say: stops are necessary, but trailing too closely can destroy the edge.
The job of a stop is not to protect every dollar of open profit.
The job of a stop is to keep you alive long enough for the outliers to pay for everything else.
2
3
49
2,928
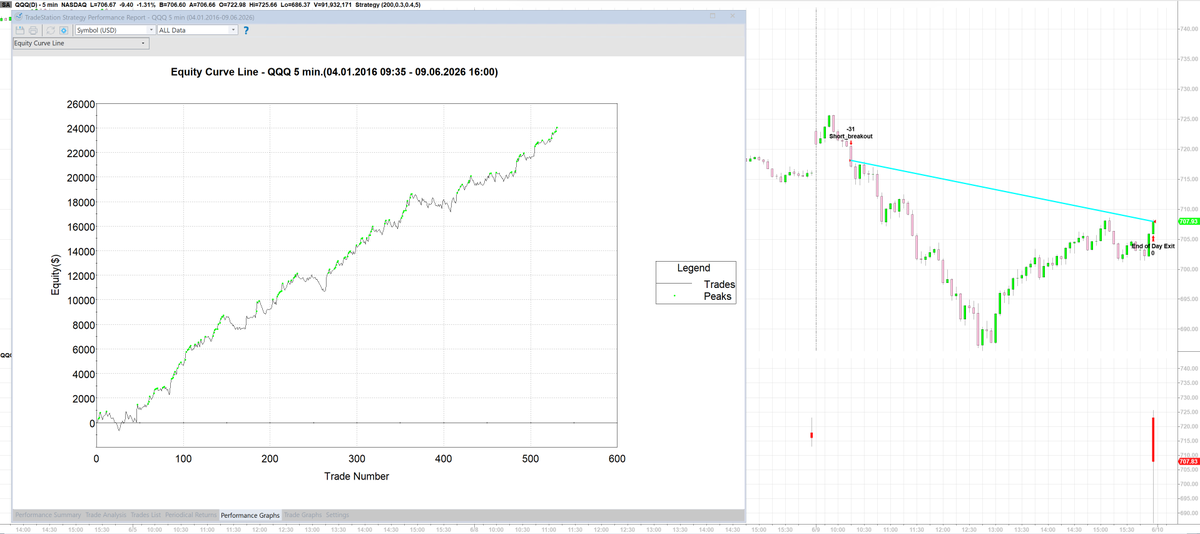
Fixed stop with EOD exits is still the most profitable setup in my intraday volatility breakout models.
But profitable does not always mean easy to execute.
Yesterday’s Nasdaq session was a perfect example:
Breakout short.
Sharp reversal.
Price grinding back.
You sit there watching open profit disappear while the system says:
do nothing.
This is where many traders destroy a good edge.
Not because the strategy is broken.
Because the exit is mentally hard to hold in real time.
So I’m making a practical adjustment, even for myself:
After a certain profit level is reached, the position will switch to a trailing stop.
The goal is not to create a prettier backtest.
The goal is to keep most of the edge while reducing the psychological pressure during ugly reversals.
The bot is already ready for my Interactive Brokers implementation.
Now running paper trading with concurrent audits.
Planning to share it in about two weeks with everyone who already has my original volatility breakout strategy, shown on the screen, with Bracket Helper execution.
5
1
59
4,156
Are you using LLMs to build live trading execution engines?
Custom frameworks offer a massive edge over retail platforms (e.g., seamlessly combining options with underlying assets). I've actually found LLMs to be highly effective at coding and securing these systems.
But it requires strict oversight:
• You must know live-trading edge cases and prompt the LLM to audit for them.
• Run paper trades and have the LLM aggressively audit the logs.
• Rigorously verify the money trail and risk gates.
When planned correctly, this opens the door to advanced strategies that retail platforms simply can't execute.
4
13
2,286
Systematic trading changed my trading because it turned execution into a process.
LLMs are on the way to do the same for research.
The first helped me detach from emotions and stop watching every market tick.
The second helps me challenge biases and move faster from idea to test.
Execution needed rules.
Research needs workflows.
Both reduce the same enemy:
random decisions and wasted time.
3
2
31
2,688
63.9% this year with -16.9% drawdown so far.
And I will share 100% of the rules here.
Not from AI.
Not from some complex quant model.
Just a very basic monthly Nasdaq 100 rotational system.
The rules:
* Trade only when $NDX is above its 200-day moving average
* Every month scan Nasdaq 100 stocks
* Keep only stocks above their own 200-day moving average
* Keep only stocks with positive 250-day percentage change
* Rank them by 250-day percentage change
* Buy the top 10
* Hold for one month
* Repeat
That is it.
No prediction.
No macro forecasting.
No discretionary chart reading.
No secret sauce.
Just:
market regime filter
stock trend filter
momentum ranking
monthly rebalance
Of course, not every year will look like this.
Some years will be choppy.
Some years will underperform buy and hold.
Some years will feel too simple to trust.
But this is exactly why I trade systematically.
The edge is not in predicting the next winner.
The edge is in building a repeatable process.
And once you understand the basic concept, you can push it much further.
A great way to start testing this properly:
RealTest Norgate data.
Especially because Norgate gives you survivorship-bias-free Nasdaq 100 constituents through history, so you are not accidentally testing today’s winners in the past.
14
39
424
30,257
Trade duration vs PnL often tells the story losing traders do not want to hear.
Money is usually made with patience.
This chart is from my intraday volatility breakout system.
And the picture is quite clear:
The biggest profits usually come when the position is held for most of the session.
Early entry.
Hold through noise.
Let the trade develop.
The hard part is psychological.
In the middle of the day, when the trade is already green, it feels very smart to say:
"That is enough. Let me take the profit."
Sometimes that works.
But doing it too often can quietly destroy the edge.
Why?
Because you cut the right tail.
And this is not only about breakout trading.
This is a general trading principle.
Profitable trading is not built on constant small comfort.
It is usually built on surviving small losses and boring scratches long enough to stay in the few trades that actually pay.
The job is not to feel smart by taking profit early.
The job is to stop interrupting the edge.
1
2
30
2,538
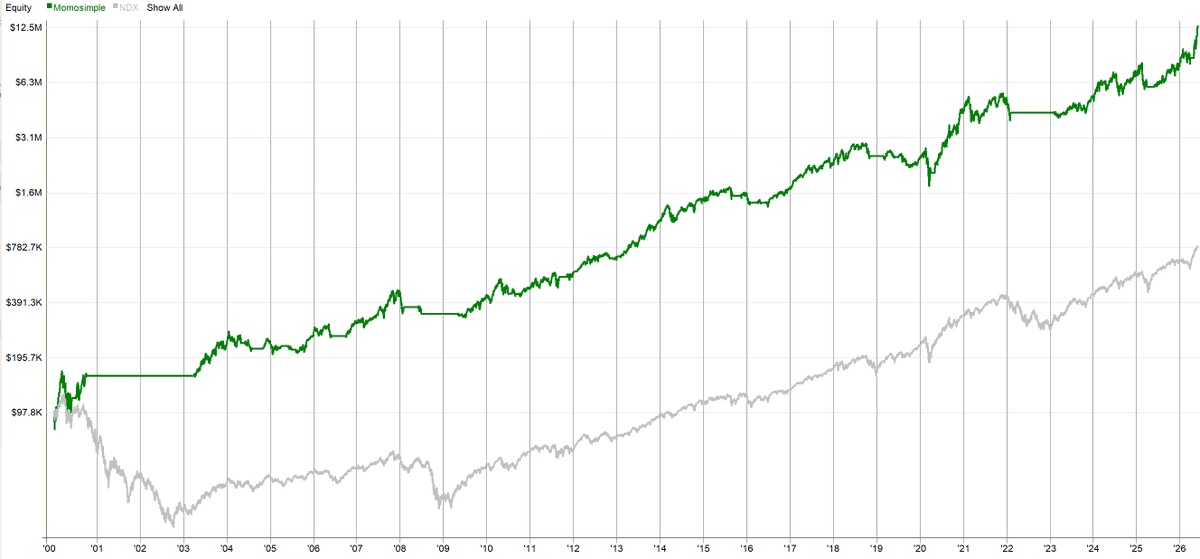
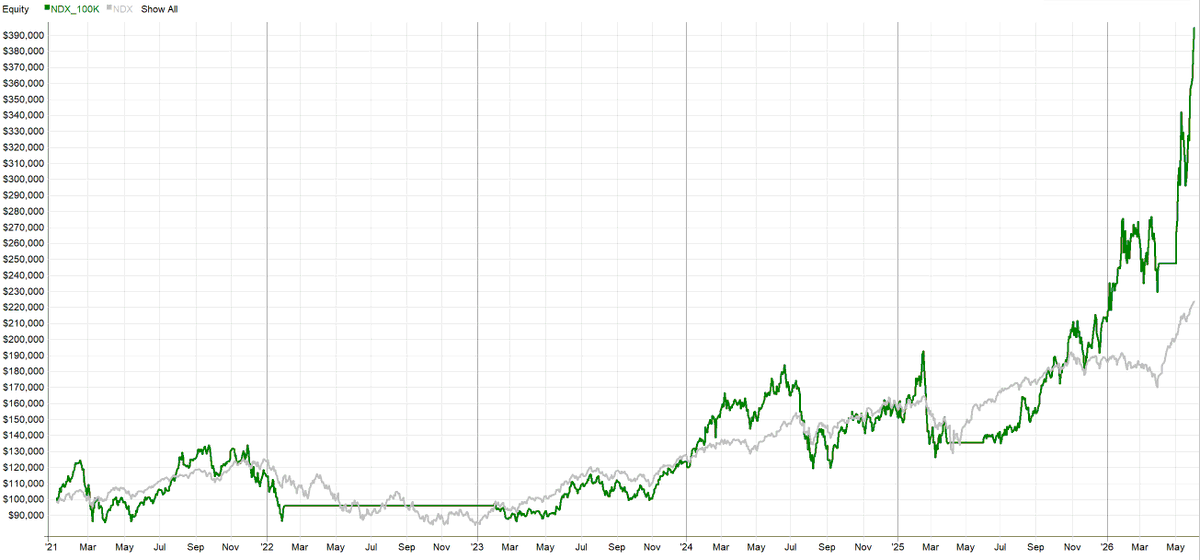
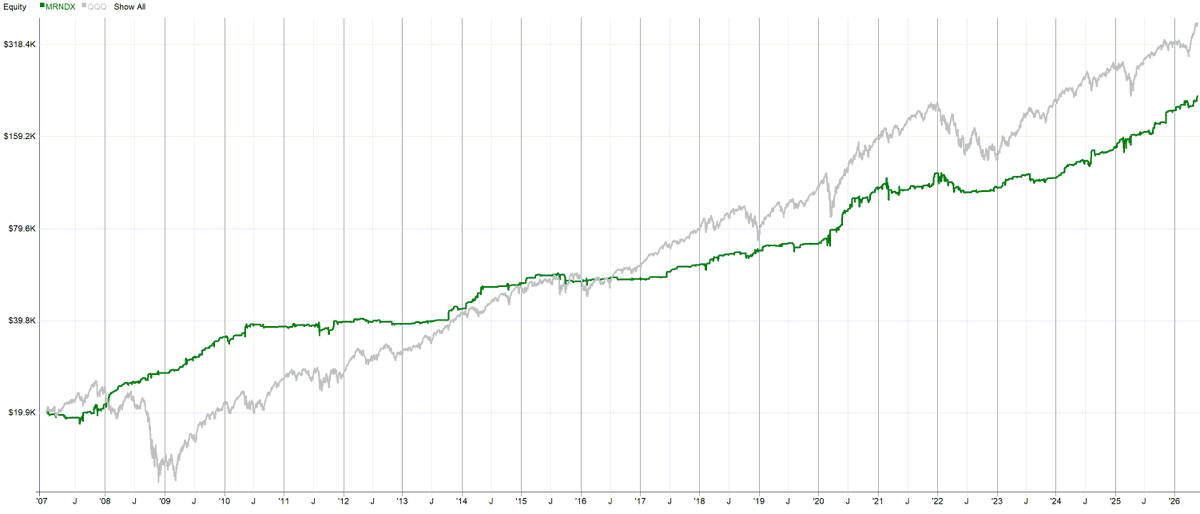
87.1% with roughly -17% drawdown in 6 months.
Markets are WILD.
This is the same NDX rotational momentum strategy I trade live, but shown here without volatility targeting.
And look at the distance it creates versus simply buying and holding NDX.
The idea is not complicated:
- Every month it ranks NDX stocks by past momentum.
- Something simple like ROC(C,250).
- If NDX is above MA200, it buys the top 5 momentum stocks.
- Holds them for one month.
- Then rotates again.
That is it.
Just systematic exposure to the strongest names while the index is in an uptrend.
Personally, I volatility-target and cap the positions in live trading, because concentrated momentum can be brutal when it reverses.
But this is the point:
In strong momentum regimes, simple rotation can create serious benchmark separation.
The rule itself is not the hard part.
The hard part is accepting that the same logic which looks obvious after a 87% run can also look uncomfortable, concentrated and wrong while you are actually trading it.
3
2
51
3,986
Volatility targeting sounds boring until momentum goes vertical.
I use it in my monthly rotational momentum system.
In calm markets, each stock can get up to 20% of strategy capital.
But when a stock becomes too volatile, the allocation gets smaller automatically.
After yesterday’s rotation, my US stock momentum exposure became surprisingly small.
The top NDX momentum names are now so volatile that the system allocated only roughly 1/3 of the planned capital to them.
This is both good and bad.
Good:
If a drawdown comes after the hyper growth, the system is already de-risked. Smaller positions mean the portfolio gives less back.
Bad:
If the melt-up continues, the system participates with smaller size and makes less than it could have.
That is the trade-off.
Many traders want maximum exposure when everything is flying.
I prefer to reduce size when the crowd feels most confident.
Because my goal is not to squeeze every last dollar from a move.
My goal is to keep the portfolio stable enough so I can keep trading the system through the ugly periods.
That is why I volatility target my positions.
Current stats and opened positions:
crackingmarkets.com/ndx-mome…
4
2
55
4,192
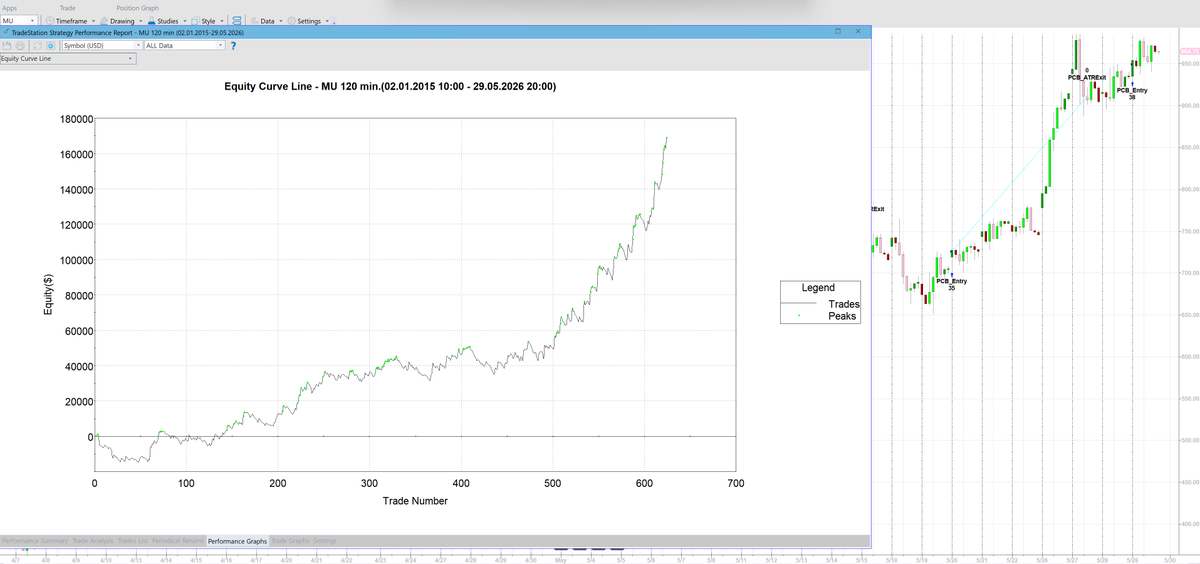
May was a strong month for my long US stock momentum systems.
What made it interesting?
It was the first live trading month for my long Donchian breakout system on US stocks that I shared here - and it caught names like $MU during a powerful momentum move.
Could I have made more by simply holding MU?
Yes.
But that is not how I want to trade.
Parabolic moves look amazing on screenshots, but nobody rings a bell before the reversal. My job is not to catch the absolute top. My job is to participate in momentum while controlling risk.
That is why I split my systematic momentum approach into two layers in this crazy environment:
Rotational momentum for longer-term exposure
Swing breakout overlay with intraday trailing stops for risk control
And no, trading MU last month was not survivorship bias.
The system does not start with “let’s trade MU because it worked.”
It works like this:
Dynamically build a universe of stocks already showing strong movement
Trade long Donchian breakouts on the top candidates
Rotate when better opportunities appear
May was a good reminder:
You do not need to predict which stock will go parabolic.
You need a process that can find momentum, enter it, manage risk, and move on when the edge shifts.
1
37
2,882
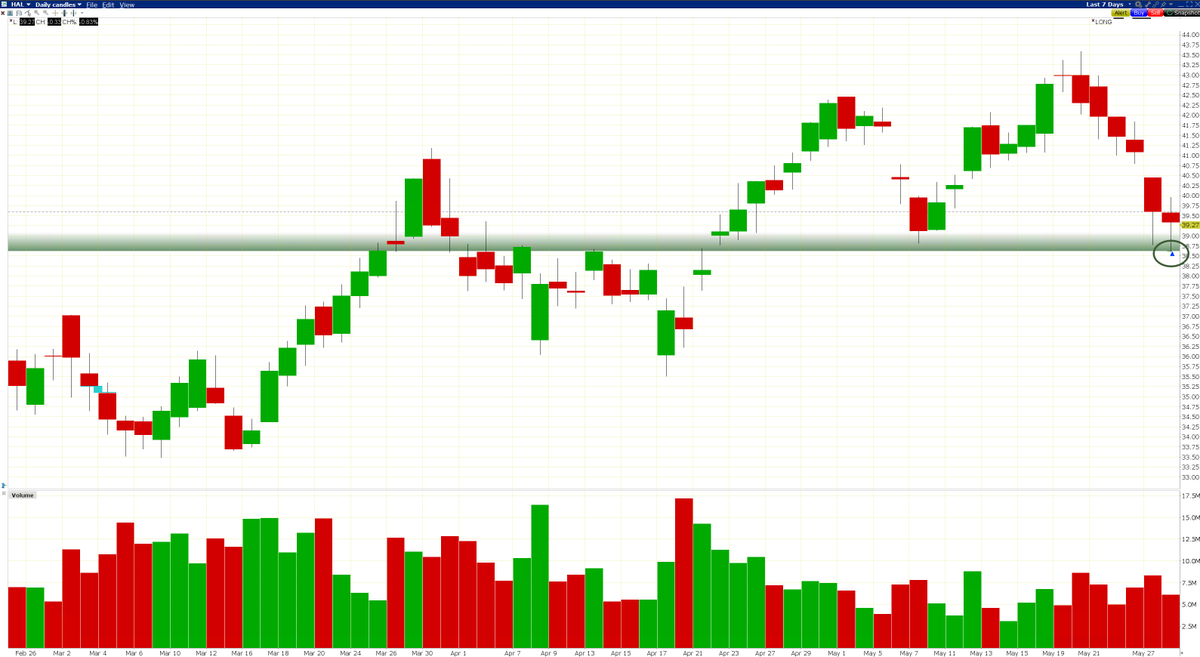
Looking at yesterday's long execution in HAL from my mean-reversion system, it reminded me how easy it is to create funny price action stories after the fact.
The entry sits right on a support/resistance area, so I could make it sound very smart:
price touched the level
market respected support
buyers defended the zone
perfect timing
clean reversal
Nice story.
But the reality is usually much simpler.
Sometimes markets turn around S/R.
Sometimes they slice through it like it is not there.
And the same chart can be explained 10 different ways after the move already happened.
This trade was not me reading the tape or seeing a magic level.
It was simply a systematic mean-reversion entry triggered by a z-score function.
Support may have helped.
Or it may be coincidence.
The important point is this:
Charts are great for context.
Rules are better for execution.
Ex-post stories feel good.
Mechanical entries keep you honest.
2
13
1,670
Opening Range Breakout is one of the most cited intraday setups.
I would not call it the best intraday strategy.
There are definitely better edges out there.
But I still think ORB is worth studying, because it is one of the cleanest ways to understand a basic intraday principle:
Use the open to define a reference area.
Then trade only if the market proves expansion outside that area.
Just:
define the price range - the high and low of the move inside the period
place the breakout orders
cancel the other side after the first fill
know the invalidation level
manage the trade mechanically
flatten by the end of the day
I tested a typical ORB baseline on NQ futures.
Data:
NQ continuous front-month
1-minute bars
RTH only
2012-01-01 to 2026-05-06
both long and short
one trade per day
no re-entry
zero fees
zero slippage
Rules:
The first X minutes after the US cash open define the opening range.
Buy-stop above OR high.
Sell-stop below OR low.
First fill wins. The other order is cancelled.
Initial stop = opposite side of the range.
Trailing stop ratchets by the OR range.
Exit at stop or EOD flatten.
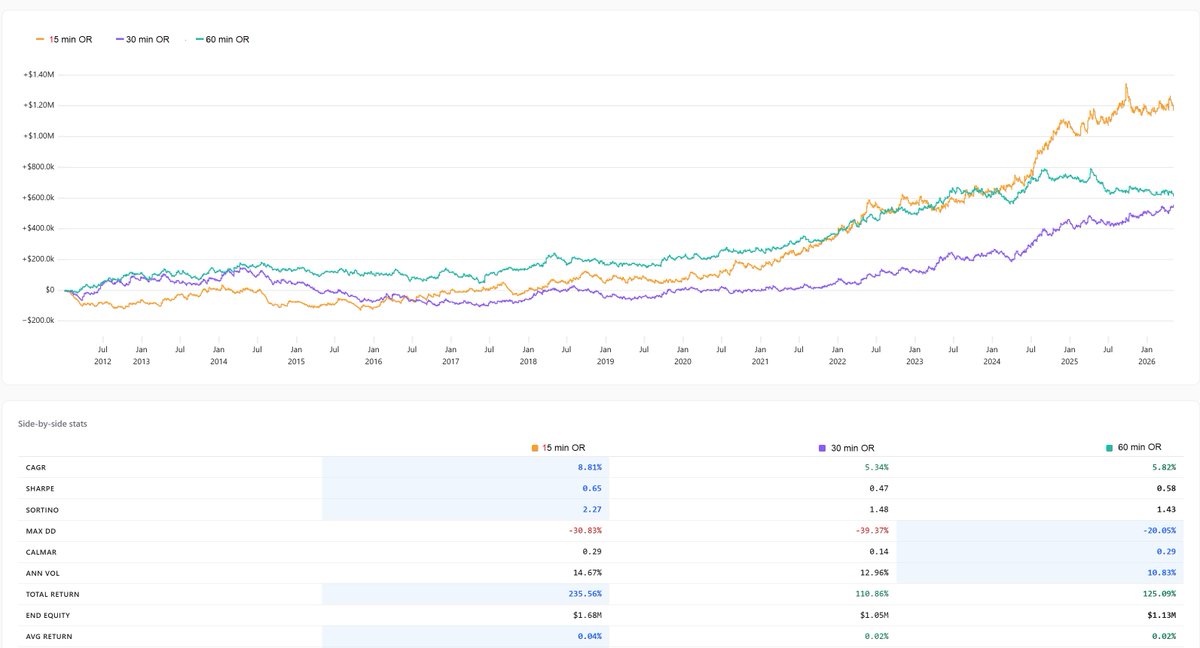
I tested 15 min, 30 min and 60 min opening ranges.
The interesting part:
The faster opening ranges seem to have more meat today than they had 10 years ago.
This is not a finished trading system.
It is more of a baseline to answer whether such a widely cited system as ORB could still be worth testing today.
And it still looks like a decent starting framework for intraday research.
The actual edge is probably in the details:
volatility regime and range filters.
Simple ideas are not automatically good.
But simple ideas are often the best place to start serious research.
5
6
83
9,115
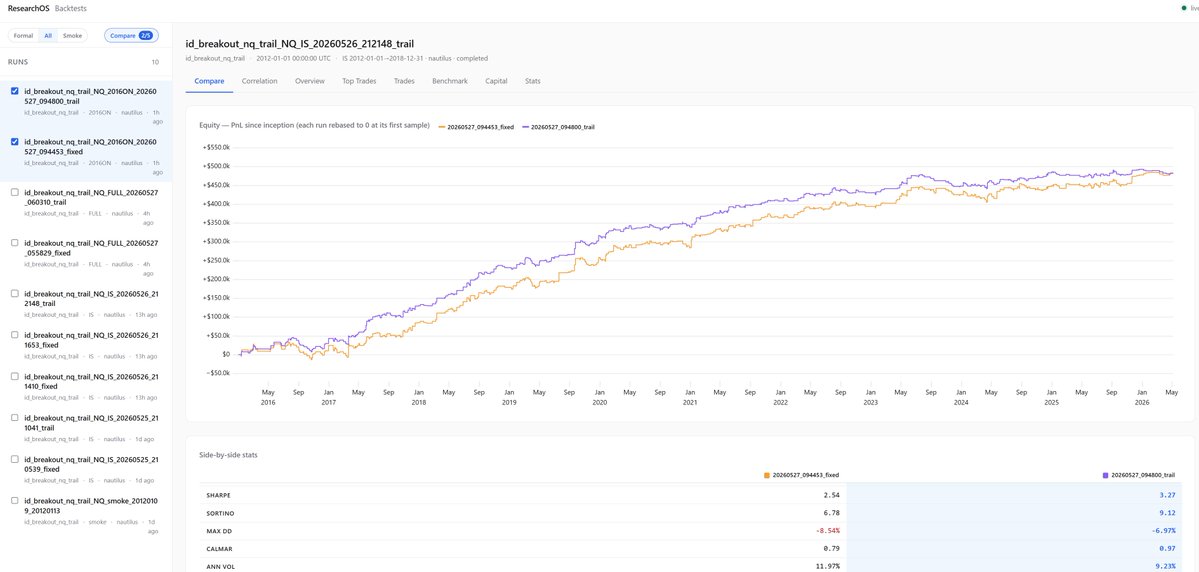
Finalizing my LLM research workflow around Nautilus Trader backtesting Databento data.
I have to say - it works better than expected.
Claude Code is surprisingly good at programming Nautilus Trader. The tests are fast, clean, and I am getting far fewer annoying implementation issues than I expected.
I also started building an analytical overlay on top of the backtest results, with tools for comparing backtests, showing trades, etc. And again - using an LLM makes this quite easy.
Basically, it is a small research website connected to Nautilus, where I can inspect individual trades, pull up full trade info, charts, context, and compare variants quickly.
Chart shows:
Intraday volatility breakout on NQ (fees and slippage included).
Orange - fixed SL EOD exit
Purple - trailing stop version
Very easy to compare variants now.
2
2
44
3,246
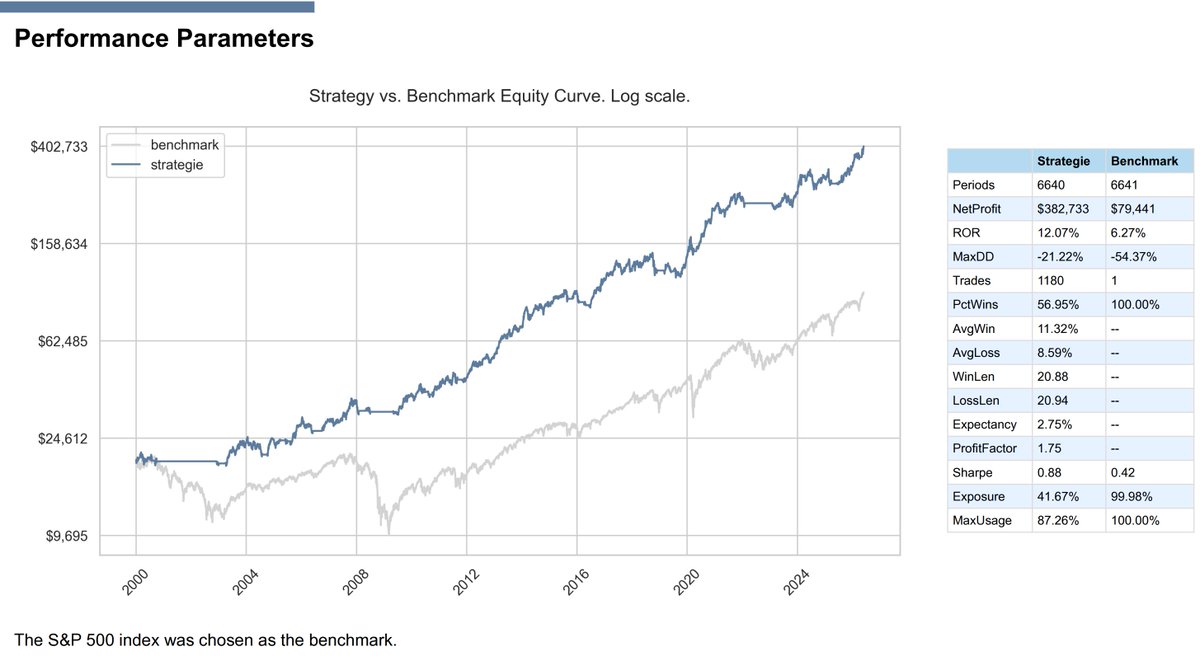
I also tried to find the one strategy that would beat the benchmark forever.
One clean logic.
One simple system.
One equity curve that solves everything.
But in real systematic trading, that is usually the wrong goal.
It is very hard to beat QQQ with a single logic, especially if you want something simple enough to have a chance to survive long term.
But you do not need a home run from one system.
This is a simple long mean reversion strategy I shared in full code on my blog:
Sharpe > 1
Win rate around 70%
Expectancy 1.17%
Average exposure only 9.15%
The last number is more important than most traders think.
Because if a system uses only 9.15% average exposure, it leaves capital available for other systems.
That means you can stack multiple simple edges instead of forcing one strategy to do all the work.
This is where systematic trading starts to make sense:
Not one holy grail.
But a portfolio of simple, real, testable systems that use capital efficiently.
You can try this one in the shared free backtester here:
crackingmarkets.com/buying-s…
2
6
69
5,222
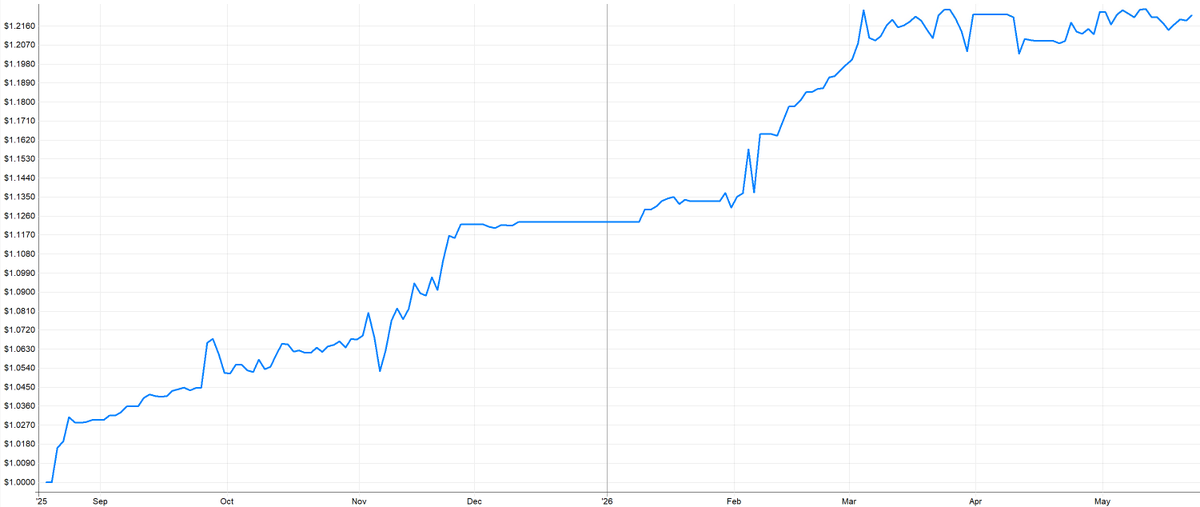
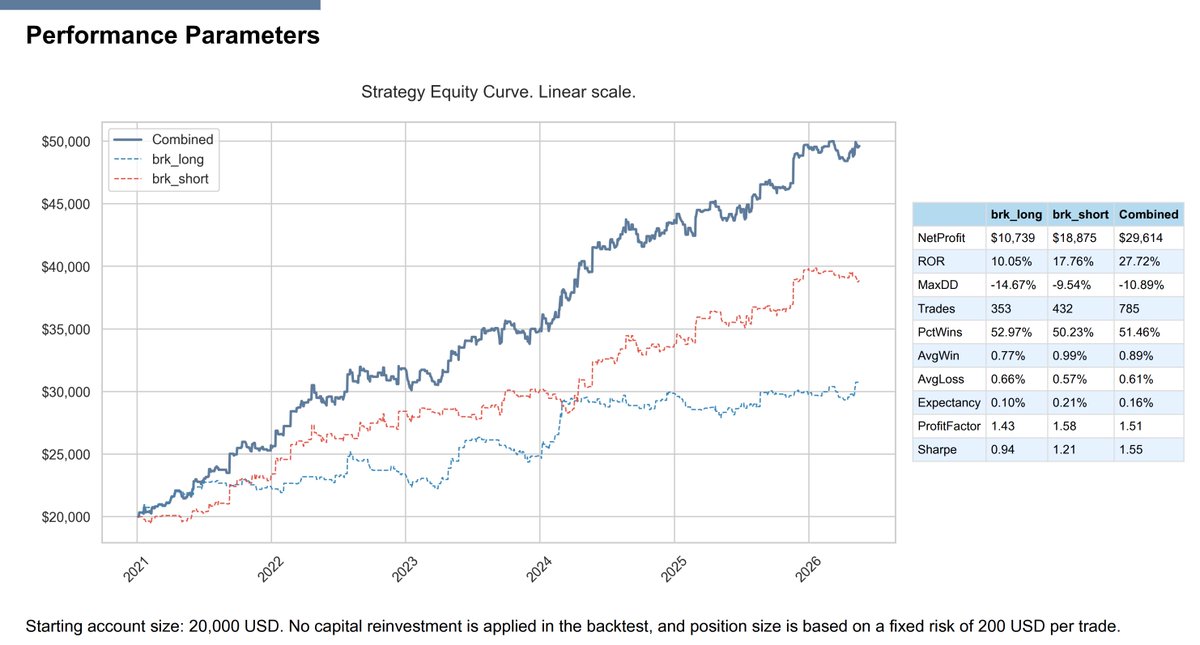
Working note from the live book:
This is the long mean-reversion sleeve of my stock reversal portfolio, exported from Interactive Brokers. US Canada stocks only.
Nice run from August to March, but the last few weeks the equity curve keeps hitting the same area and not expanding. Looks like a clear resistance zone.
That does not mean the edge is dead.
It means this sleeve is simply not the main portfolio driver right now.
Most of my current performance is coming from long momentum - especially NDX names - plus intraday breakout strategies. I am not complaining about the profits, but it is good to know where the P&L is actually coming from.
This is why I like running multiple systematic sleeves.
Mean reversion, momentum and intraday breakout do not need to perform at the same time.
The goal is not to find one perfect system.
The goal is to build a portfolio where different edges can take over in different market conditions.
1
1
26
2,181
Intraday trading can look excellent on paper.
But the real question is not:
“Is the backtest profitable?”
The real question is:
“How much of that profit survives live execution?”
This is why I personally trade intraday slower and mostly when volatility is higher.
Here is a real example from my live volatility intraday breakout trades, exported directly from Interactive Brokers.
Real trades.
Real fills.
Real slippage.
Real fees.
Fees alone are eating 10.5% of gross profit.
That is already close to the maximum I am personally willing to give away.
Now imagine taking the same idea and making it trade much more often.
The backtest may look smoother.
The equity curve may look more active.
The number of trades may look statistically better.
But live, the cost/profit ratio can quickly move from acceptable to dangerous.
This is how many profitable intraday paper strategies become losing live strategies.
Not because the idea was wrong.
But because the edge was too small relative to the true cost of execution.
At the same time, I do not agree with the blanket statement that “intraday trading is impossible for retail after costs.”
That is too simplistic.
Intraday is not one category.
A high-frequency strategy trading tiny edges is completely different from a slower volatility breakout strategy trading only when the market expands.
1
2
26
2,651
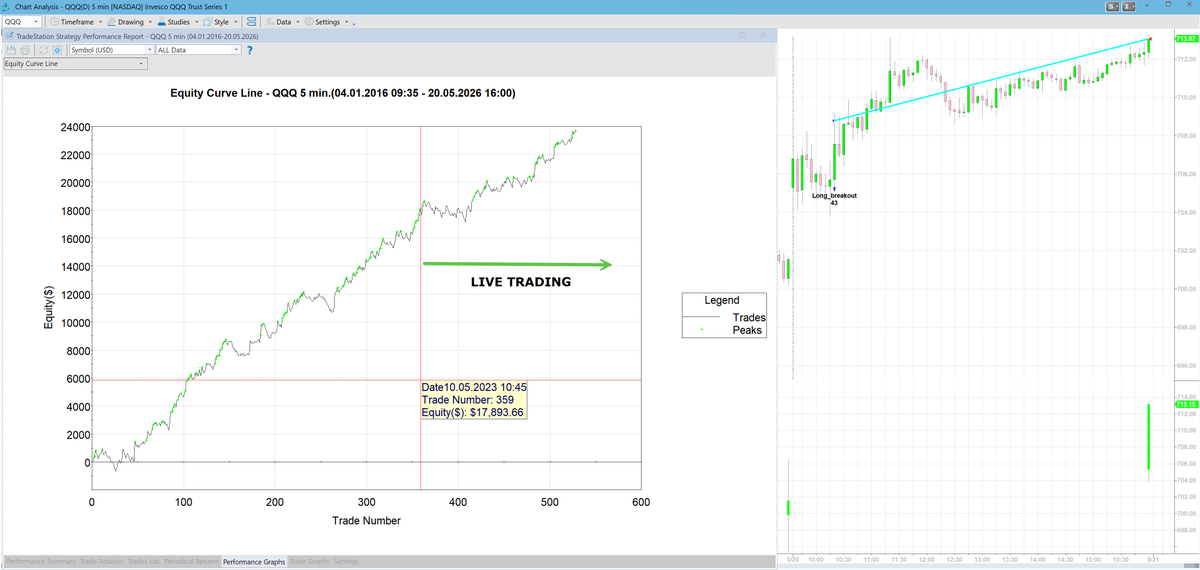
One of the biggest risks in trading is not that a simple strategy stops working.
It is that the trader cannot leave it alone.
My intraday volatility breakout is one of the few strategies I trade live and occasionally share in full code with others.
It now has 3 years of real out-of-sample live trading behind it.
And so far, the live performance is doing the main thing I really care about - behaving close enough to my prior tests.
The strategy is intentionally simple.
As with everything I trade, the edge is not in complexity.
But when I share this strategy with others, the usual reaction is almost always the same:
Can we make it trade more often?
Can we smooth the equity curve?
Can we remove the drawdowns?
Can we add another filter?
Can we improve the bad periods?
I understand the temptation.
But this is exactly where many traders destroy good systems.
Markets are not machines that reward perfection.
They reward robustness.
The more energy you spend perfecting a strategy on historical data, the more likely you are fitting noise, not edge.
Drawdowns are usually not a problem that needs fixing.
Low trade frequency is not always a weakness.
Ugly periods are not always a sign that the strategy is broken.
Sometimes they are simply the cost of having an edge that can survive outside the backtest.
Almost 30 years in markets taught me this:
- The simplest things usually work best.
- Not because they are perfect.
- Because they are harder to fool.
Accepting imperfections is one of the most underrated skills in trading.
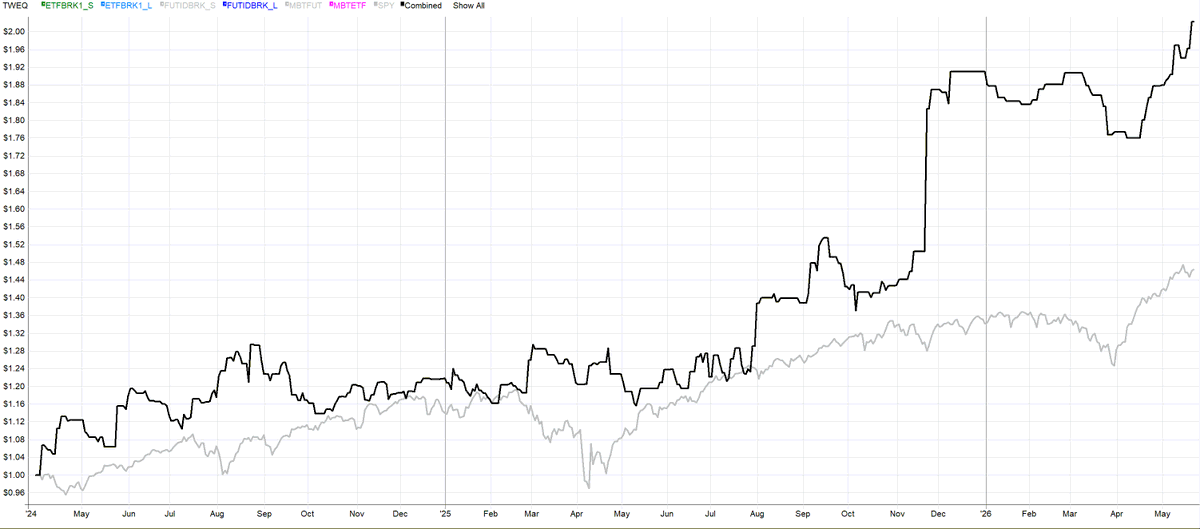
The equity curve on the screen is not marketing fantasy.
It is the same intraday volatility breakout I live trade, with the portfolio tracked daily on my blog where you can find the full stats.
$200 risk per trade, no compounding, IBKR fees applied.
5
9
103
6,445
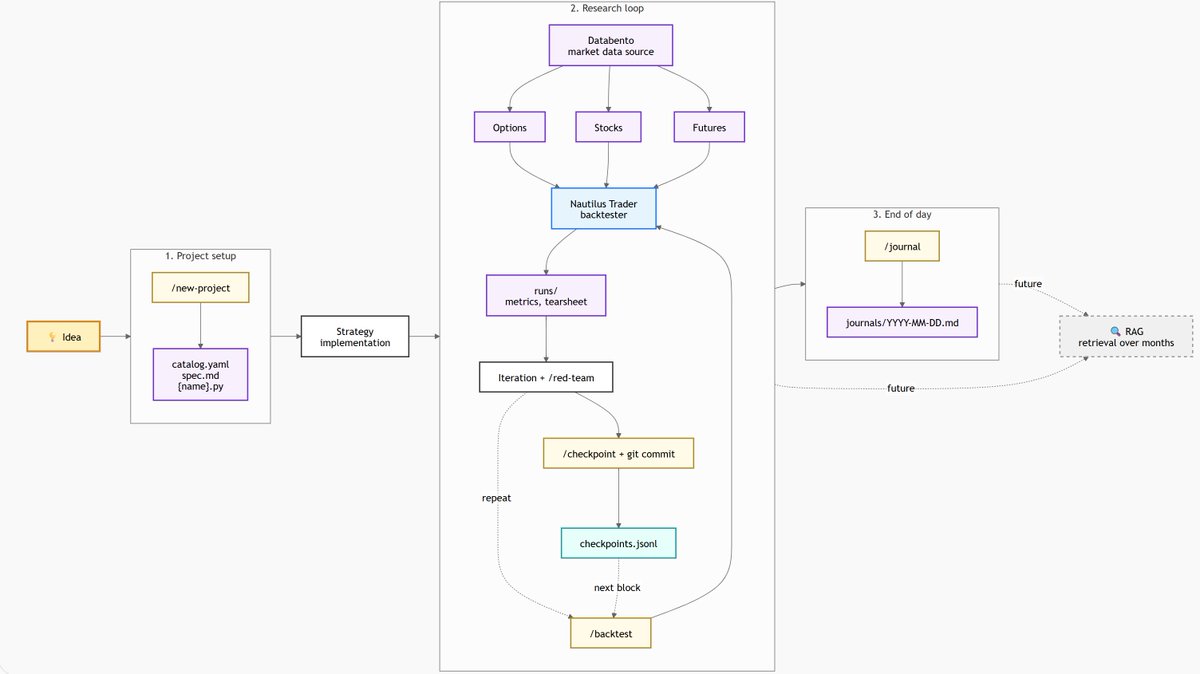
Made quite a lot of progress with my LLM research workflow by adding Nautilus Trader Databento.
Not as “LLM hunting for the holy grail”.
I, as the trader, still define the idea, market, rules, constraints and invalidation criteria.
The LLM helps compress the research loop:
idea
-> project spec
-> Databento data prep
-> Nautilus backtest
-> metrics tearsheet
-> red-team results
-> checkpoint git commit
-> journal
-> next iteration
It is forcing every idea through the same process and journaling everything.
Nautilus Databento is quite powerful and can backtest in hours what would otherwise take me weeks to research.
I am now comfortably running backtests of orderflow patterns, futures, stocks, options and even options strategies - including combinations with futures/stocks.
Execution is not in this workflow yet. We still execute with in-house Python scripts.
But for research, the speed difference is massive.
What used to take me weeks can now become a structured research session.
And I am especially happy that I can onboard my research team members into the same workflow, which should make everything much more efficient.
3
4
25
2,290
Hard to short indices in this environment.
And yet, even the short leg of the volatility breakout system is still holding up.
You do not need every trade to work.
All it takes is being positioned correctly on the few days when the market finally expands.
One strong breakout day can move the equity curve significantly.
That is why the real skill is not prediction.
The real skill is patience - and placing the orders when they are supposed to be in the market.
The basic principle behind the idea is simple:
Open as reference price
If the market is volatile enough
Long trigger = Open ATR
Short trigger = Open - ATR
Small protective stop
No trailing stop
Exit at the end of day
Nothing sophisticated.
Just a simple volatility breakout I live trade and track publicly on my blog.
Simple systems often fail because traders stop executing them before the important day arrives.
2
4
36
3,267
21 years with Interactive Brokers.
At this point it is basically a trading marriage.
I am not sure there is any other service I have used for this long.
3
1
34
2,398