
28,834 Photos and videos


Gave my longs real time BEFORE the move.
Am I credible? Or just incredible 😉
$nq

Does selling courses make you lose credibility
1
4
2,624

📊 Market Psychology
The strongest information Friday wasn't the selloff.
It was the recovery.
Everyone saw the flush.
What matters is what happened afterward.
The market tested lower.
The market rejected lower.
Now the market is determining whether buyers have enough conviction to build acceptance higher.
That distinction matters.
Because markets don't trend when participants agree.
Markets trend when one side runs out of conviction.
Today's battle is no longer about the lows.
It's about whether buyers can transform a powerful recovery into sustained acceptance.
$ES $NQ
4
274
📖 Education: Acceptance vs Price
One of the biggest misconceptions among traders is believing every move matters equally.
It doesn't.
What matters is acceptance.
Imagine a store running a temporary sale.
A product drops from $100 to $50 for ten minutes.
Then buyers immediately purchase everything available and the price returns to $100.
What was the true value?
Probably closer to $100.
The brief excursion lower wasn't accepted.
Markets function similarly.
Today's drop into the lows was a test.
The market asked participants:
"Are these lower prices attractive?"
The answer appears to have been no.
Buyers responded aggressively and value shifted back higher.
That doesn't guarantee higher prices.
But it does provide information about where participants currently disagree with value.
Understanding that distinction separates professional auction analysis from simple chart watching.
7
255
Iran war peace deals EVERY day. And we want to be bearish?! /s 😂

1
3
323
I'm starting a thread on useful things I tweet about market profile
#marketprofile
41
37
214
The "Holy Grail" of trading is a High Win Rate, High Reward trading strategy
Maximizing win rates and managing risk is key in trading.
High win rates with high rewards lead to substantial profitability over multiple trades, while low rewards may limit gains even with a high win rate.
Conversely, low win rates with high rewards can still result in profits, albeit with larger drawdowns.
Understanding this balance is crucial for success in trading
My ideas of the holy grail of trading.
What do you think is the holy grail? 🤔
1
301
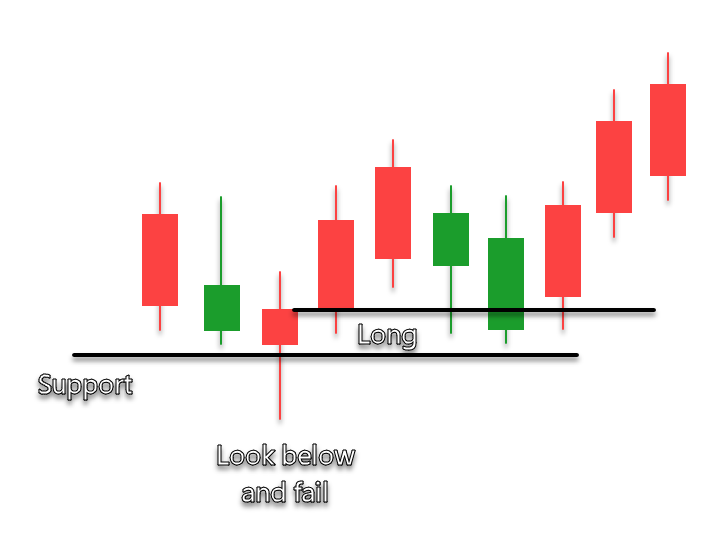
How to Trade the "Look Below and Fail" Setup: A Breakout Trading Strategy Guide
In trading, identifying moments when market participants fail to sustain a move is a powerful strategy. The "Look Below and Fail" setup, also known as a failed breakdown or a "drop and pop," capitalizes on failed attempts to drive price lower. In this setup, the market breaks below a key support level, seemingly indicating a further bearish move, only to sharply reverse back above that support level. This setup reveals that sellers were unable to maintain control, resulting in a shift in momentum favoring buyers. When traded correctly, this setup can offer substantial profit potential and a favorable risk-to-reward ratio.
Understanding the Concept
The "Look Below and Fail" is a classic price action setup that reflects market psychology in real time. When price breaks below a key support level, it signals that sellers are taking control, potentially setting off panic selling or triggering stops of traders who had long positions. This momentary breakdown attempts to "flush out" weak holders and bring in new sellers. However, if price cannot sustain this move and instead rallies back above the broken support level, it suggests that selling pressure has run out, and buyers are stepping in.
This phenomenon can be attributed to two main factors:
1. Exhaustion of Sellers: The initial downside movement attracts sellers, but once they are exhausted, no new significant selling emerges to continue pushing prices down. This gives an opportunity for buyers to regain control.
2. Aggressive Buying: Once the market reverses back above support, it often attracts aggressive buyers who see the failed breakdown as a buying opportunity, knowing that the recent sellers are now trapped and may be forced to cover their positions.
Key Elements of the Look Below and Fail Setup
To successfully trade this setup, it is important to identify the following elements:
1. Key Support Level: The setup starts with identifying a key support level. This could be a prior swing low, a well-defined horizontal support, or even a moving average acting as support.
2. Break Below Support: Price breaks below this level, suggesting a bearish move. This break often triggers sell stops and attracts breakout traders looking for further downside.
3. Reversal Back Above Support: After breaking below, price fails to continue lower and quickly reverses back above the support level. This is the key signal that the bearish move has failed.
4. Strong Rejection and Momentum: The reversal should be accompanied by strong buying momentum. The stronger setups often do not linger below support but rather reverse sharply.
How to Trade the Look Below and Fail Setup
1. Identify a Key Level
- Begin by marking out well-defined support levels on your chart. Look for prior swing lows or areas where price has bounced multiple times, signaling a significant level that market participants are watching.
2. Wait for the Breakdown
- Allow price to break below the key support level. Do not jump in immediately. Observe how price behaves below this level. If it lacks follow-through and shows signs of hesitation, it could be setting up for a reversal.
3. Watch for the Reversal Signal
- The critical part of this setup is waiting for price to move back above the broken support level. A strong bullish candlestick pattern, such as a bullish engulfing or hammer, can confirm the reversal.
- Volume can also be a useful tool. An increase in buying volume during the reversal indicates strong participation from buyers stepping in.
4. Enter the Trade
- Once price has reclaimed the support level, consider entering a long position. Ideally, the entry should be as close to the reclaimed support level as possible to minimize risk.
5. Place a Stop-Loss
- Set a stop-loss below the recent swing low, where price briefly traded below support. This ensures that if the market turns back down, your loss is limited.
6. Set Profit Targets
- The first profit target could be the recent high prior to the breakdown. If the reversal has strong momentum, you can aim for a higher target, potentially using Fibonacci extensions or other key resistance areas.
- For stronger setups, the "Look Below and Fail" can lead to significant upside momentum, especially if the failed breakdown traps many short-sellers who are forced to cover their positions.
Examples and Tips for Trading the Setup
- Failed Breakdown in Trending Markets: The "Look Below and Fail" is particularly powerful in trending markets during pullbacks. For example, in a bull trend, a key support level might be tested and momentarily broken, only to see a strong reversal back up, signaling the trend is still intact.
- Avoid Choppy Markets: This setup works best when the market has clear levels of support and resistance. Avoid trading this setup in choppy, sideways markets where breakouts and breakdowns tend to fail repeatedly without follow-through.
- Confirmation is Key: One of the most common mistakes traders make is trying to predict the "Look Below and Fail" without waiting for confirmation. Always wait for price to move back above the key level and show strength before entering a trade.
Risk Management Considerations
The "Look Below and Fail" setup provides a clear structure for managing risk. The entry is taken as close to the reclaimed support level as possible, and the stop-loss is placed just below the recent swing low, which means the risk is defined and limited. Additionally, traders can adjust their stop-loss to breakeven once price begins to move in their favor, thus minimizing potential downside.
It's also important to use proper position sizing and to avoid over-leveraging, as even the best setups can fail in unpredictable market conditions. Always be mindful of broader market trends and key economic events that could affect price behavior.
Final Thoughts
The "Look Below and Fail" setup is a strategic approach to trading failed breakdowns, capitalizing on moments when sellers lose control and buyers step in aggressively. By waiting for confirmation that price has reclaimed a key support level, traders can position themselves to profit from the reversal and potential upside breakout. As with all trading strategies, patience, discipline, and sound risk management are crucial for success. Remember, the strongest "Look Below and Fail" setups will trigger a swift move to the upside, often catching sellers off-guard and creating momentum that traders can exploit.
1
2
31
3,923


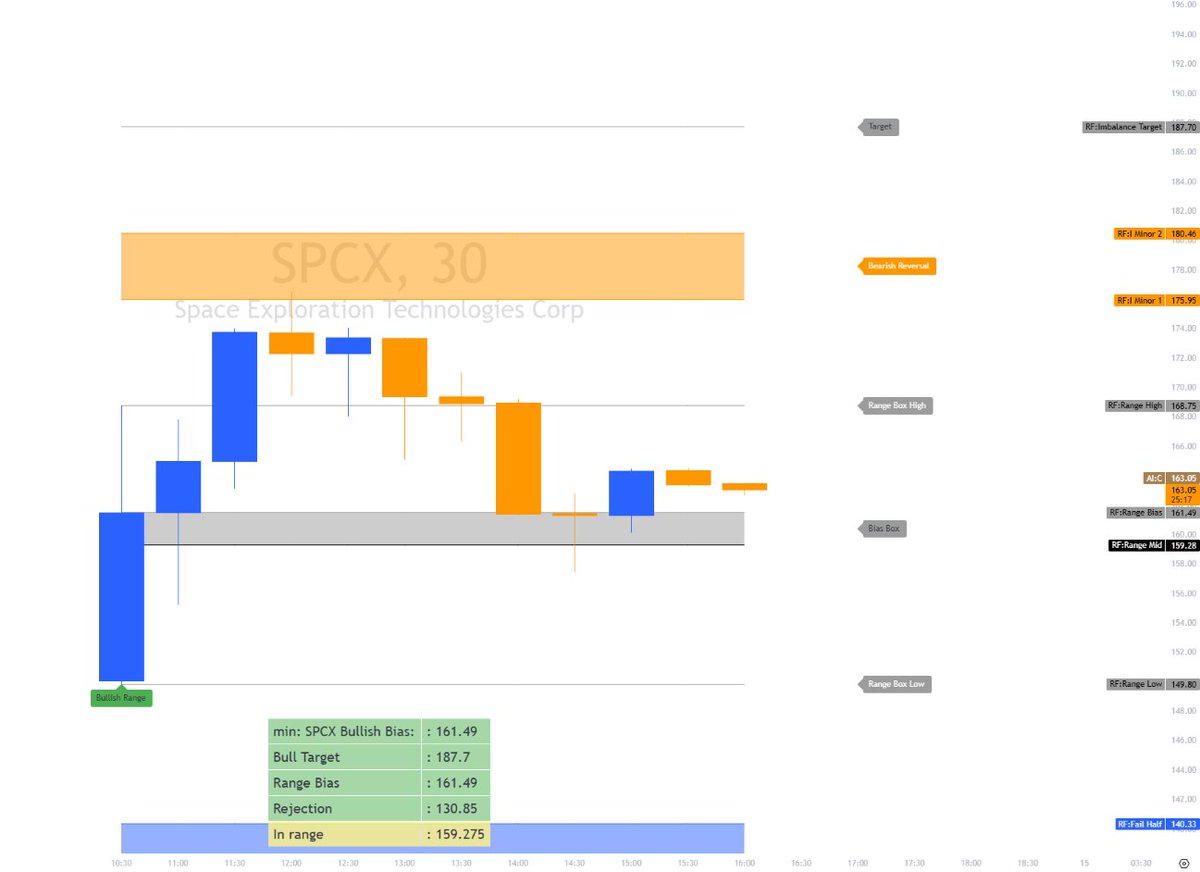
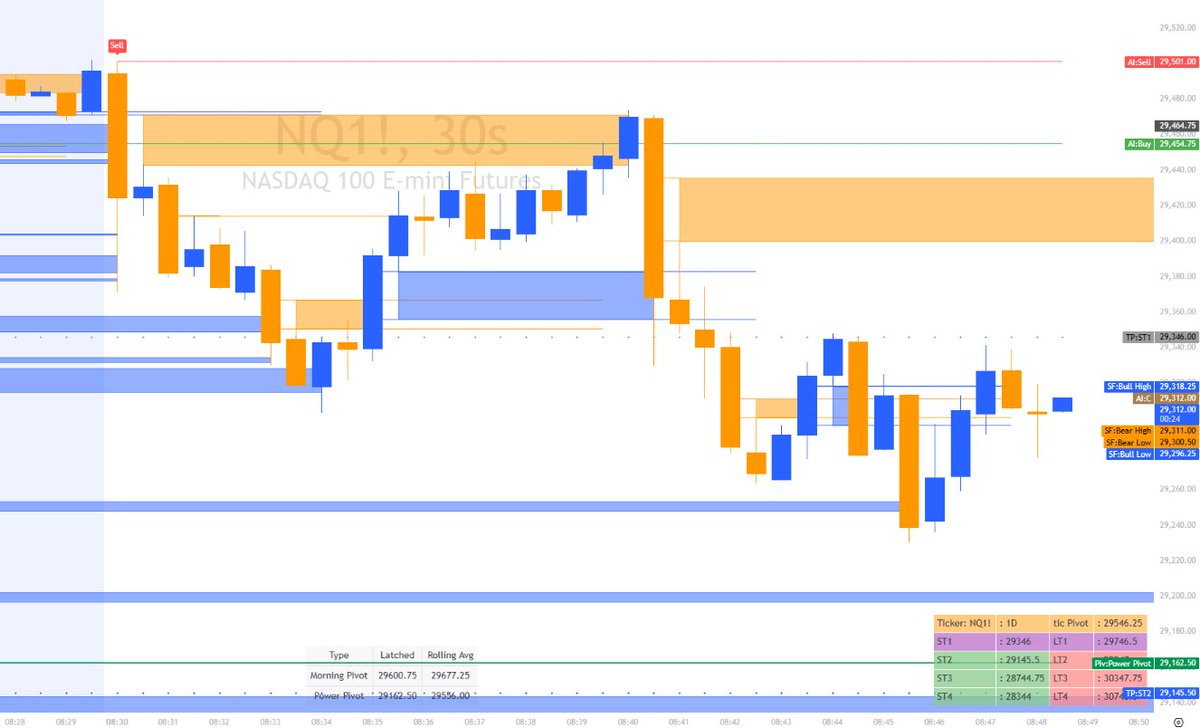
A lot of traders misread breakdowns in real time.
Here’s what actually happened in this move today.
Price broke lower and dipped into the lows, enough to trigger stops and create the appearance of a breakdown.
But what most people miss is what happens next:
A real breakdown doesn’t just trade lower.
It builds acceptance below value.
That means:
sustained selling
continuation momentum
new participants joining the downside auction
That didn’t happen here, at first, it came later.
Instead, price first entered a “search phase” at the lows, it dipped, stalled, and failed to attract strong sellers willing to extend the move.
That’s the first clue the breakdown was premature.
When price cannot find new sellers, the auction cannot migrate value lower. It simply sweeps liquidity and rotates back into balance.
That’s exactly what happened.
You also saw a new low of day form, which often looks bearish on the surface, but in game theory terms, that level becomes a liquidity target rather than a continuation signal.
Once that liquidity is taken, short positioning gets reduced or covered, because the objective (lower liquidity) has been fulfilled.
That shift creates the rotation back upward.
The important nuance is the “halfway reaction” after the bounce.
Price attempted to recover, but stalled mid-range instead of fully reversing. That tells you something very specific:
buyers were not fully in control
sellers were already exhausted
the market was still inside unfinished balance
So instead of trend reversal or breakdown continuation, you get rotation inside unresolved structure, THEN the continuation move later.
The key takeaway:
A breakdown is not defined by price moving lower.
It is defined by whether the market accepts lower value.
Without acceptance, there is no continuation, only liquidation and rotation.
Hit like if this clears things up for you.
$ES $NQ

1
1
11
1,529


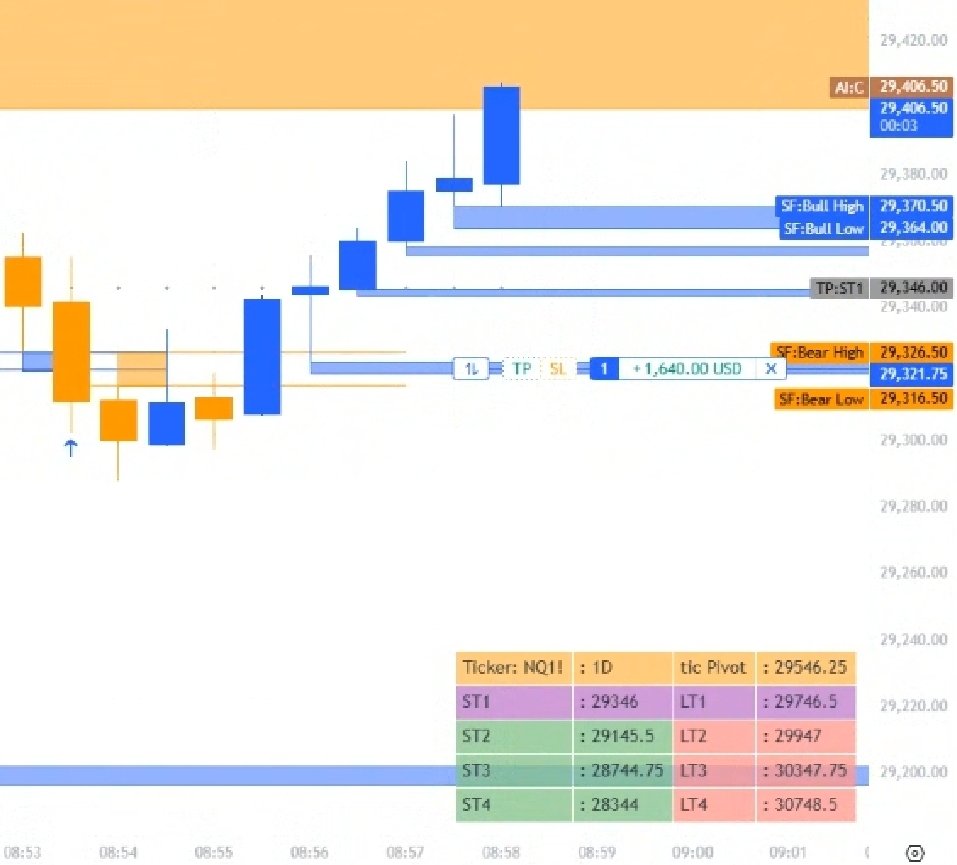
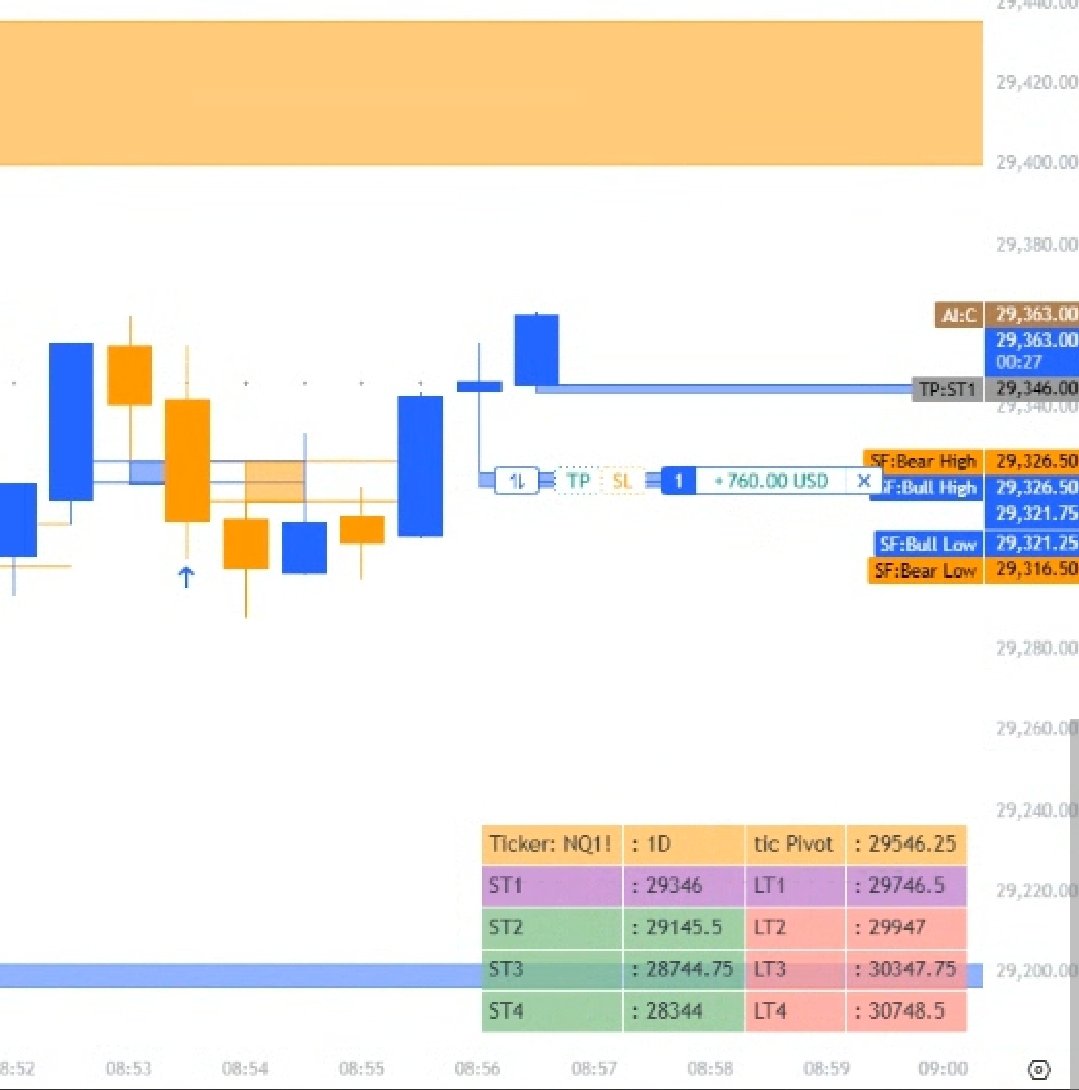
Gave my longs real time BEFORE the move.
Am I credible? Or just incredible 😉
$nq
Does selling courses make you lose credibility
1
4
2,624
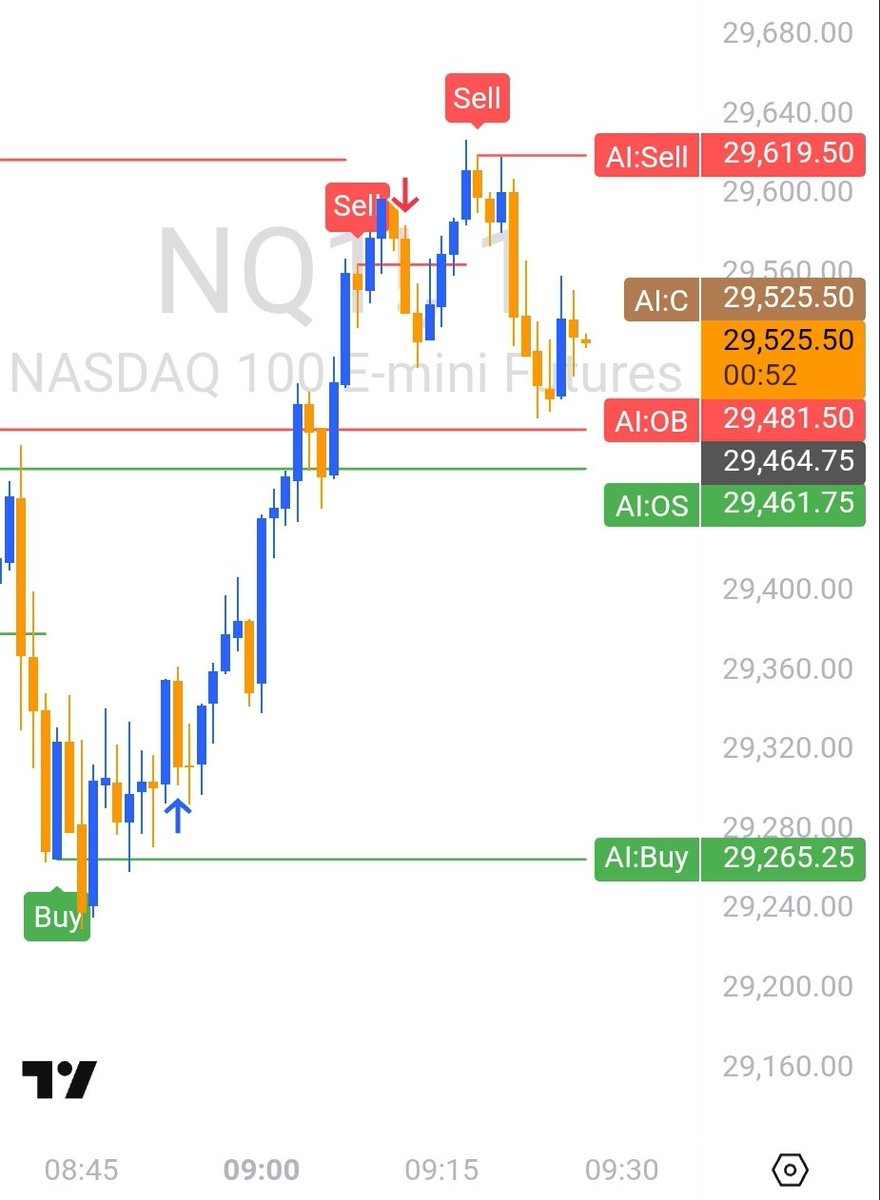
The tools aren't "magic".
It's an algorithm built on math, auction theory, and game theory designed to identify potential shifts in market control.
Buyers take control.
Sellers take control.
The tool helps highlight those moments and provide objective reference points for decision making.
This morning's $NQ session is a pretty good example. 🔥
If that's something you'd like in your own trading, send me a DM. 🐶
1
1
740
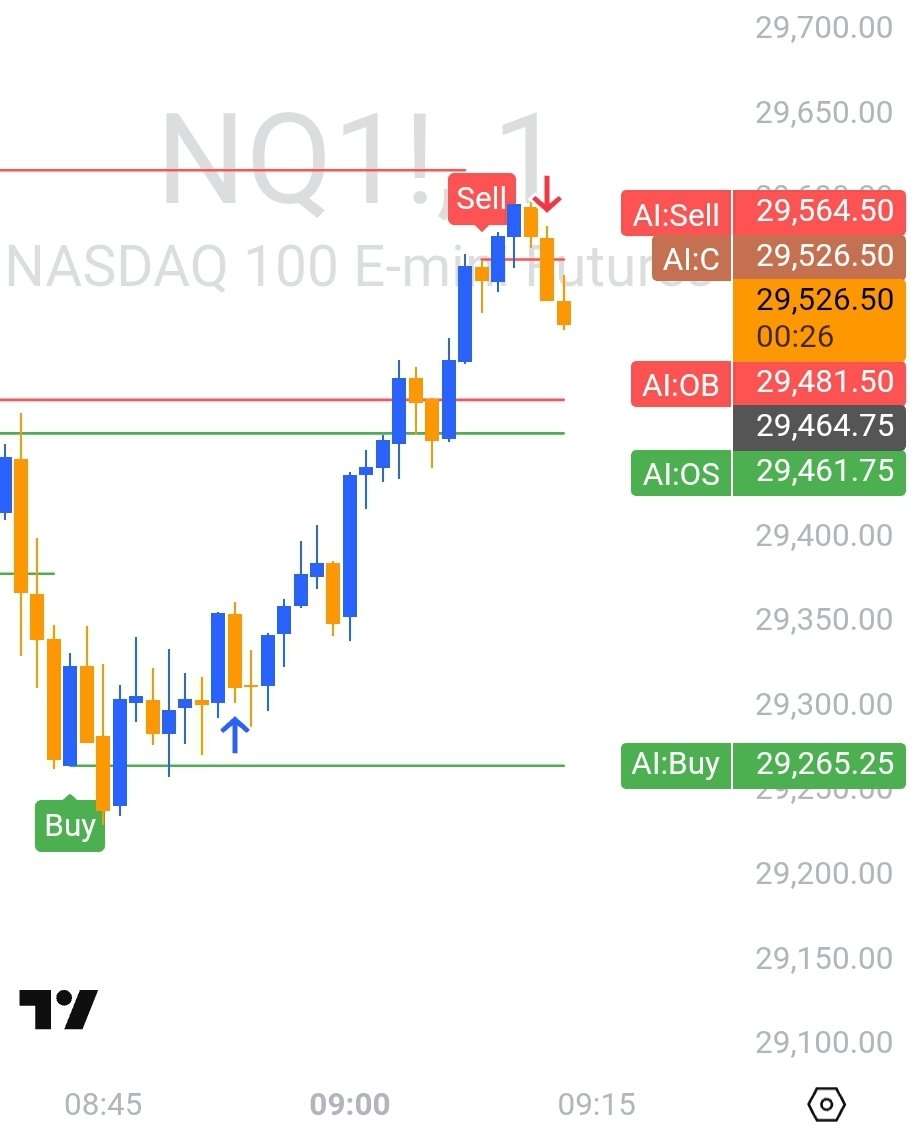
Gave the longs. HUGE rally
You do not want to miss these
Join lifetime membership and skip the subscriptions
One payment for a lifetime of value
theoryaffinity.com/purchase-…
1
111