SBO - Investor - Community leader - Jiujitsu
Joined December 2013
- Tweets 9,917
- Following 1,420
- Followers 5,739
- Likes 39,450
3,482 Photos and videos


Pinned Tweet

23 Oct 2023
People are funny …
You can spend a lot of time and energy speaking about things that have helped you build personal value and financial independence and people will say…
“prove it”, “show, don’t tell” or “he’s all talk” etc.
Then you start showing people and they will say things like “he’s an asshole”, “he’s just bragging now”, “why should we support you if you don’t need it”… 😂
If you are making content to truly help people then be ready for negativity cause it does not matter how genuine you are about it, it will come.
Also understand you are never good enough for everyone and hurt people, hurt people.
You can give it all away and people will say you didn’t give enough or to the right people or at the right time…
I guess what I am trying to say is, make sure you are doing what you are doing in life for the right reasons and believe in yourself cause I promise you… most of “them” don’t.
#IBCGang #contentcreators
22
14
96
18,812
May 1
I still remember… ❤️
#Cosmos #cosmosecosystem @StargazeZone @cosmos #NFT #NFTs #art #music #community
7
31
847
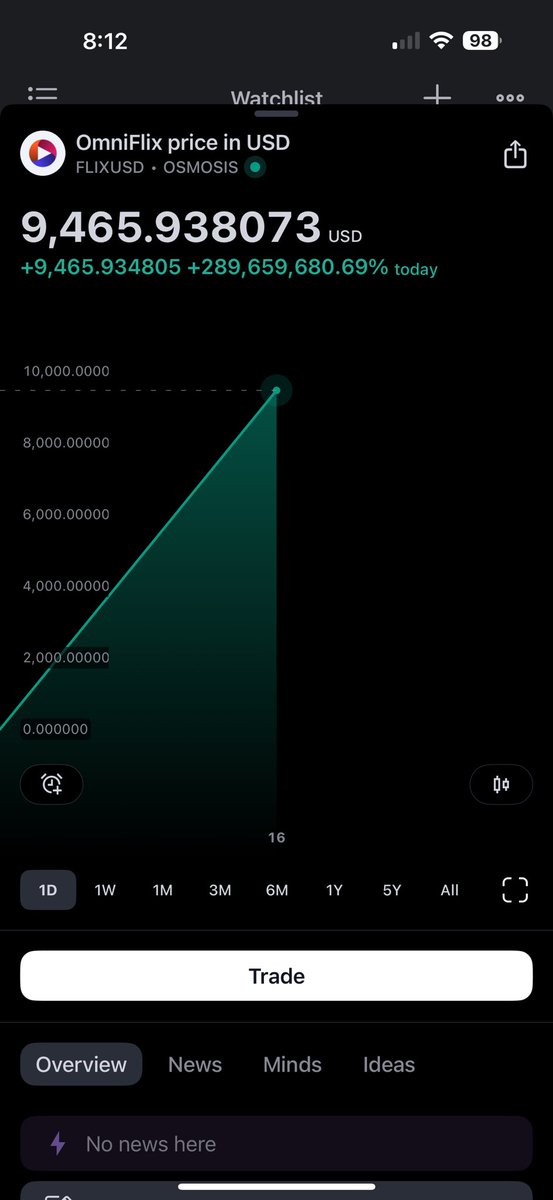
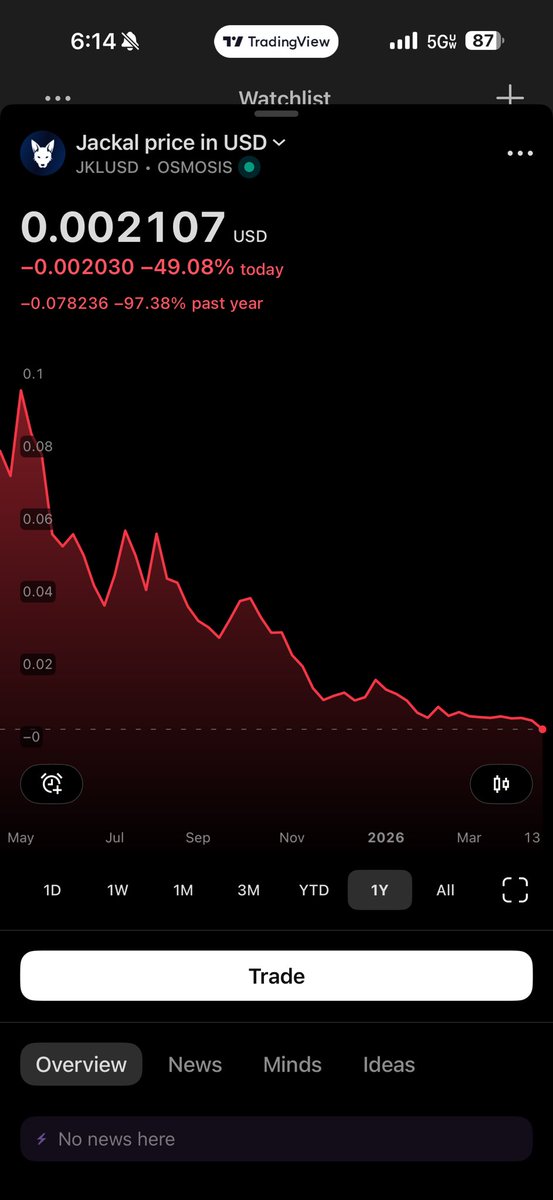
Apr 23
Dang…
Was actually crossing my fingers and toes for this one to survive, not because of any kind of financial reason but, because they had a good idea/project
To infinity and beyond gentlemen ✊
@Jackal_Protocol #crypto #blockchain
6
37
2,005
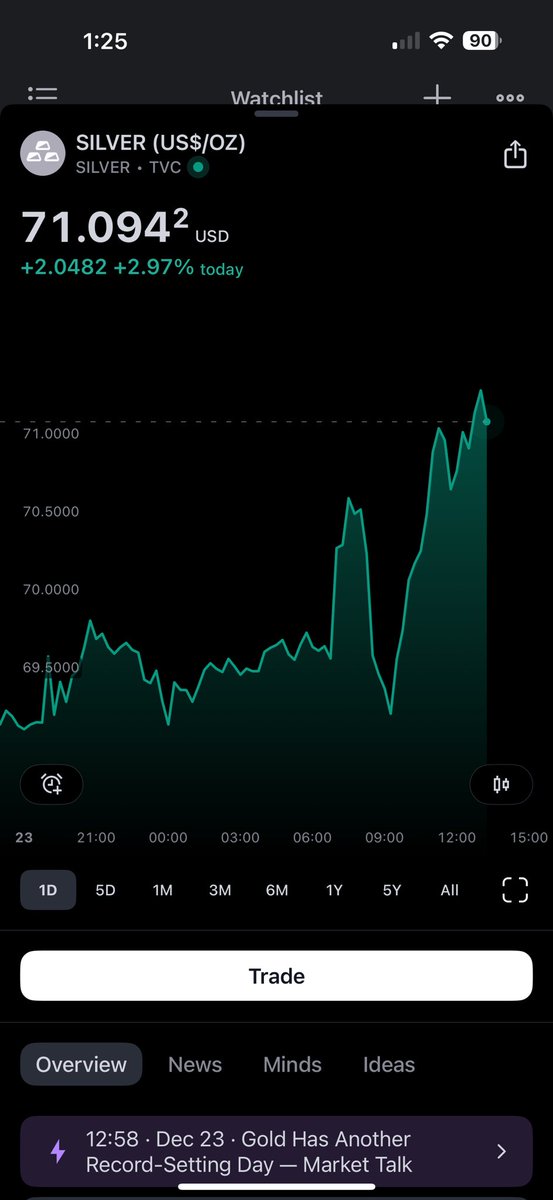
23 Dec 2025
Sitting here watching people that I consider friends and or at least close associates still talk about Cosmos drama…
Meanwhile, I’ve been sitting here enjoying my precious metal calls like #silver and $PAAS.
I hope y’all been listening and paying attention
#PreciousMetals #Investing #Money
1
2
204
23 Dec 2025
White belts usually over complicate things (totally normal and expected) but it’s really not that hard….
Just SMASH!
😅👍
#JiuJitsu #grappling #wrestling #MartialArts
102
16 Dec 2025
Received a few DMs asking where I have been…
Guess you could say that I have been touching grass 😅
#investing #outdooradventures
253
8 Dec 2025
The short answer to your questions ( I can provide the Long form and details if you want )…
1. Where ATOM’s Sell-Pressure Comes From
•Main source: Inflation → staking rewards.
~48M new ATOM/year (~10% inflation), though only a fraction is actively sold.
•Validators & large delegators sell some rewards for expenses → structural sell-pressure.
•Community-pool spending and team distributions cause minor additional sell-pressure.
2. Where Buy-Pressure Comes From
•Speculators buying on exchanges.
•Stakers seeking ~13–16% APR.
•Liquid staking demand (Stride, pSTAKE).
•Cosmos DeFi use (collateral, LPing).
•Protocols using ATOM for security (ICS consumer chains).
Protocol-level revenue today is tiny — it’s not a meaningful source of buy-pressure yet.
3. How ATOM Actually Flows Today
Three main behaviors:
1.Traders: Buy → hold → sell (no utility).
2.Stakers: Buy → stake → sell part of rewards.
3.DeFi users: Buy → use as collateral/governance → rotate out.
Most ATOM buyers eventually sell some or all of their rewards, creating a recurring dribble of sell-pressure.
⸻
4. How Much Revenue Would Actually Matter?
Right now inflation costs ~$100M/year.
You need:
•$10–20M/year in real revenue → meaningful narrative shift.
•$20–50M/year → enough to partially offset dilution.
•$50–100M/year → enough to fully replace high inflation if inflation is cut down to 2–5%.
In short:
Even $10–20M/year meaningfully changes the story.
But to truly replace inflation as the “security budget,” you’d need much more.
⸻
5. How ATOM Holders Reacted to Inflation Cuts (Prop 848)
•Proposal passed narrowly and caused major conflict.
•Led to Jae Kwon’s fork ATONE.
•Split the community between “high inflation = strong security” and “low inflation = modern tokenomics”.
•Takeaway: Inflation cuts trigger strong social/political pushback if not introduced carefully.
⸻
6. How to Avoid Backlash When Cutting Inflation
To reduce inflation safely, you need:
✔ 1. Gradual phases — not a cliff.
Spread cuts over 1–3 years.
✔ 2. Lock-based rewards.
Lower inflation but reward long-term stakers so APR doesn’t collapse.
✔ 3. Temporary support from treasury / ICS revenue.
Use early fee revenue to “top up” rewards while new revenue streams grow.
✔ 4. Strong governance process.
Wide community alignment before the proposal hits the chain.
✔ 5. Clear narrative: lower inflation = less dilution sustainable growth.
@cosmos $ATOM
1
2
154
1 Dec 2025
Hope you all rotated and are in a great position to celebrate this holiday season 🎅
93
27 Nov 2025
Happy Thanksgiving friends!
May blessings be upon you and your loved ones
1
4
181
21 Nov 2025
Thinking of going live and showing some of yall something I think is interesting in the charts…
Should I ?
144
19 Nov 2025
I ran a simple Monte-Carlo model (Geometric Brownian Motion) for the 1-year probability that $ATOM < $1 under a few reasonable scenarios. I used the current ATOM price and market stats from the web as inputs, then simulated 100,000 paths per scenario.
Below are the inputs, the results, and a short plain-English interpretation.
Inputs (web sources)
•Current ATOM price used: $2.76 (CoinGecko).
•Current market cap shown on CoinGecko ≈ $1.32B
•Staking / security context: Cosmos Hub staking rate referenced from Messari reports (staked share ~~63% reported previously).
Model design (what I simulated)
•Model: Geometric Brownian Motion for price S_t.
•Time horizon: 1 year.
•Starting price S_0 = \$2.76.
•Scenarios: combinations of annual drift (expected return) and volatility (annualized σ).
•Drifts: 0% (neutral), -30% (bear), 20% (bull).
•Vols: 60%, 100%, 150% (covering a realistic crypto range).
•Simulations: 100,000 Monte Carlo draws per scenario.
•Output reported: probability that price after 1 year S_{1yr} < \$1, plus some distribution percentiles.
Important assumptions / caveats: the model assumes log-normal GBM (constant drift & vol) and does not try to model on-chain effects (staking lockups, inflation/issuance schedule, large whaletrades, governance events, macro shocks, liquidity gaps). Treat outputs as scenario probabilities under these mathematical assumptions, not as precise market forecasts.
Results (exact numbers from the simulation)
(Each row is a scenario: drift, vol, P(ATOM < $1 in 1yr), plus median/mean/result percentiles.)
drift (annual)vol (annual)P(ATOM < $1 in 1 yr)median S_T ($)10th pct90th pct
0.200.600.0429 (4.29%)2.81821.30286.0494
0.201.000.2350 (23.50%)2.04910.57177.4059
0.201.500.4771 (47.71%)1.08700.15907.4832
0.000.600.0831 (8.31%)2.29291.06334.9769
0.001.000.3031 (30.31%)1.67950.46566.0628
0.001.500.5284 (52.84%)0.89740.13306.0965
-0.300.600.1857 (18.57%)1.70810.79013.6914
-0.301.000.4157 (41.57%)1.23590.34174.4481
-0.301.500.6081 (60.81%)0.65800.09684.4735
Plain English takeaways
•If the market stays roughly flat on average (drift = 0) and volatility is moderate-high (100% annual), the model estimates ~30% chance ATOM < $1 in 1 year.
•If volatility is very high (150% — plausible for crypto in wild periods) and average drift is neutral, probability rises to over 50%.
•If we assume a mild bull drift ( 20%) and low vol (60%), the chance is small (~4%). Conversely, in a bear drift (-30%) with high vol, the chance exceeds 60%.
•Bottom line: volatility matters as much or more than drift. Because ATOM’s current price (~$2.76) is only ~2.76× the $1 threshold, large volatility alone can generate sizeable chances of hitting <$1 even if the average return isn’t strongly negative.
Why this model can over- or under-estimate real risk
•Doesn’t model staking: a large fraction of ATOM is staked (reduces immediate sellable float), which can reduce the probability of quick crashes — but it can also create delayed sell pressure on unlocking. Messari notes high staking rates for Cosmos.
•Supply changes & tokenomics: inflation / issuance rates (rewards) change float over time — I didn’t model dynamic supply.
•Liquidity, exchanges, and macro events: extreme one-off events (exchange failures, regulatory bans, governance disasters) produce tail risks not well captured by GBM.
•Model simplicity: GBM is a simple first pass. More realistic models would include jumps, changing volatility, and on-chain constraints.
1
196