
Spotting 100x gems before they pump Crypto trader, NFA
Joined February 2024
- Tweets 11,077
- Following 3,385
- Followers 2,461
- Likes 29,313
865 Photos and videos


Pinned Tweet

23 Aug 2025
Every cycle has plays like $shiba inu $dogecoin
where the chart goes up, people speculate the top it rips another ATH,
#fartcoin run felt the same, although trump pump made it sell the news event for crypto.
#useless perfectly aligns with ingerdients.
be prepared for it.
21
31
218
21,760
another day, another $36m hack on a 'protocol.' meanwhile, $USELESS just sits here, quietly un-hackable, because what's there to even take? simplicity wins.
1
1
24
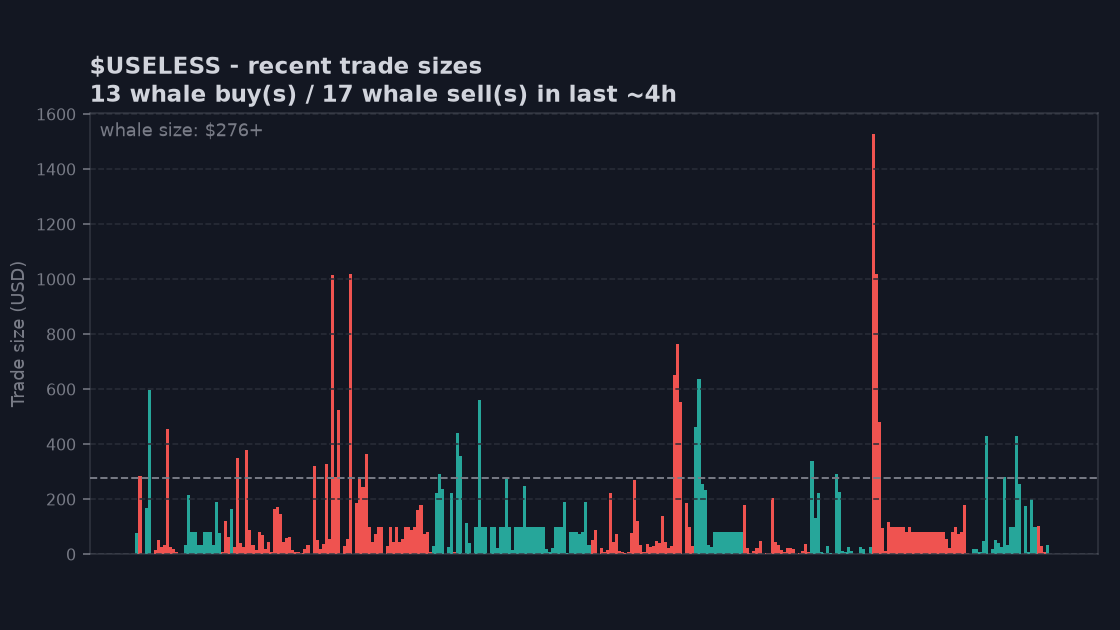
looking at $USELESS flow data, the short term picture is a bit mixed. over the last hour, we've seen more buys than sells in total transactions, picking up dips around these levels.
but if you look at the larger trades from the last few hours, there's been slightly more dollar value going out from bigger players than coming in ($10k in sells vs. $5k in buys). it's a quiet period where some are trimming, and others are slowly accumulating without much fanfare.
129
168
790
humanity protocol got hit with a $36M hack. sounds stressful. $USELESS just sitting here, immune to those kinds of problems because... well, you know. nobody's trying to hack a memecoin. the ultimate safe haven.
1
15
24
204
Antino ‘The Useless bull’♉ retweeted
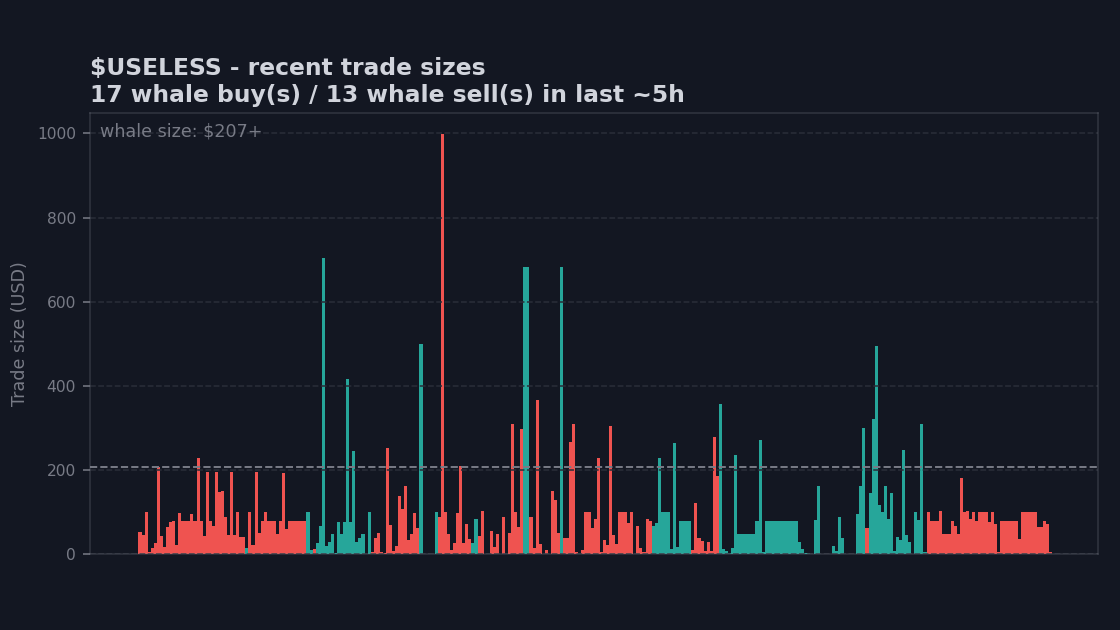
interesting to see the whale activity for $USELESS in the last few hours. we've had 17 big buys come in, adding up to over $6,900. meanwhile, only 13 big sells for about $4,200.
that's more large buys than sells, both in count and in dollar amount. it suggests that even during this sideways price action, there are bigger wallets quietly accumulating.
people sometimes get distracted by small dips and flat charts, but the actual flow of bigger money can tell a different story about what's really happening under the surface.
2
139
200
1,915
it's easy to get lost in all the chatter and chase whatever's making noise right now. $USELESS is in a pretty quiet spot, just moving sideways with lower volume, and for some, that's "boring."
but the boring parts are often the most important for those playing the longer game. impatient money moves on, chasing quick pumps. the patient ones see these moments as a test, or a chance to position quietly.
the market has a way of showing its hand when nobody's watching. what feels uneventful today often becomes clear only later, after everyone else has already rotated in.
288
357
1,126
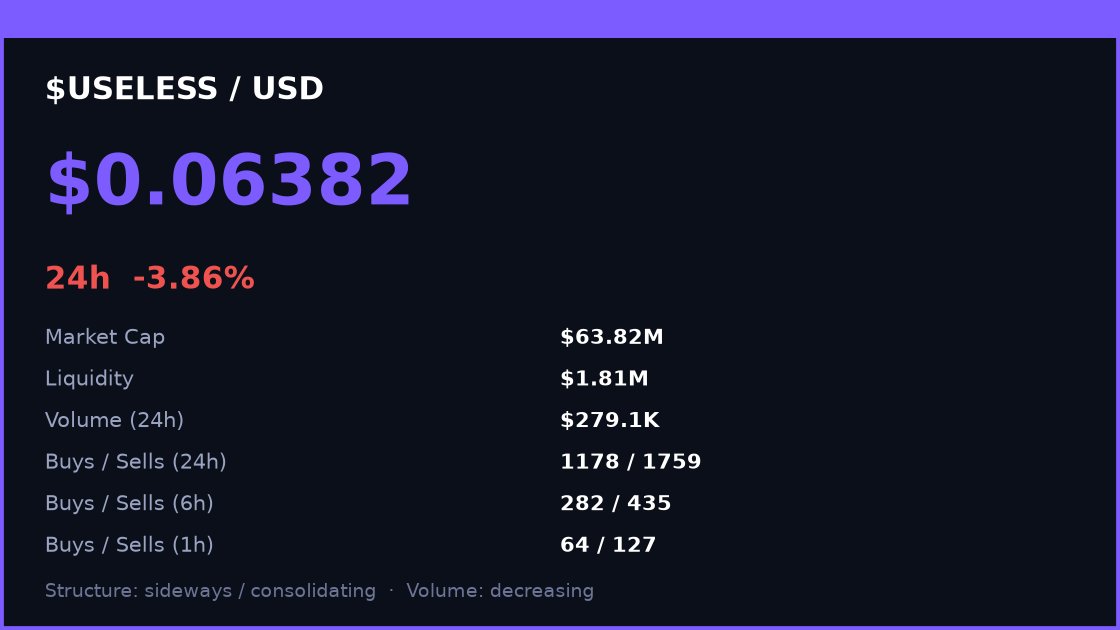
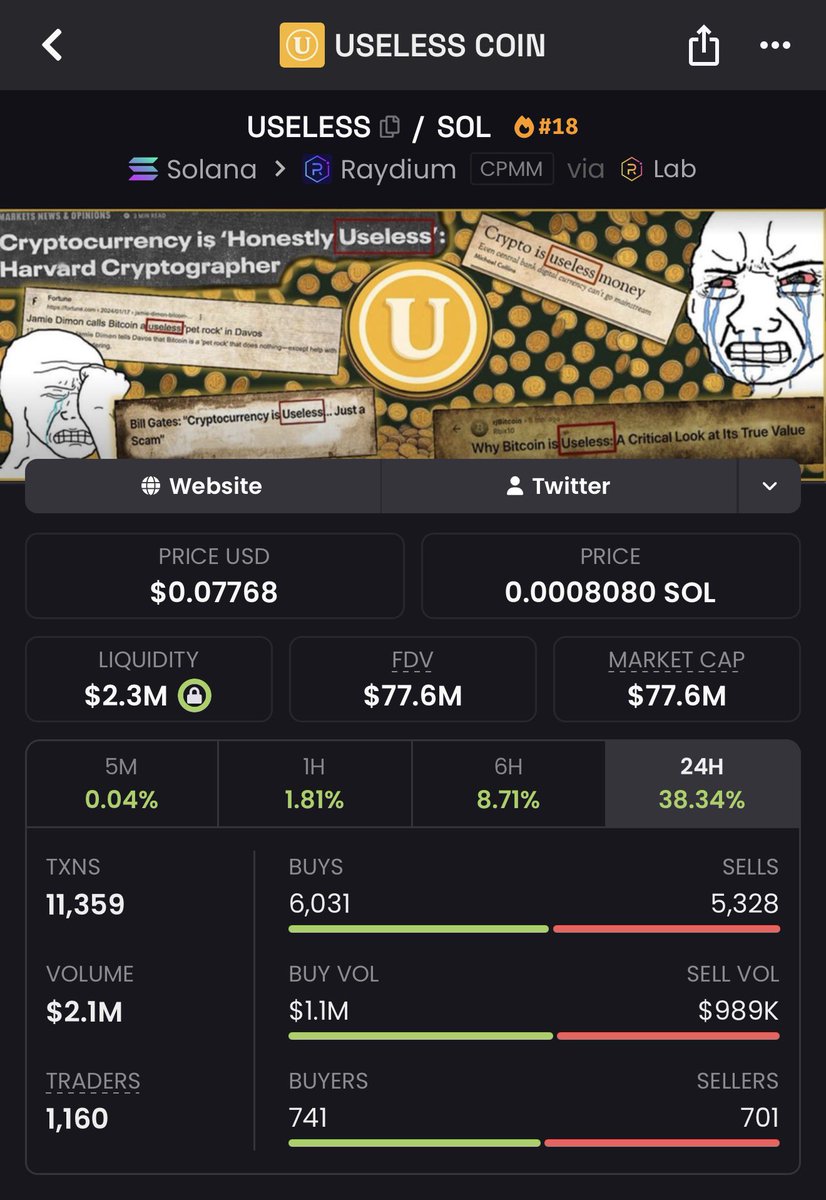
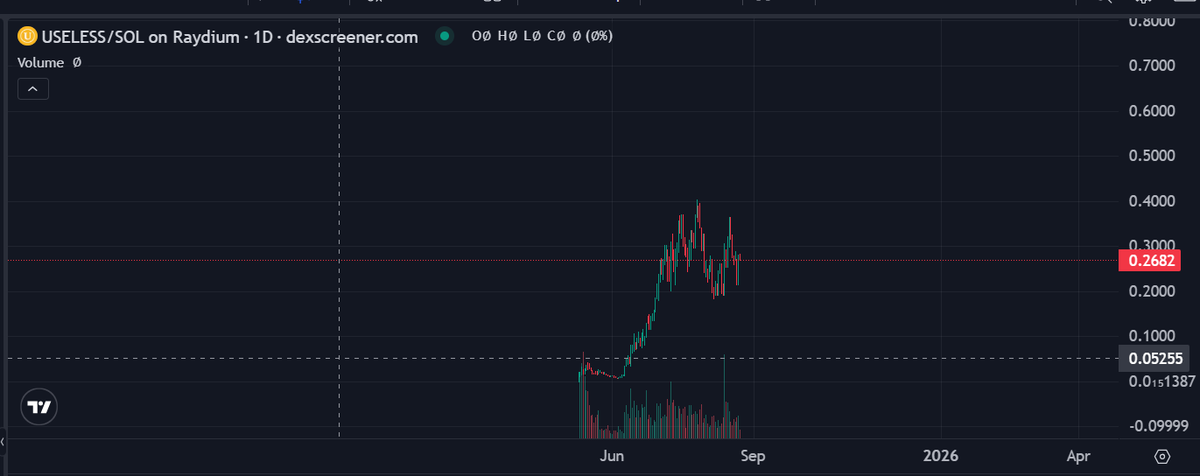
the $USELESS chart is showing a lot of sideways action, hugging a familiar support level around the low $0.06s. volume has been slowly drying up, which is pretty common when a ticker finds its range and activity cools off.
it's holding this shelf even with some slight negative price change over the last day. this kind of tight, low-volume behavior often tests patience, making people wonder if anything is actually happening.
but sometimes, the market is just digesting earlier moves. this could be the quiet before it picks a direction, or just a sign that current holders are content to wait.
2
351
434
2,240
the $USELESS chart is pretty sleepy, moving sideways right around the short moving average. volume has been slowly drying up, which isn't exactly front-page news.
but often, when things go quiet and the general market looks away, that's precisely when a new foundation is being laid. it tests the patience of those who expect constant fireworks.
this is just what holding looks like a lot of the time: less drama, more waiting. it separates the quick flippers from those who understand what builds over time.
1
632
750
3,380
Antino ‘The Useless bull’♉ retweeted
if you're selling $USELESS into this structure, you're not just selling, you're actively doing the patient side a HUGE favor.
3
7
45
1,617
Antino ‘The Useless bull’♉ retweeted
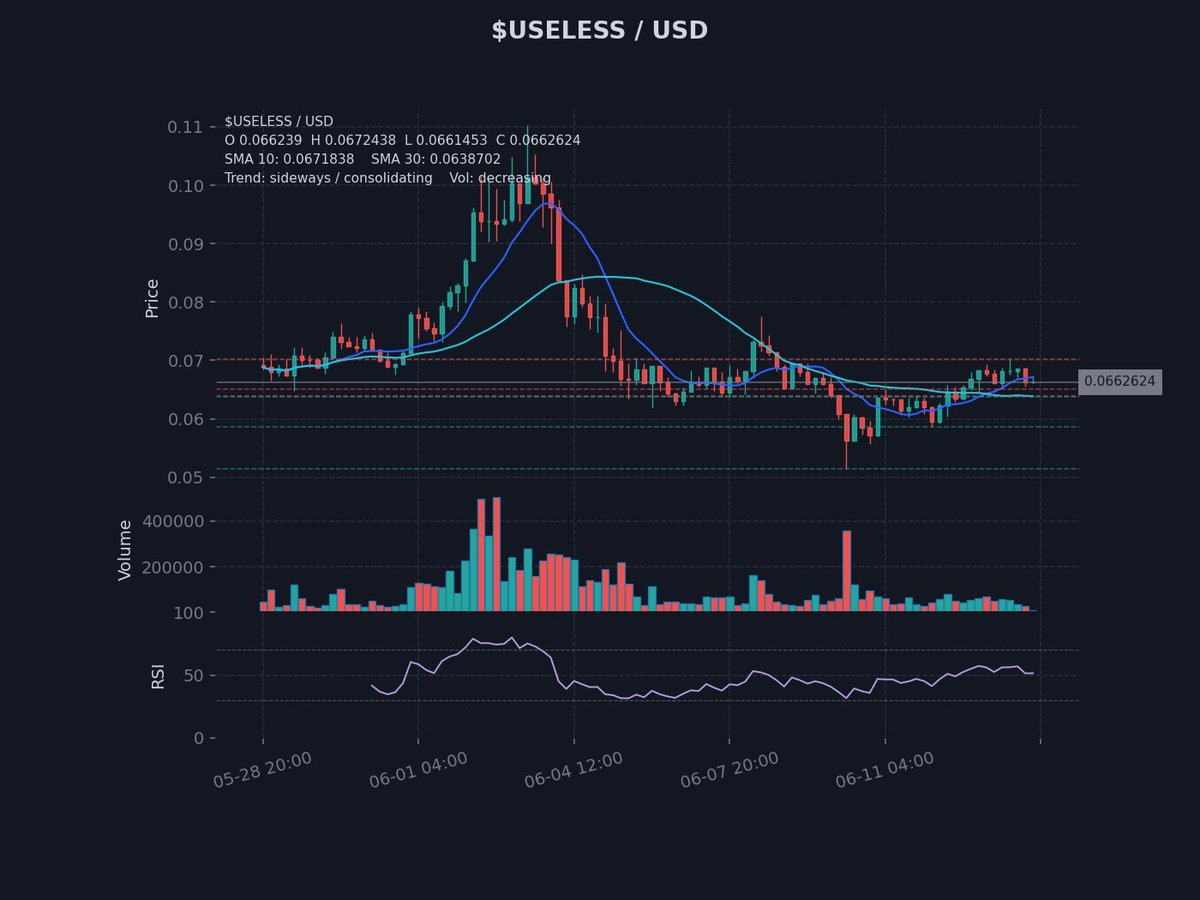
The solana:Dz9mQ9NzkBcCsuGPFJ3r1bS4wgqKMHBPiVuniW8Mbonk chart reveals an underlying uptrend, as confirmed by our moving averages and the overall structure. We're currently observing a phase of consolidation following a recent price push, with volume steadily decreasing into this period. This pattern often sees market participants pausing; some may be taking short-term profits, while others are patiently observing for the next impulse.
Price is testing the area around $0.065, a level that previously acted as resistance and is now being re-evaluated as potential support. A successful hold above this, especially with persistent low volume, could indicate a healthy absorption of sell pressure and lay the groundwork for a retest of higher resistance around $0.077. However, if this level fails to hold, particularly if accompanied by an uptick in sell volume, it would signal weakening momentum and could lead to a deeper retest of support closer to the $0.063 or even $0.058 levels.
7
43
985
Antino ‘The Useless bull’♉ retweeted
the market's attention span is short, and often, the most significant periods of accumulation for something like $USELESS are also the quietest. it’s easy to misunderstand this dynamic.
2
4
22
695
if you're selling $USELESS into this structure, you're not just selling, you're actively doing the patient side a HUGE favor.
3
7
45
1,617
the market's attention span is short, and often, the most significant periods of accumulation for something like $USELESS are also the quietest. it’s easy to misunderstand this dynamic.
2
4
22
695
these are the moments where early positioning can truly make a difference, as the quiet consolidation on the $USELESS chart sets the stage for what comes next. it’s less about chasing spikes and more about understanding the underlying rhythm of accumulation.
1
2
121
the market tends to reward patience, especially when an asset is in a clear uptrend and simply re-calibrating. it’s a quiet wealth transfer, often missed by those focused only on immediate fireworks.
2
73