
Clarity rarely comes from more information. It comes from better questions, better discussions, and better thinking.
Joined January 2024
- Tweets 3,864
- Following 5
- Followers 1,168
- Likes 380
555 Photos and videos


Pinned Tweet

May 25
𝗗𝗲𝗰𝗶𝘀𝗶𝗼𝗻.
𝗪𝗵𝗮𝘁 𝗺𝗮𝗸𝗲𝘀 𝘆𝗼𝘂 𝘀𝗼 𝘀𝘂𝗿𝗲 𝘁𝗵𝗲 𝗱𝗲𝗰𝗶𝘀𝗶𝗼𝗻 𝘆𝗼𝘂 𝗺𝗮𝗱𝗲 𝗶𝘀 𝗮𝗰𝘁𝘂𝗮𝗹𝗹𝘆 𝘁𝗵𝗲 𝗿𝗶𝗴𝗵𝘁 𝗼𝗻𝗲?
The confusion usually starts when the outcome begins changing and the situation no longer feels as obvious as it once did.
The numbers/situation may still look strong but something feels different.
Sometimes expectations move ahead of reality before most people notice it.
Sometimes the visible outcome is actually being driven by something most people are not paying attention to yet.
And sometimes two situations that once looked almost identical slowly begin leading to completely different outcomes because the assumptions, incentives, timing, execution or starting conditions were different from the beginning.
That’s usually where the confusion starts.
Not because information is missing. Most information is already available.
𝗕𝘂𝘁 𝗺𝗮𝘆𝗯𝗲 𝘁𝗵𝗲 𝗯𝗶𝗴𝗴𝗲𝗿 𝗽𝗿𝗼𝗯𝗹𝗲𝗺 𝗶𝘀 𝘁𝗵𝗮𝘁 𝗽𝗲𝗼𝗽𝗹𝗲 𝗼𝗳𝘁𝗲𝗻 𝘀𝘁𝗮𝗿𝘁 𝘀𝗲𝗮𝗿𝗰𝗵𝗶𝗻𝗴 𝗳𝗼𝗿 𝗮𝗻𝘀𝘄𝗲𝗿𝘀 𝗯𝗲𝗳𝗼𝗿𝗲 𝗮𝘀𝗸𝗶𝗻𝗴 𝘁𝗵𝗲 𝗿𝗶𝗴𝗵𝘁 𝗾𝘂𝗲𝘀𝘁𝗶𝗼𝗻𝘀.
Because sometimes the answer is visible. The real question is what’s still missing.
So why does the same situation still look completely different to different people?
The difficult part is understanding:
➖what is actually driving the outcome,
➖what patterns or signals already exist,
➖what assumptions people are making,
➖what is just noise,
➖and what could become important long before the outcome becomes obvious in hindsight.
I think a lot of complex situations start making more sense once you stop looking at them as isolated events.
Usually there are multiple forces interacting together:
expectations,
incentives,
money flow,
execution,
constraints,
timing,
pressure points,
second-order effects,
and small decisions compounding over time.
Which is also why reacting to the visible outcome is usually the easy part.
The harder part is identifying the root cause, thinking through cause & effect, and seeing how small changes in one variable can slowly change the entire outcome later.
A lot of important decisions are also made before the full picture becomes clear.
Which means you rarely get perfect information, perfect timing, or complete certainty.
Sometimes you are working with patterns.
Sometimes probabilities.
Sometimes incomplete signals.
And sometimes the only real edge is seeing the situation a little more clearly before everyone else does.
𝗢𝗿 𝗺𝗮𝘆𝗯𝗲 𝘁𝗵𝗲 𝗾𝘂𝗲𝘀𝘁𝗶𝗼𝗻 𝗶𝘀:
𝗔𝗿𝗲 𝘄𝗲 𝗲𝘃𝗲𝗻 𝘀𝗼𝗹𝘃𝗶𝗻𝗴 𝘁𝗵𝗲 𝗿𝗶𝗴𝗵𝘁 𝗽𝗿𝗼𝗯𝗹𝗲𝗺,
𝗼𝗿 𝗷𝘂𝘀𝘁 𝘀𝗼𝗹𝘃𝗶𝗻𝗴 𝗶𝘁 𝗮𝘁 𝘁𝗵𝗲 𝘄𝗿𝗼𝗻𝗴 𝗹𝗲𝘃𝗲𝗹?
That’s mostly what I try to think through and break down here. Whether it’s a stock, sector, business, market behavior, life decision, or any other complex situation.
If you read all of this carefully, you probably already understand the kind of thinking I’m interested in.
So if there’s a stock, business, life decision, or any complex question you’ve been thinking through but never really discussed properly, feel free to comment with a little context around it.
Would genuinely like to think through it together.
2
5
1,637
If you do not understand which timeline you are looking at in the BESS cycle, you can be right about the business and still be wrong about the stock.
Look, you know the stock names but have you mapped them cycle-wise?
2026–2027 will be dominated by project execution, commissioning and order-to-revenue conversion, this is the phase where execution proof matters most.
2027–2028 could be when a larger number of BESS projects become operational, this is where BOO assets may start contributing recurring EBITDA.
2028–2029 focus shifts from execution to profitability and cash generation, the market may start focusing more on cash flow, margins and ROCE.
2029–2030 is when the market separates winners from participants. Operational assets, recurring cash flow, and balance sheet strength may start driving the next phase of value creation.
Now apply this timeline to #Acme, #JswEnergy, #Oriana, #Pace, #Spml, #Bondada, #Advait and others.
Because not all of them are at the same stage. Some are still converting orders into revenue, some are waiting for BOO assets to become operational and some are waiting for cash flow to show up.
For example, companies like #Oriana, #Pace, #Bondada, and #Advait are building BOO assets, the market already knows the EPC revenue part, and in many cases it is also looking ahead to the BOO part.
So when EPC revenue continues to dominate but BOO commissioning take longer than expected, the stock may stop moving. Because the timeline the market was expecting and the timeline that is actually playing out have become different.
You are looking at the opportunity, but the market is looking at the timeline and that difference matters.
Now look at why a few BESS stocks are not doing well.
Because the market is still uncertain about execution proof, commissioning speed, cash-flow generation, margin sustainability, and ROCE in companies that have plans but limited operational assets.
And then there is another layer.
The biggest expectation gap is between BOO annuity EBITDA visibility and EPC revenue growth.
The market expects EPC revenue in 2026–2027 but BOO annuity at 15–17% margins may not show up until 2027–2028. So people may be underestimating this 2–3 year gap.
Many people are looking for cash flow in a phase where the sector is still focused on execution and commissioning.
So which type of companies are most likely to re-rate first?
Which type of companies may re-rate later, but potentially more sharply?
What can cause the market to de-rate the BESS ?
What has the market already understood?
What is the market still missing?
Where is the biggest expectation gap?
And where can the best returns come from if the cycle plays out as expected?
Because different business models have different constraints.
For asset owners capital is the main constraint, for epc players execution is the main constraint, for manufacturers tech is the main constraint.
So the question is not whether BESS will grow, the real question is where each company sits in the cycle today.
Because once you understand that, many things start making more sense.
-
Expectation Gap, Proof, Re-rating Report and BESS Ecosystem Bottlenecks 2026–2030 Report will be available in the Supergroup.
-
Here is the BESS cycle thinking pdf report, read it and see how those stocks are connected.
drive.google.com/file/d/1uQE…
1
1
178
Okay, for example read this report about Oriana Power. Here, what you will find is:
What is the biggest signal emerging in Oriana Power right now?
What is the biggest bottleneck or chokepoint in this story?
What is the market still waiting to see before fully believing the story?
If Oriana succeeds, where will the value actually be created, and when can that happen?
Now apply the same thinking to #Acme, #AdaniGreen, #JswEnergy, #TataPower, #KpiGreen, #Pace, #Jupiter, #Bondada, #SwSolar, #Spml, #WaareeEnergy, #VikramSolar, and other BESS stocks.
You start understanding who is positioned well, where the bottlenecks are, what the market is still waiting for, and where the biggest expectation gaps may be.
- Reports are available in the Supergroup.
drive.google.com/file/d/16X2…
1
1
169
You are not betting on the final winner of EVs, you are betting on order inflow, capacity utilization and operating leverage.
Don't ask which EV company will win?
Because, as EV penetration rises in India over the next 5 years, content per vehicle will rise too. Companies that can increase their wallet share inside the vehicle are likely to create more value than companies selling a single component.
Now think about where does EV content per vehicle increase the fastest and who captures the largest share of that increase?
Because that is where returns can accelerate.
Battery Power Electronics Thermal Management.
Now think about what happens as EVs evolve. From 2-wheelers to cars. From 20 kWh batteries to 60–80 kWh batteries. From slow charging to fast charging.
The more power you push through the system, the more heat you create and heat is not something you can ignore.
More heat means more cooling, more cooling means better pumps, better compressors, better thermal controls and better battery monitoring and this is not a feature you can simply skip.
As batteries get bigger and charging gets faster, thermal management starts becoming a bottleneck.
And over time, that bottleneck turns into a choke point that becomes harder and harder to bypass.
Because if heat is not managed properly, battery life, charging speed, safety, and performance all get affected.
Yes, EV growth matters, but what matters more is that capacity is already built, the trigger is when orders start coming and utilization starts moving higher.
If utilization moves from 50% to 80%, margins can improve and profits can grow much faster than revenue.
Orders are increasing, localization is increasing, competition is still manageable but the opportunity is still not very visible because EV penetration is still low and the market is still looking at EV volumes.
Now think about the problem.
If batteries get bigger and charging gets faster, someone has to keep battery and cabin temperatures under control, that is where companies like #Subros come in.
Someone has to remove heat from the system before performance starts getting affected, that is where companies like #Banco and #KRN fit in.
Someone has to keep coolant moving through the battery and thermal system, that is where #Pricol comes in.
Someone has to supply the fluids that help manage all that heat, that is where #Castrol, #GulfOil and #SavitaOil fit.
And someone has to build the battery housings and cooling structures around the battery pack, that is where #CraftsmanAutomation comes in.
The interesting part is that the market is still focused on EV volumes, but over the next few years, the bigger story may be EV content per vehicle.
That is where the gap could be.
What the market is looking at today may be very different from what it starts focusing on a few years from now.
And if thermal management moves from a bottleneck to a choke point, that gap can become much more visible.
That is where things can get interesting.
- We share reports with much more clarity in our Supergroup to help you make better decisions.
- If you want to join, you can contact me.
- The reports are built around your questions, your doubts and the clarity you are looking for.
2
2
3
496
For example, read this Banco report and try to understand:
- What has changed in Banco over the last 1 year?
- What is driving the business today, and what does that growth depend on?
- Where are the bottlenecks and choke points, and does Banco help solve them?
- As EV content per vehicle rises, how much value can Banco actually capture?
- What is the market looking at today, and what part of the Banco story is still getting ignored?
- What still needs to be proven before the market believes the story?
- What is the trigger that can change perception?
- If management is right, how much can the financials actually change?
- What can break the story?
- What is the timeline?
When you start looking at companies this way, you get more clarity about where to look and where not to look.
And when you apply questions like Where are the bottlenecks and choke points? across all EV thermal management companies, you can make a much clearer decision.
Because now you are not just looking at products or revenue growth. You are looking at what drives the business, what can break the story, what still needs to be proven, and when things can actually play out.
drive.google.com/file/d/1fKg…
1
3
170
Jun 12
Yesterday I posted about the Battery Chemicals Map along with a pdf, you can see and map when and what type of decisions you can take.
Today, what I am sharing is about EV 2W, 3W, 4W, buses, and trucks.
This is based on Ola, Ather, Bajaj, TVS, Hero, Zelio, Wardwizard, Greaves, Mahindra, Tata Motors, Hyundai, Maruti, Olectra, JBM and Ashok Leyland.
Have you ever thought about what management teams across all these EV segments are actually saying or planning?
You know all the stock names, but have you ever put them all in one place and tried to find the signals and the triggers?
This post and report are all about that, when you bring everything together, you start seeing things that are difficult to see when looking at companies one by one.
- What has changed in management thinking over the last 2–3 years?
- What is each management team actually trying to build?
- What problem is each management team trying to solve?
- What is management spending money on before revenue appears?
- What has management already proven and what still needs proof?
- What must happen for management's vision to become reality?
- If management is right then what might the market be missing today?
When you map everything in one place, you start getting a clearer direction and as you know, the moment the market starts seeing proof, the re-rating starts.
So if you could focus on one area of the EV ecosystem for the next two years, which layer would you choose?
If the market is right, this layer should perform normally. If the market is wrong, this layer could become one of the biggest equity wealth creation opportunities in the EV ecosystem by 2028.
drive.google.com/file/d/1Iff…
1
2
17
1,051
Jun 12
Did you see what happened today?
Almost all these stocks were up.
JBM was up around 6%. Olectra around 3%. Ashok Leyland around 10%. Maruti around 2%. Tata Motors PV around 3%. Tata Motors around 8%. Hyundai around 2%. Ola, Ather and TVS were also up. Hero was up around 2%. Zelio around 2%. Even Greaves was up around 5%.
Only Bajaj was down, but it was up earlier as well. Even now, Bajaj is down only around 0.5%.
So when stocks across EV 2W, 3W, 4W, buses and trucks start moving up together, try to understand the pattern, what is the market seeing and what might be coming next..
2
539
Jun 12
See, the battery is the main part of the EV ecosystem, we all know that, but cycle-wise which layer has the hidden opportunity and how can you find it?
For that, the best way is to use a framework.
Because if you only look at what is visible today, you will probably end up looking at the same things everyone else is looking at, the real opportunity usually sits one layer away from where market attention is today.
So you have to apply signals, drivers, dependency, bigger dependency, chokepoints, expectations, and then the trigger. That is how you start finding the layer.
And remember, in this ecosystem, there can be multiple opportunities at different points in the cycle. One layer may work in 2027, another in 2028, another in 2029 and another in 2030.
So how do you decide?
For that, look at each layer through:
Market attention today, what the market is assuming, what still needs to be proven, bottleneck severity, entry barriers, competitive intensity, pricing power, margin potential, ROCE potential, time to meaningful earnings, time to market rerating, probability of success, value capture potential and risk of value leakage to other layers.
Then compare the different layers:
Battery materials, cell manufacturing, battery packs, power electronics, motors & magnets, thermal management, charging equipment, charging infrastructure supply chain and fleet software.
And when you do that across all the layers, things start becoming clearer.
You start seeing which layer may rerate by 2027, which one may rerate by 2028 and where the market is still missing something.
Remember, the goal is to find it before the market starts seeing it, most of this will happen before 2028, not after that. So the window is from mid-2026 to mid-2028.
That is where the opportunity..
3
260
Jun 11
Okay listen. You want to take a decision about battery chemicals stocks, right?
And yes, the market is down. If you can't take the opportunity now, then when will you?
But what I'm saying is, before taking any decision, understand the value chain carefully, not just what you see or read. Try to think differently.
Think like this:
- Where could the market actually create value first, and what evidence would prove it?
- What is the market already assuming will happen, and what is still uncertain?
- Which event could change the entire narrative, not just the next quarter?
- If the business works, what must happen next, and then what?
- If you could track only a few things for the next two years, what would they be?
See, the goal is to move from what is the company doing? to what is the market waiting to see, what changes if it happens, and how do I know if I'm right?
Information is rarely the problem, the challenge is knowing which signals matter and which are just noise.
You already know the revenue, EBITDA, margins, capacity, guidance and orders. But some questions still remain and sometimes those questions matter more than the numbers.
So for that, read this PDF.
Long PDF? Who reads that much?
You will, because you want to take good decisions, right?
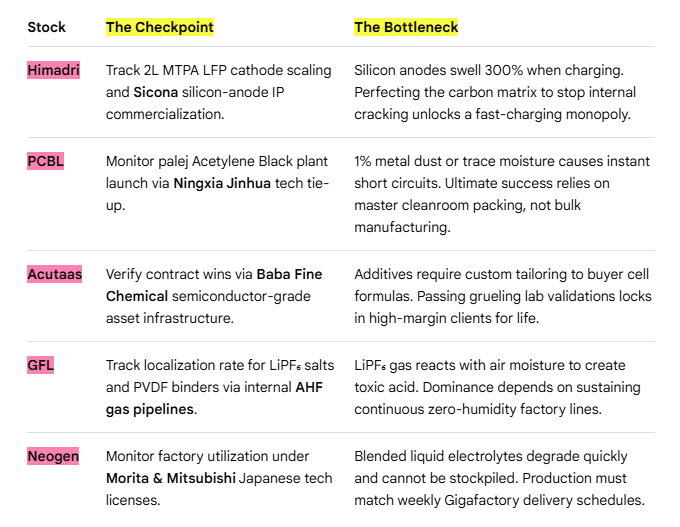
It covers GFL, Himadri, PCBL, Neogen, HEG, Acutaas, and Tatva. Basically, cathodes, anodes, electrolytes, salts, additives, and binders.
From signals to triggers, timelines to bottlenecks, everything is there and at the end, there are a few tables mapping the ecosystem with companies like Ola, Exide, and Amara Raja to help you get more clarity.
- What is the one event that changes all these stories from potential to reality?
drive.google.com/file/d/1Yef…
1
18
1,010
Jun 10
In battery chemicals, don't just ask who is building capacity.
Ask where the bottleneck is, because capacity can be copied. The bottleneck usually can't.
And once you find the bottleneck, you start seeing which company may have something others don't.
1
8
35
2,003
Jun 10
Hitachi Energy is down 3.5% today. It's down 8% in the last 5 days. Yet it's still up around 75% in the last 6 months.
So can it go down from here?
Of course it can.
But can it still go up 50% over the next 6–12 months?
Maybe.
Most people will look at the ₹33,265 price and 140 PE and stop there.
But FY26 revenue was around ₹8,148 crore, while the order book has reached nearly ₹29,555 crore, roughly 3.6x annual revenue.
Now think about the problem India is trying to solve.
The challenge is no longer just generating power. The challenge is moving that power efficiently across the country, integrating renewables, upgrading transmission networks, expanding substations and dealing with transformer shortages.
This is not a one- or two-quarter story. It's a multi-year cycle and that's where the pattern starts showing up.
The biggest winners are often the companies sitting at a bottleneck or choke point that the system cannot easily bypass.
Hitachi sits right in the middle of one of those choke points, that's why I think looking only at the PE misses part of the story.
The market may be valuing not just current earnings, but the role the company could play if this grid upgrade cycle lasts for the next decade.
Now another question comes up.
Is there any other stock like Hitachi?
Yes.
Maybe not at the same scale or position today.
But that's usually how cycles work.
The market finds the obvious winner first, then starts looking for the next company helping solve the same bottleneck.
Mar 31

Hitachi Energy..
They are getting large orders, strong visibility and everything seems aligned with the theme. So it feels like the opportunity is already understood.
But if you look deeper, the role of the company is not that simple. They are not just part of grid expansion, they are solving the problems the grid will face next and that difference changes how you should look at it.
The company is focused on three key areas.
Moving power over long distances through HVDC, managing voltage instability through STATCOM, and controlling the grid through automation.
These are not basic products, these are stress-driven systems.
That is why their position in the value chain is different.
They are present across transmission, power electronics, and control layers together and that is where higher value and better margins usually come from.
Even now, a large part of revenue is still coming from transformers and GIS. That is mid-cycle demand, where execution and earnings are already visible.
But the shift is happening in the order book, a big portion of new orders is now coming from advanced segments like HVDC.
These are long-cycle projects where orders come first and earnings come much later. So visibility is high, but actual performance is still ahead.
Management is also guiding in the same direction.
A lot of these projects will start reflecting properly in earnings around 2027–2028.
Right now, it is still early execution.
So the picture you see today is only partial. Margins have started improving, but the real expansion depends on how this order book gets executed.
That phase has not fully played out yet.
And this is where one question becomes important.
If most of the earnings are still 2–3 years away, what exactly is getting priced today?
Because demand here does not come evenly.
It comes when renewable energy increases, when instability shows up, and when transmission becomes a bottleneck and at that point, spending becomes necessary, not optional.
That is when pricing power changes. Because these systems are not easy to replace, and very few players can deliver them.
This is where margin expansion actually builds.
But even if all of this is correct, timing still decides outcomes. Orders are already visible, but earnings are still catching up and markets usually move in between these two.
So the gap is not in understanding the company.
It is in understanding when this shift shows up in numbers and when the market fully reacts.
That is where positioning actually matters.
And maybe the better way to look at it is this.
Is this a company benefiting from what is visible today…
or from what has not fully shown up yet?
drive.google.com/file/d/1Nlz…
1
663
Jun 10
Look, I’m not saying all this because you need to know everything or track every single thing, that’s not what I’m trying to say.
I’m saying it because whatever decision you take, take it after thinking about it properly.
Don’t just look at what has happened or what is happening right now, think once about what may be coming next in the grid ecosystem.
Because sometimes the answer is not where most people are looking.
Take 4 companies — GE Vernova, Hitachi Energy, Siemens Energy and ABB.
Now see where most of their revenue comes from today and what type of revenue it is.
Then look at what is sitting inside the order book. Is it the same as the current business or does it look different?
Then look at what management is planning for the next few years. Is it the same business you see today or are they preparing for something else?
Then think about what problem or demand management is trying to solve and where in the grid ecosystem it sees the biggest opportunity.
Now connect all of that. What pattern do you see?
What has already been discovered and priced in by the market?
And what may still not be fully discovered or reflected in expectations?
Because sometimes the signal is not in one company, it is hidden in what multiple companies are preparing for at the same time.
Once you see that pattern, you stop looking at the company and start looking at where the demand is going.
Now all you have to understand is where the chokepoint is building and where the bottleneck may appear next.
That's it. There is your next decision.
See, you already know the stock names, the price, the backlog and the orders, but what is missing is clarity on where the demand is building, where the grid can break, and which parts of the ecosystem could matter the most over the next few years.
This PDF can give you that clarity and help you make a better decision.
drive.google.com/file/d/1xQP…
2
2
5
630
Jun 10
After reading this, you will find the bottleneck and understand which stock to pick for the next 1–2 years.
You just have to apply these questions to your stock.
- Where exactly does the company sit in the power grid value chain, and what products or services connect it to grid stress or enforcement?
- Is the company primarily paid when the grid is being built, or when the grid is failing and needs to be fixed?
- What specific grid stress, failure, or enforcement creates demand for this company?
- Once the problem appears, is spending on the company's products or services necessary, or can it be delayed?
- Who actually pays the company, and who controls that spending decision?
- If grid enforcement increases, does demand for this company automatically increase, or does the value go to EPCs or large OEMs?
- Can the company be easily replaced without changing grid compliance, reliability, or outcomes?
- Is this company an early-cycle, mid-cycle, or post-enforcement beneficiary in the grid cycle?
- Is the company's revenue and cash-flow structure capable of surviving delayed payments and uneven enforcement-driven demand?
- And where is the gap?
- What has the market discovered till now?
- And what has the market still not fully discovered?
- What is management seeing that the market may still not be seeing?
- Where is management putting capital?
- What type of products, services, or capabilities are they building for?
- What problem are they preparing to solve?
- And if multiple management teams are preparing for the same thing, then what are they all seeing?
Because that is where the bottleneck usually sits.
When you apply these questions to your stock, you will be able to take the right decision.
If you are still looking at the stock price and PE, then you will not be able to find the gap and the bottleneck.
And then after 1–2 years, you will think, "Oh, I knew that would do well."
But guess what?
You did not take the position.
1
283
Jun 9
In life and in the stock market, one thing matters a lot — pattern recognition. You see the move, but most of the time you don't see the pattern behind it.
If you look at the energy sector, you can see the same thing in Green H2 as well.
- Over the last month, John Cockerill India moved from around ₹5,200 to ₹9,800, almost 2x. INOX India moved from around ₹1,400 to ₹1,700, roughly 21%.
- That is the signal. Something changed, and the question is what.
- And more importantly, if there is a pattern here, can we apply the same thinking to other parts of the energy sector?
- John Cockerill India is still a steel-processing equipment EPC and technology business. It is not a green steel business yet.
- The big change is the acquisition of John Cockerill Metals International and the consolidation of the group's metals business into the listed entity.
- CY25 revenue was around ₹358 crore. The consolidated order book is already around ₹3,300 crore, while the India order book is around ₹1,321 crore.
- The company also announced a JSW Vijayanagar Metallics order worth around ₹1,250–1,300 crore. That shows how the combined JCIL and JCMI platform can participate in larger projects.
- One thing the market may be looking at is management's increasing focus on green steel, hydrogen steelmaking, EAF and decarbonization.
- At the same time, the parent company already has electrolyzer technology and plans to scale India electrolyzer capacity to 2 GW by 2029.
- Management is also targeting EBITDA margins of more than 10% over the next three years. They believe upstream steelmaking is a much larger opportunity than traditional downstream processing.
- Yet there is no electrolyzer business inside JCIL today. That is where people start looking for the next trigger.
- Maybe the market is already seeing the metals consolidation and the ₹3,300 crore order book. Maybe it is also looking at the possibility of moving closer to green steel and hydrogen steelmaking over time.
- But for the next re-rating, the market will probably want to see something real. Not presentations. Not possibilities. But actual commercial traction.
- Whether that comes through larger green steel orders, upstream steelmaking opportunities or hydrogen-related projects remains to be seen. That is probably what people are waiting for.
Now look at INOX India. INOX India is still primarily an Industrial Gas and LNG business.
- FY26 revenue was around ₹1,632 crore with an order book of around ₹1,514 crore. The current drivers are LNG, aerospace and Cryo Scientific.
- LNG revenue reached around ₹457 crore in FY26. Management believes LNG can grow faster than the standard products business.
- They already have around 60%–65% market share in India but only around 6%–8% globally. That itself shows how much room is still left.
- Management also highlighted a ₹200 crore aerospace order. They expect more orders of a similar nature going forward.
- They also expect strong growth in Cryo Scientific. ITER alone could contribute around ₹50–60 crore annually.
- At the same time, management is increasingly talking about hydrogen infrastructure, liquid hydrogen, energy storage and fusion. Yet most of the revenue still comes from Industrial Gas and LNG.
- Unlike many capital goods stories, INOX already operates with EBITDA margins of around 24%. ROCE is around 37% and the balance sheet remains net cash.
- The stock moved from around ₹1,400 to ₹1,700 in a month, roughly 21%. Again, the signal is visible.
- Maybe the market is already pricing LNG growth and aerospace opportunities. It may also be pricing INOX's position in future hydrogen infrastructure.
- But for the next leg, the market will likely want to see hydrogen infrastructure and Cryo Scientific become a larger part of the business. That is when it starts becoming a real business.
If you think about it, both companies sit on different parts of the same theme. JCIL is closer to the electrolyzer, green steel and hydrogen steelmaking side.
INOX India is closer to the storage and hydrogen infrastructure side. Different parts of the value chain, but connected to the same long-term opportunity.
So maybe the question is not whether Green Hydrogen grows. The question is which layer of the value chain starts showing commercial traction first.
The signal is visible. The drivers are visible.
The market is already showing what it is expecting. The question is what still needs to be proven.
Because the market does not wait for everything to show up in revenue.
First the business changes. Then revenue follows. Then profits follow.
But expectations can change much earlier and many times, that is where the stock moves first.
If you think about it, Green Hydrogen is just one part of the bigger picture.
First comes the grid. Then BESS. Then EVs and cell manufacturing.
Then battery chemicals. Then battery recycling. Then Green Hydrogen.
Then data centers. Then semiconductors. Different themes, but all connected.
The market does not focus on all of them at the same time. It moves from one cycle to the next.
That is why pattern recognition matters.
First comes the signal. Then the driver. Then the expectation gap. Then the trigger.
Sometimes the opportunity appears where the bottleneck is building. Sometimes it appears where the chokepoint is forming.
The market moves from one layer to the next. You just have to understand which cycle it is focusing on right now.
Because if you do not understand which timeline you are looking at, you can be right on the business and still be wrong on the stock.
drive.google.com/file/d/1o8R…
6
2,611
Jun 9
Did you notice today Ola is more than 6% up and Ather is 3% up?
But if you see the last one-month return of these two stocks, then Ather moved from 969 to 1033, which is around 6.6%, while Ola moved from 37 to 47, which is around 27%.
So why did Ola give a higher return than Ather, while Ather has a better business than Ola right now?
Because the market does not always reward the better business first. Sometimes it rewards the business where expectations are improving faster.
And this is exactly what I told you before about the Business Timeline, Financial Timeline and Market Timeline.
If you see the last two months' data, you will find that Ather registered 27,024 units in April and 28,190 units in May. Ola registered 12,166 units in April and 15,139 units in May. So clearly, Ather is ahead.
But here is what the market sees.
The market looks at the MoM growth rate. Ather's MoM growth was -24.3% in April and 4.3% in May. While Ola's MoM growth was 20% in April and 22% in May.
See the difference. See what the market is looking at.
And of course, there are announcements as well. But one reason the market may be reacting differently is the change in direction.
So while everyone is busy talking about the market being down, some sectors are already moving ahead. That is why looking only at the index can make you miss what is already changing.
You will also see there is so much negative talk about Ola, and many of those concerns were valid. But as an investor, you have to think in a different way.
Your focus should be on what is coming next, not just on what is happening now. It is the small details that matter and that you need to track.
Same way, the time will come for battery chemicals, battery recycling, and BESS. All of them will come cycle by cycle, one after another.
You just have to choose the right business, make the right decision, and wait.
If you want to understand Ola in much better way based on the current result then read this
x.com/ThinkWithSaurav/status…
Jun 5
I asked Grok which stock was discussed the most in India over the last week and it gave two names: Vi and Ola Electric.
Vodafone one of the most traded stocks on the NSE over the past week. It attracts heavy retail interest because of its low share price, telecom-related news, and high liquidity.
Ola also among the most active stocks, helped by EV sector interest, fundraising news, and sharp price moves that kept traders and investors talking.
Now let's apply the same framework here.
The first part of the framework is about identifying signals. The second part is about understanding the driver behind those signals.
So which one should we pick?
𝗟𝗲𝘁'𝘀 𝗽𝗶𝗰𝗸 𝗢𝗹𝗮 𝗘𝗹𝗲𝗰𝘁𝗿𝗶𝗰.
After reading the latest Q4 Results, Concall these are the signals I found.
𝗦𝗶𝗴𝗻𝗮𝗹 𝗔𝗻𝗮𝗹𝘆𝘀𝗶𝘀
> Gross Margins Improved Sharply Despite Weak Volumes
One of the biggest deviations in the numbers is the sharp improvement in gross margins. Revenue fell significantly but gross margins improved from around 18% in FY25 to over 30% in FY26 and reached 38.5% in Q4.
Normally, weaker volumes put pressure on margins. Here, margins moved in the opposite direction, making this one of the most important signals in the entire quarter.
> Warranty Costs Dropped Sharply
Warranty costs reportedly fell from ₹555 crore to ₹59 crore. Management highlighted this multiple times.
When a company repeatedly points to the same improvement across different disclosures, it usually means management sees it as an important part of the recovery story.
> Operating Expenses Reduced Materially
The company carried out a major cost reset during FY26. Operating expenses reduced significantly despite continued investment in the business.
This suggests management is trying to improve efficiency while keeping future growth plans intact.
> First Operating Cash-Flow-Positive Quarter
Management repeatedly highlighted that Q4 became the first operating-cash-flow-positive quarter. This was one of the most repeated financial signals across company communication.
For a business that has been burning cash, even a single positive quarter becomes an important signal worth tracking.
> Registration Recovery Accelerated
March, April, and May all showed sequential improvement in registrations. May registrations grew 23% month-on-month and grew faster than the broader industry.
This is important because many parts of the recovery story eventually come back to volume growth.
> The Story Shifted From Fixing Problems To Scaling Recovery
Earlier discussions focused on service issues, complaints, operational challenges, and customer dissatisfaction. The current discussion is increasingly centered around growth, utilization, recovery, and production ramp-up.
That shift in management commentary itself is a signal because it shows where management believes the business is today compared to a year ago.
> Service Moved From Weakness To Strength
Management now presents service improvement as one of the biggest achievements of FY26. It is repeatedly linked to customer satisfaction, trust rebuilding, and demand recovery.
A year ago service was one of the biggest concerns. Today it is being presented as one of the biggest strengths.
> Focus Shifted From Building Assets To Using Assets
Management repeatedly stated that most manufacturing infrastructure is already built. The focus is no longer on creating capacity but on utilizing the capacity that already exists.
This changes the discussion from capex-led growth to utilization-led growth.
> Ola Is Being Positioned As More Than An EV Company
The company is gradually expanding the narrative beyond scooters. Batteries, cell manufacturing, storage solutions, and energy infrastructure are becoming larger parts of the discussion.
The story is slowly evolving from a vehicle company into a broader mobility and energy platform.
> The Turnaround Depends Heavily On Volume Recovery
Many future outcomes appear linked to one variable. Margins, operating leverage, profitability, and cash generation all seem to improve if volumes continue recovering.
This makes volume recovery one of the most important dependency signals in the business today.
> Battery Ambitions Depend On Gigafactory Execution
A large part of the future narrative depends on successful cell manufacturing and commercialization. The battery story becomes much less attractive if execution falls behind expectations.
This makes Gigafactory execution one of the biggest dependencies in the long-term thesis.
> Recovery Story Versus Current Revenue Levels
Management is discussing recovery and growth, but reported revenue remains well below previous levels.
This creates a mismatch between the future narrative and the current financial reality.
> Positive Q4 Cash Flow Versus Full-Year Cash Burn
The company highlighted positive operating cash flow in Q4. At the same time, FY26 operating cash flow and free cash flow remained negative.
This does not mean management is wrong. It simply means one quarter has improved, while the full-year picture still requires further improvement.
> Battery Narrative Versus Current Contribution
A significant amount of management attention is directed toward batteries, cells, and storage. However, current battery contribution remains relatively small.
This creates another gap between where the company is today and where management wants the company to be.
> Absence Of Sustained Profitability
Despite operational improvements, there is still no evidence of consistent profitability. The recovery is visible, but sustainable profitability is not yet visible.
This remains one of the most important missing pieces in the story.
> Absence Of Sustained Positive Free Cash Flow
Cash burn has improved materially, but sustained positive free cash flow has not yet been established.
The business is moving in the right direction, but the journey is not complete.
> Absence Of Proof That Recovery Is Durable
Three months of registration recovery is encouraging. However, three months is not enough to prove a multi-year turnaround.
Longer-term evidence is still needed before the recovery can be considered fully established.
𝗗𝗿𝗶𝘃𝗲𝗿 𝗔𝗻𝗮𝗹𝘆𝘀𝗶𝘀
After identifying the signals, the next question becomes what is actually driving these changes?
Volume recovery appears to be one of the biggest drivers in the entire story. Registrations improved across March, April, and May, while management repeatedly linked future growth and breakeven to continued volume expansion.
Service improvement is another major driver. Turnaround times improved, backlogs reduced, parts availability improved, technician productivity increased, and warranty costs fell sharply. Many of the recovery signals seem connected to service execution improving.
Gross margin expansion appears to be driven by better product economics, Gen 3 products, cost reductions, and increasing vertical integration. The improvement looks operational rather than purely financial.
Operating leverage is another important driver. Most manufacturing assets are already built, so future improvement depends more on utilization than on creating new capacity.
The battery story is being driven by Gigafactory commercialization. Cell manufacturing is moving from validation toward commercial scale-up, while own-cell integration is increasing over time.
The broader battery and storage ecosystem is also becoming a larger part of the narrative. Management increasingly presents vehicles, batteries, cells, and storage as connected businesses rather than separate opportunities.
Cash-flow improvement appears to be driven by lower costs, better working capital management, and improved operational efficiency. Meanwhile, the ₹780 crore QIP strengthened liquidity and provided additional capital for execution.
𝗗𝗲𝗽𝗲𝗻𝗱𝗲𝗻𝗰𝘆 𝗔𝗻𝗮𝗹𝘆𝘀𝗶𝘀
Once the drivers are identified, the next question is what those drivers depend on.
Volume recovery depends on service quality remaining strong and customer trust continuing to improve. Roadster demand, production ramp-up, and network productivity also need to keep moving in the right direction.
Service turnaround depends on parts availability, technician productivity, repair capability, and operational discipline. As volumes increase, maintaining service quality becomes increasingly important.
Gross margin expansion depends on maintaining product mix, pricing discipline, cost control, vertical integration, and increasing own-cell adoption. If any of these weaken, margin expansion may slow.
Operating leverage depends on higher volumes and better factory utilization. The existing manufacturing base creates an advantage only if demand continues growing.
Gigafactory commercialization depends on manufacturing yields improving, successful scale-up, own-cell integration, and eventual commercial adoption. The battery opportunity remains heavily dependent on execution.
The battery and storage ecosystem depends on storage adoption, product commercialization, technology execution, and eventually creating demand beyond Ola's own vehicle platform.
Cash-flow improvement depends on volume growth continuing, margins remaining healthy, working capital discipline staying intact, and assets being utilized more efficiently.
Capital availability depends on investor confidence, execution progress, business recovery, and management's ability to demonstrate future growth opportunities.
𝗕𝗿𝗲𝗮𝗸 𝗔𝗻𝗮𝗹𝘆𝘀𝗶𝘀
The next question is what can break the story.
The recovery story can break if service quality weakens again, customer trust deteriorates, demand recovery slows, or competition becomes more aggressive. Since many parts of the thesis depend on higher volumes, any slowdown in registrations becomes important.
The service turnaround can break if volumes scale faster than service capacity. Parts availability issues or rising customer complaints could also reverse some of the progress made so far.
Gross margin expansion can break if commodity costs rise, pricing pressure increases, or factory utilization falls. Margin gains need support from both execution and scale.
Operating leverage can break if volumes fail to scale as expected. Large manufacturing assets become less valuable if utilization remains low.
The Gigafactory story can break if scale-up gets delayed, yields disappoint, or external demand develops more slowly than expected. Battery manufacturing remains an execution-heavy business.
The battery and storage ecosystem can break if adoption remains slower than expected or if economics fail to scale. Building an ecosystem is very different from building a vehicle business.
Cash-flow improvement can break if revenue recovery stalls, margins compress, or working capital requirements increase again.
Capital availability can become a challenge if execution disappoints or investor confidence weakens. Access to capital is easier when the business continues moving in the right direction.
𝗩𝗲𝗿𝗶𝗳𝗶𝗰𝗮𝘁𝗶𝗼𝗻 𝗔𝗻𝗮𝗹𝘆𝘀𝗶𝘀
The final step is separating what is already visible from what still needs proof.
Some improvements are already visible in the numbers and management commentary. Service metrics improved, warranty costs reduced sharply, gross margins expanded significantly, and registrations recovered for three consecutive months.
Q4 also became operating-cash-flow positive, while the company successfully completed the ₹780 crore QIP. These developments are visible today and do not require assumptions.
At the same time, several important parts of the story still need proof. Sustained profitability has not yet been demonstrated, and sustained positive free cash flow is still not visible.
Long-term volume recovery remains unproven, while large-scale battery monetization and commercial success of storage products still sit in the future. The ability to build a battery ecosystem beyond captive vehicle demand also remains a thesis rather than a proven outcome.
𝗪𝗵𝗮𝘁 𝗗𝗼 𝗪𝗲 𝗚𝗲𝘁 𝗪𝗵𝗲𝗻 𝗪𝗲 𝗖𝗼𝗺𝗯𝗶𝗻𝗲 𝗔𝗹𝗹 𝗢𝗳 𝗧𝗵𝗶𝘀?
The signals tell us what is changing. The drivers explain why those changes are happening, while the dependencies show what must continue for the improvement to last.
The break analysis shows where the story is vulnerable, and the verification analysis separates what is already visible from what still needs evidence.
When everything is connected together, one thing becomes clear. The core story today is not profitability. The core story is recovery.
Volume recovery appears to be driving margins, operating leverage, cash-flow improvement, and eventually the path toward profitability. Most positive developments in the business seem to connect back to that single variable.
At the same time, management is trying to build a second layer of growth around batteries, cells, Gigafactory commercialization, and energy storage. That opportunity may become important in the future, but most of it still needs execution and proof.
So when I connect all the signals, drivers, dependencies, risks, and verification points together, the biggest question is not whether improvement has started. The numbers suggest it has.
The bigger question is whether volume recovery can continue long enough to convert operational improvements into sustainable profitability, sustainable cash generation, and eventually a successful battery and energy ecosystem.
𝗜𝗳 𝘆𝗼𝘂 𝗮𝗿𝗲 𝗮𝗹𝗿𝗲𝗮𝗱𝘆 𝗶𝗻𝘃𝗲𝘀𝘁𝗲𝗱, 𝗼𝗿 𝘁𝗵𝗶𝗻𝗸𝗶𝗻𝗴 𝗮𝗯𝗼𝘂𝘁 𝗶𝗻𝘃𝗲𝘀𝘁𝗶𝗻𝗴, 𝘁𝗵𝗲𝘀𝗲 𝗮𝗿𝗲 𝘁𝗵𝗲 𝘁𝗵𝗶𝗻𝗴𝘀 𝗜 𝘄𝗼𝘂𝗹𝗱 𝘁𝗿𝗮𝗰𝗸 𝗶𝗻 𝘁𝗵𝗲 𝗻𝗲𝘅𝘁 𝗾𝘂𝗮𝗿𝘁𝗲𝗿.
- Are registrations still improving three to six months from now?
- Are higher volumes translating into better profitability and cash generation?
- Is service quality staying strong as more vehicles enter the network?
- Is operating cash flow remaining positive quarter after quarter?
- Is management executing on Gigafactory and battery milestones?
- Is the battery story starting to show up in revenue, customers, and commercial adoption?
354
Jun 9
See, today MSTC is up 11%, Gravita is almost 3% up, POCL is 0.5% up and Nile is almost 1% up. But Eco Reco is near 2% down and Namo eWaste is 0.20% down, which is not much.
But see the pattern here and understand how this theme is reacting while you think the market is down. Even if you look at the price action of these stocks over the last 1 month, they are not that down. In fact, a few are up. It is the market pressure that is keeping them down. Otherwise, they could have done even better.
Now after some time, when they start giving very good returns and a few of them even become 2x based on market expectations, people will ask when the rerating happened. But rerating starts when expectations change, not when everyone notices.
All you have to understand is this. Can they crush battery cells and make black mass? And can they refine that black mass into pure lithium?
And the feedstock problem you see, as I told you before 2027 is the checkpoint, 2028 is the chokepoint and 2029 is the bottleneck point.
If you want to understand the theme better, read the reports from Attero and Lohum. Then stop looking only at the index.
Now if you think MSTC is also involved and that is the reason it is up 11% today, then you have to think in a different way. Its up today because it is connected to vehicle scrapping and the gov recently approved a ₹9.5k crore scrappage scheme, that is why MSTC is up.
Now see the timeline here.
Namo eWaste has an active battery capacity of 12,240 MTPA today, and its total multi-material capacity will be 68,000 MTPA by Q3 FY26.
Eco Reco has an active battery capacity of 6,000 MTPA today, and its total group capacity will be 25,200 MTPA as its infrastructure scales.
Gravita India has a pilot battery capacity of 6,000 MTPA today, and its total group recycling capacity will be over 800,000 MTPA by FY27–FY28.
Nile Ltd. has zero active lithium-ion capacity today, and its battery recycling capacity will be fully operational by late FY27.
POCL has zero active lithium-ion capacity today, and its commercial battery extraction capacity will be fully deployed by FY27–FY28.
The first chokepoint will come around FY26–FY27. Based on that, the first rerating can come for early movers like Namo eWaste and Eco Reco as they absorb early factory scrap, e-waste and compliance credits under stricter laws.
And when the big volume bottleneck comes around FY29, as the large wave of dead EV battery packs enters the system, the next phase of rerating will depend on actual results.
But what did I tell you earlier? Price movement can happen much earlier because you have to understand the timeline here and there are three timelines.
One is the Business Timeline — when the business changes.
Then comes the Financial Timeline — when that change starts showing up in revenue, margins, earnings, or cash flow.
And then comes the Market Timeline — when expectations change.
Because the market does not always wait for revenue. Revenue does not always wait for profits and profits do not always show up in cash flow immediately.
If you do not understand which timeline you are looking at, you can be right about the business and still be wrong on the stock.
So now you are smart enough to think from here, take the right decision and choose the right timeline.
-
Same way, when you think about BESS, you have to make your own priorities. Don't just look at how many orders they got. See what problem they can solve and where the margins will come from.
Because people think BESS is a very simple sector. It is not. So if you want to understand BESS properly, read those reports.
x.com/ThinkWithSaurav/status…
and if you want to understand the whole battery ecosystem well without any confusion then read this.
x.com/ThinkWithSaurav/status…
Jun 7
Before looking at battery chemical companies, first see where the demand actually starts.
Today, Amara Raja is already seeing demand through lithium packs and energy-storage solutions, while Exide is moving through validation and commissioning.
So FY26–FY27 is likely to be about qualification, testing, commissioning, and initial production.
Remember, demand is not only about EVs. BESS equally important demand drivers over the next few years.
Now once cell production starts moving toward commercialization during FY27–FY29, demand starts flowing to electrolyte and lithium-salt suppliers.
This is where GFCL and Neogen fit in because every battery cell needs these materials.
GFCL is working on LiPF6 and related battery-material opportunities, while Neogen is focused on electrolytes and lithium-salt chemistry.
As cell manufacturing scales, these become some of the earliest material layers that can benefit.
Cathode materials are still much earlier compared to anodes and electrolytes, which means this part of the chain may take longer to develop.
That is one reason why most listed opportunities today are concentrated around anodes, electrolytes, graphite, and recycling rather than cathodes.
As battery production increases, demand also moves to anodes and advanced battery materials.
This is where Himadri and PCBL fit into the chain.
Today, Himadri is building its position in synthetic graphite and anode materials, while PCBL is working on conductive carbon and advanced battery-material opportunities.
If domestic cell manufacturing scales during FY27–FY29, commercial demand can start increasing.
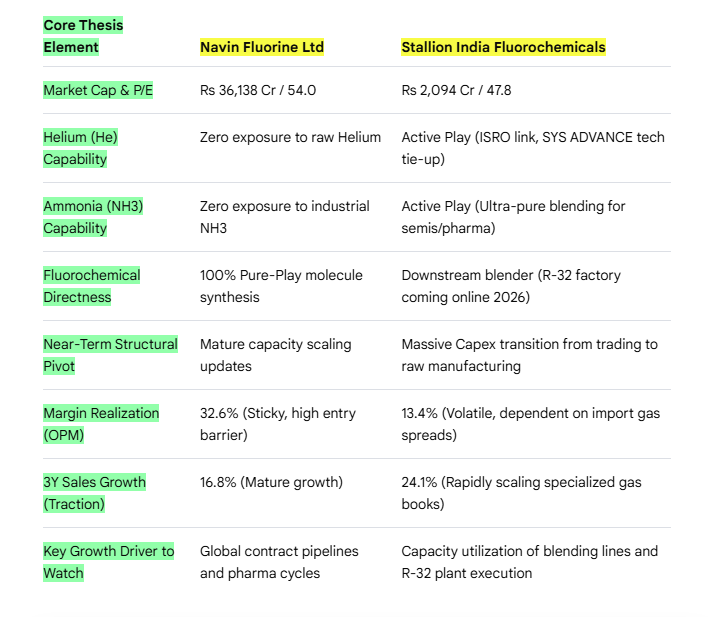
As the ecosystem grows further, HEG, Graphite India, Navin Fluorine, SRF, and Tanfac can also become relevant because their opportunity depends on the earlier layers scaling successfully.
For HEG and Graphite India, battery-grade graphite remains the long-term opportunity.
For Navin Fluorine, SRF, and Tanfac, the opportunity comes through fluorochemical capabilities that may become relevant to battery materials over time.
But ruko bhai. The cycle does not end when a battery is sold.
Those batteries eventually come back into the system and become feedstock for recyclers.
India saw a major increase in electric two-wheeler adoption during FY22–FY23.
So around FY27–FY28, some of those batteries can start entering replacement and recycling channels.
Along with this, manufacturing scrap and rejected cells from new plants can also become an early source of feedstock.
This is where Eco Recycling, Namo eWaste, Nile, POCL through ACE Green, and later Gravita start becoming relevant.
The biggest challenge for recyclers is not capacity but feedstock availability.
That is why the volume of batteries coming back into the system matters more than installed recycling capacity.
So if we connect everything together, the cycle starts with Exide and Amara Raja.
Their success matters because they are the companies that can create domestic demand for the rest of the battery-material ecosystem.
Then demand moves to GFCL and Neogen, followed by Himadri and PCBL.
As the chain grows further, HEG, Graphite India, Navin Fluorine, SRF, and Tanfac can also participate.
And later, the recycling side starts opening up through Eco Recycling, Namo eWaste, Nile, POCL through ACE Green, and Gravita.
Now let us see where each company stands today and what the next few years could look like.
Amara Raja is already seeing demand through packs and energy-storage solutions. More than 250 MWh of telecom packs were supplied in Q3 FY26, New Energy revenue crossed ₹200 Cr, and a 5 GWh BESS plant has been approved.
FY27 could be about bringing the BESS plant into operation. Then FY27–FY29 could be about cell manufacturing ramp-up, customer qualification, and commercialization.
If execution goes well, FY29–FY32 could be where higher utilization and meaningful earnings contribution start becoming visible.
Exide is currently in the validation and commissioning stage. The company has already invested around ₹4,252 Cr into its lithium business, and cylindrical cell validation is underway.
FY27 could be more about commissioning and customer approvals. Then FY27–FY29 could be about cell commercialization and initial production ramp-up.
FY29–FY32 becomes more about utilization, localization, and scale.
GFCL is in the early commercialization stage today. LiPF6 is already commercial and repeat orders have started coming in.
FY27–FY29 could be about scale-up, customer additions, and utilization improvement.
Then FY29–FY32 could be where battery chemicals become a bigger contributor to the business.
Neogen is still in the approval and qualification stage today.
FY27–FY29 could be about converting approvals into contracts and volume ramp-up.
FY29–FY32 could be about utilization and earnings visibility.
Himadri is currently in the qualification and customer-validation stage.
FY27–FY29 could be about anode commercialization.
If customer testing converts into orders, FY29–FY32 could be where scale starts becoming visible.
PCBL remains in the development stage today.
Early adoption may come during FY27–FY29.
A larger battery-material contribution may become visible in FY29–FY32.
HEG and Graphite India are still mainly graphite-electrode businesses today.
Battery-grade graphite remains the long-term opportunity.
Something may start becoming visible between FY27–FY30, but meaningful contribution is likely beyond FY30.
Navin, SRF, and Tanfac are still driven mainly by their existing fluorochemical businesses.
Battery opportunities may start appearing during FY27–FY30, but any meaningful contribution is likely to come later.
Now come back to recycling, because this is where many people miss the bigger picture.
Feedstock availability remains the biggest thing to watch.
If batteries are not coming back into the system, capacity alone does not help.
Eco Reco already has around 6,000 MTPA of active capacity today.
The company could be among the earliest beneficiaries as manufacturing scrap, rejected cells, and replacement batteries start entering the system.
Namo ewaste currently has around 12,240 MTPA of active capacity.
The opportunity depends on how quickly battery volumes start coming back into the system.
Nile is building its battery-recycling setup, with capacity expected around late FY27.
That broadly matches the period when early EV batteries and manufacturing scrap may start becoming available in larger quantities.
POCL, through its investment in ACE Green Recycling, is targeting the FY27–FY28 period.
If feedstock starts increasing, the company could benefit from the early recycling cycle.
Gravita is likely to become more relevant slightly later.
The company already has strong recycling experience, but the battery opportunity may become more meaningful from FY29 onward as battery volumes start returning.
Now if you are thinking about the China problem, then ruko bhaiya.
BESS demand does not depend on Indian cell manufacturing alone.
Even if cells or batteries are imported, BESS projects can still keep growing.
Ab socho. Let Exide and Amara Raja first reach full capacity and start scaling properly.
Then see what happens.
Just like we saw policy support in solar, you could see support coming across different parts of the battery chain as well.
And remember what the government said through the National Critical Mineral Mission. The focus is not only on making batteries.
The focus is also on materials, processing, and recycling inside India.
You all the time ask where to look for ideas for the next few years. Bhai, it is sitting right in front of you.
The whole battery chain is still getting built layer by layer.
The question is not whether demand comes. The question is which companies actually turn that demand into orders, sales, and profits.
That is what will decide where the real value gets created.
1
1
6
1,281
Jun 7
Before looking at battery chemical companies, first see where the demand actually starts.
Today, Amara Raja is already seeing demand through lithium packs and energy-storage solutions, while Exide is moving through validation and commissioning.
So FY26–FY27 is likely to be about qualification, testing, commissioning, and initial production.
Remember, demand is not only about EVs. BESS equally important demand drivers over the next few years.
Now once cell production starts moving toward commercialization during FY27–FY29, demand starts flowing to electrolyte and lithium-salt suppliers.
This is where GFCL and Neogen fit in because every battery cell needs these materials.
GFCL is working on LiPF6 and related battery-material opportunities, while Neogen is focused on electrolytes and lithium-salt chemistry.
As cell manufacturing scales, these become some of the earliest material layers that can benefit.
Cathode materials are still much earlier compared to anodes and electrolytes, which means this part of the chain may take longer to develop.
That is one reason why most listed opportunities today are concentrated around anodes, electrolytes, graphite, and recycling rather than cathodes.
As battery production increases, demand also moves to anodes and advanced battery materials.
This is where Himadri and PCBL fit into the chain.
Today, Himadri is building its position in synthetic graphite and anode materials, while PCBL is working on conductive carbon and advanced battery-material opportunities.
If domestic cell manufacturing scales during FY27–FY29, commercial demand can start increasing.
As the ecosystem grows further, HEG, Graphite India, Navin Fluorine, SRF, and Tanfac can also become relevant because their opportunity depends on the earlier layers scaling successfully.
For HEG and Graphite India, battery-grade graphite remains the long-term opportunity.
For Navin Fluorine, SRF, and Tanfac, the opportunity comes through fluorochemical capabilities that may become relevant to battery materials over time.
But ruko bhai. The cycle does not end when a battery is sold.
Those batteries eventually come back into the system and become feedstock for recyclers.
India saw a major increase in electric two-wheeler adoption during FY22–FY23.
So around FY27–FY28, some of those batteries can start entering replacement and recycling channels.
Along with this, manufacturing scrap and rejected cells from new plants can also become an early source of feedstock.
This is where Eco Recycling, Namo eWaste, Nile, POCL through ACE Green, and later Gravita start becoming relevant.
The biggest challenge for recyclers is not capacity but feedstock availability.
That is why the volume of batteries coming back into the system matters more than installed recycling capacity.
So if we connect everything together, the cycle starts with Exide and Amara Raja.
Their success matters because they are the companies that can create domestic demand for the rest of the battery-material ecosystem.
Then demand moves to GFCL and Neogen, followed by Himadri and PCBL.
As the chain grows further, HEG, Graphite India, Navin Fluorine, SRF, and Tanfac can also participate.
And later, the recycling side starts opening up through Eco Recycling, Namo eWaste, Nile, POCL through ACE Green, and Gravita.
Now let us see where each company stands today and what the next few years could look like.
Amara Raja is already seeing demand through packs and energy-storage solutions. More than 250 MWh of telecom packs were supplied in Q3 FY26, New Energy revenue crossed ₹200 Cr, and a 5 GWh BESS plant has been approved.
FY27 could be about bringing the BESS plant into operation. Then FY27–FY29 could be about cell manufacturing ramp-up, customer qualification, and commercialization.
If execution goes well, FY29–FY32 could be where higher utilization and meaningful earnings contribution start becoming visible.
Exide is currently in the validation and commissioning stage. The company has already invested around ₹4,252 Cr into its lithium business, and cylindrical cell validation is underway.
FY27 could be more about commissioning and customer approvals. Then FY27–FY29 could be about cell commercialization and initial production ramp-up.
FY29–FY32 becomes more about utilization, localization, and scale.
GFCL is in the early commercialization stage today. LiPF6 is already commercial and repeat orders have started coming in.
FY27–FY29 could be about scale-up, customer additions, and utilization improvement.
Then FY29–FY32 could be where battery chemicals become a bigger contributor to the business.
Neogen is still in the approval and qualification stage today.
FY27–FY29 could be about converting approvals into contracts and volume ramp-up.
FY29–FY32 could be about utilization and earnings visibility.
Himadri is currently in the qualification and customer-validation stage.
FY27–FY29 could be about anode commercialization.
If customer testing converts into orders, FY29–FY32 could be where scale starts becoming visible.
PCBL remains in the development stage today.
Early adoption may come during FY27–FY29.
A larger battery-material contribution may become visible in FY29–FY32.
HEG and Graphite India are still mainly graphite-electrode businesses today.
Battery-grade graphite remains the long-term opportunity.
Something may start becoming visible between FY27–FY30, but meaningful contribution is likely beyond FY30.
Navin, SRF, and Tanfac are still driven mainly by their existing fluorochemical businesses.
Battery opportunities may start appearing during FY27–FY30, but any meaningful contribution is likely to come later.
Now come back to recycling, because this is where many people miss the bigger picture.
Feedstock availability remains the biggest thing to watch.
If batteries are not coming back into the system, capacity alone does not help.
Eco Reco already has around 6,000 MTPA of active capacity today.
The company could be among the earliest beneficiaries as manufacturing scrap, rejected cells, and replacement batteries start entering the system.
Namo ewaste currently has around 12,240 MTPA of active capacity.
The opportunity depends on how quickly battery volumes start coming back into the system.
Nile is building its battery-recycling setup, with capacity expected around late FY27.
That broadly matches the period when early EV batteries and manufacturing scrap may start becoming available in larger quantities.
POCL, through its investment in ACE Green Recycling, is targeting the FY27–FY28 period.
If feedstock starts increasing, the company could benefit from the early recycling cycle.
Gravita is likely to become more relevant slightly later.
The company already has strong recycling experience, but the battery opportunity may become more meaningful from FY29 onward as battery volumes start returning.
Now if you are thinking about the China problem, then ruko bhaiya.
BESS demand does not depend on Indian cell manufacturing alone.
Even if cells or batteries are imported, BESS projects can still keep growing.
Ab socho. Let Exide and Amara Raja first reach full capacity and start scaling properly.
Then see what happens.
Just like we saw policy support in solar, you could see support coming across different parts of the battery chain as well.
And remember what the government said through the National Critical Mineral Mission. The focus is not only on making batteries.
The focus is also on materials, processing, and recycling inside India.
You all the time ask where to look for ideas for the next few years. Bhai, it is sitting right in front of you.
The whole battery chain is still getting built layer by layer.
The question is not whether demand comes. The question is which companies actually turn that demand into orders, sales, and profits.
That is what will decide where the real value gets created.
2
8
29
4,669