
Family First, as that is true wealth. 💙🙏🏽
Joined March 2022
- Tweets 17,680
- Following 645
- Followers 493
- Likes 17,563
6,475 Photos and videos


TitaniumMoonShot retweeted

Jun 4
Threw 50k at $SPCX launch.
Chances are I’m lucky to get 10 🤣
Who else went for it when they got the notification?


55
29
463
116,793

Spring trout stockings are wrapped up until October, but the fishing action is just heating up! Summer is the perfect time to cast a line for bass, bluegill and other warmwater fish in our beautiful lakes and rivers. Get your license and get out there! ☀️🎣

2
9
236
Mark your calendars! The youth fishing derby at Little Beaver State Park is this Saturday from 9-12. Registration is 9-10:30 a.m. This free event is open to anglers ages 3-14, who must be registered by an adult to participate and be eligible for prizes.

1
5
129
TitaniumMoonShot retweeted

Jun 2
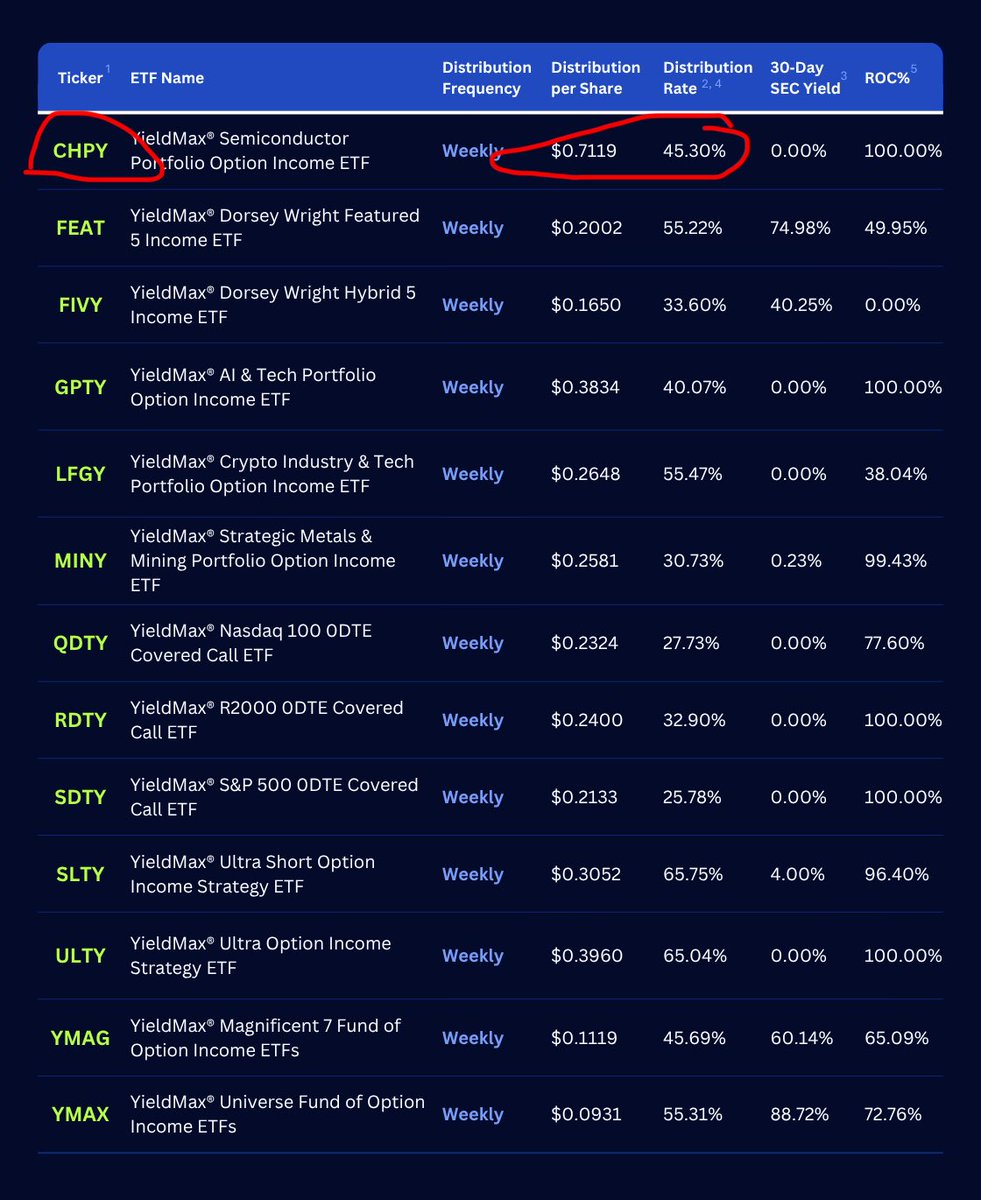
$CHPY dividend announcement for this week comes in at $0.7119 per share, the highest ever, which is a 45.3% annualized rate. 💰🤑
14
8
128
6,949
TitaniumMoonShot retweeted

May 31
Feliz por voltar a casa com a família 🙌🏽🇵🇹

11,604
40,615
1,041,042
34,205,666
TitaniumMoonShot retweeted

Dark fantasy vibes in full effect.
This incredible skull sculpt by @BustMaker was printed on the UniFormation GK3 Pro, then brought to life through an intense painting process full of texture, shadows, and weathering
#UniFormation #gk3pro #resinprinting #3dprinting #painting
1
2
80
🚨 Check the source before you share the post!
This is a reminder that we share information online ONLY through our official website and social media accounts.
So, if you see posts claiming to represent the WVDNR, please check our official channels for accurate information.

3
5
141
TitaniumMoonShot retweeted

May 29
Looking forward to getting back to Panama City Beach for @GulfCoastJam June 3-6, 2027.🤘🏼 Grab your tickets and I'll see ya there. tixr.com/e/189944
39
62
189
15,533
West Virginia has many lakes with plenty of fish to catch and easy access for both boats and bank anglers. Learn more about West Virginia’s fishing lakes, streams and rivers at mapwv.gov/huntfish.

3
14
223
TitaniumMoonShot retweeted

May 29
Slide your memories into this 3D printed photo book — because they deserve a place beyond your phone🥰
👉Printer: QIDI Q2🔗qidi3d.com/products/qidi-q2
Designer: TUITXY (Makerworld)
#QIDI #QIDIQ2 #3Dprinting #lifehack #photoalbum
3
8
476
TitaniumMoonShot retweeted

May 29
If you don’t know what to buy… here is your cheat sheet

28
117
1,206
72,774
TitaniumMoonShot retweeted
May 27
Just print it!
Make your T-shirts unique with 3D printing🤩🤩
👉Printer: QIDI MAX4🔗qidi3d.com/products/max4
#QIDI #QIDIMax4 #3dprinting #diytshirts #LifeHacks
3
4
40
6,315
TitaniumMoonShot retweeted
May 20
Wow! @REXShares going weekly!
This is news to me. I can dig it.
May 20

💰 REX $FEPI, $CEPI, and $AIPI Switching to Weekly Distributions Effective May 28th
$AIPI AI Equity Income ETF: 34.84% Yield
$FEPI FANG & Innovation Income ETF: 25.21% Yield
$CEPI REX Crypto Equity Income ETF: 42.00% Yield
💸The Weekly pay ETF lineup continues to grow

8
4
47
4,971
TitaniumMoonShot retweeted
May 20
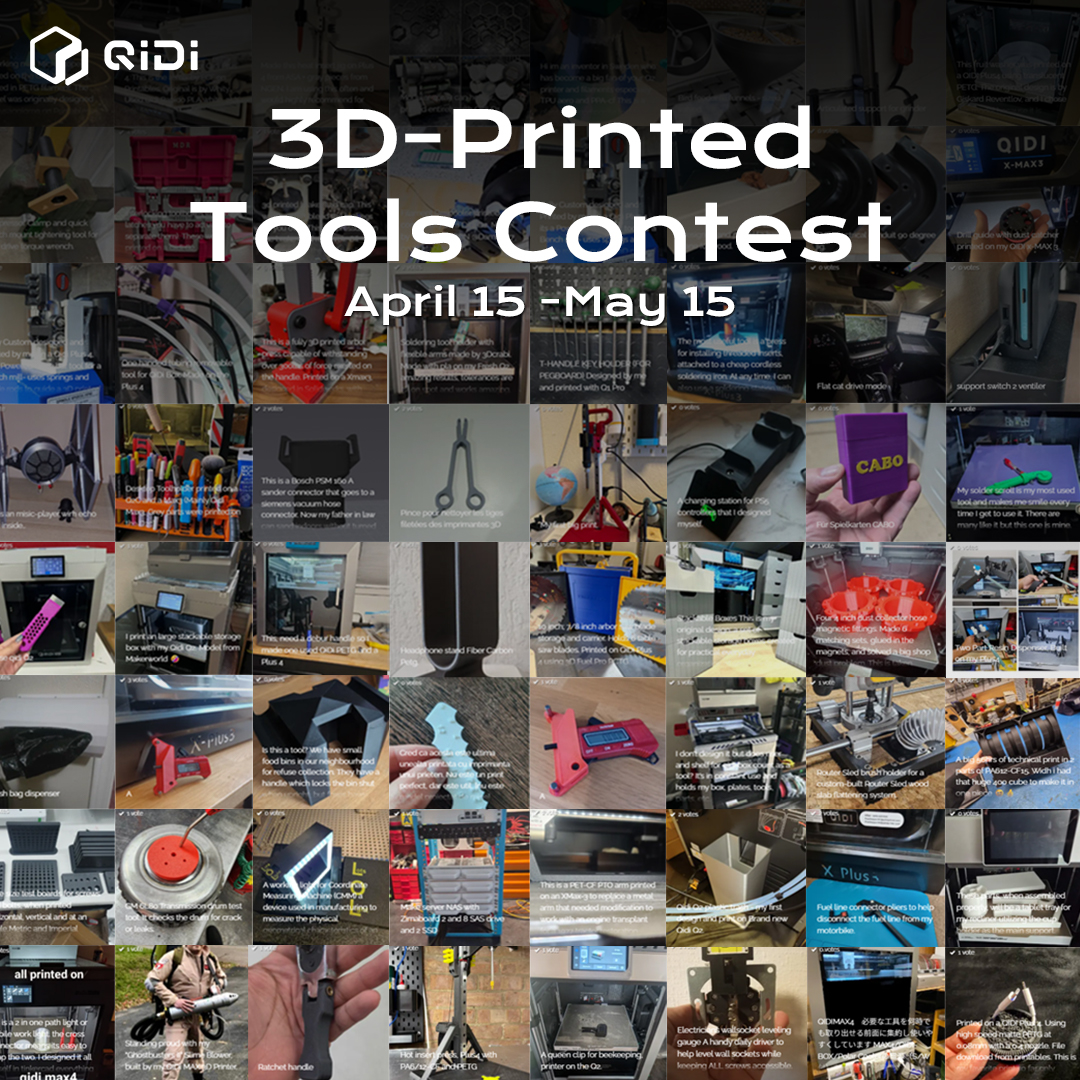
🎉 QIDI 3D-Printed Tools Contest has officially ended! Thank you all for your amazing participation.
Congratulations to our winners! 👏Please check the email you used to enter the contest to claim your prize.
For those who didn’t win this time — don’t be discouraged! Your next chance is here.
💡 Join our Geek Spirit 3D Printing Contest and show us your creativity: qidi3d.com/pages/geek-spirit…
🏆 Tips to Stand Out & Win:
Share your contest model on social media with these hashtags:
#QIDIGeekSpirit #QIDIHighQualityPrint
Good luck, and keep creating! 🚀


1
8
538
TitaniumMoonShot retweeted

May 20
BREAKING:
🇺🇸 🇮🇷 🇵🇰 Reports suggest a US-Iran agreement is close to being finalized.
Pakistan’s Army Chief may visit Iran tomorrow to announce the final draft of the agreement text.
Next round of negotiations to be held in Islamabad.
IF TRUE, VERY GOOD FOR MARKETS!
105
145
996
137,333
TitaniumMoonShot retweeted

May 18
Distribution News for REX Growth & Income ETF Holders!
Pay date: 05/20/2026
REX NVDA Growth & Income ETF $NVII
Amount: $0.2602
REX TSLA Growth & Income ETF $TSII
Amount: $0.2013
REX WMT Growth & Income ETF $WMTI
Amount: $0.1361
REX MSTR Growth & Income ETF $MSII
Amount: $0.0446
REX COIN Growth & Income ETF $COII
Amount: $0.0506
REX HOOD Growth & Income ETF $HOII
Amount: $0.0568
REX LLY Growth & Income ETF $LLII
Amount: $0.1754
REX CRWV Growth & Income ETF $CWII
Amount: $0.0904
REX PLTR Growth & Income ETF $PLTI
Amount: $0.0526
*As of 5/18/26. The Distribution Rate is the annual yield an investor would receive if the most recently declared distribution, which includes option income, remained the same going forward. The Distribution Rate is calculated by multiplying an ETF's Distribution per Share by fifty-two (52), and dividing the resulting amount by the ETF's most recent NAV. The Distribution Rate represents a single distribution from the ETF and does not represent its total return.
**As of 4/30/26. The 30-Day SEC Yield represents net investment income, which excludes option income, earned by such ETF over the 30-Day period, expressed as an annual percentage rate based on such ETF's share price at the end of the 30-Day period.
***NVII, TSII, WMTI, MSII, COII, HOII, LLII, CWII, & PLTI's current distributions consist of estimated return of capital (ROC). For full details on the composition of distributions, please refer to the latest 19a-1 notices. The REX NVDA Growth & Income ETF, the REX TSLA Growth & Income ETF, the REX WMT Growth & Income ETF, the REX MSTR Growth & Income ETF, the REX COIN Growth & Income ETF, the REX HOOD Growth & Income ETF, the REX LLY Growth & Income ETF, the REX CRWV Growth & Income ETF, and the REX PLTR Growth & Income ETF have a gross expense ratio of 0.99%. There is no guarantee that the Funds will be successful in their attempt to provide leveraged exposure to the underlying stocks or pay weekly distributions.
The Funds are not suitable for all investors. These distribution rates caused by unusually favorable market conditions may not be sustainable. Such conditions may not continue to exist and there should be no expectation that this performance may be repeated in the future. The performance data quoted represents past performance. Past performance does not guarantee future results. The investment return their original cost and current performance may be lower or higher than the performance quoted. Performance current to the most recent month-end can be obtained by calling 1-844-802-4004. Short term performance, in particular, is not a good indication of the fund's future performance, and an investment should not be made based solely on returns.

4
10
70
7,105
TitaniumMoonShot retweeted
Sometimes a model just clicks the moment you see it.
This 1/6 scale NightCrawler by Jace the Sculptor had that energy right away — dynamic pose, clean flow, and tons of sharp details.
Printed on UniFormation GK3 Pro
#uniformation #uniformation3d #gk3pro #NightCrawler #3dprinting
1
1
80
TitaniumMoonShot retweeted
Apr 3
Meet Tom the Lizard! 🦎
Shake it, and watch it enter a frenzied, silly state.
Model by Maraxos3D, 张大山l (Makerworld)
Printer: QIDI Q2🔗qidi3d.com/products/qidi-q2
#QIDI #QIDIQ2 #3Dprinting #lizard
1
2
5
838
TitaniumMoonShot retweeted

Jan 19
🛒 Book AtomForm Pallete 300:
•atomform.tech/products/palet…
•kickstarter.com/projects/195…
8
5
12
682