
Informing action for healthier communities
Joined September 2017
- Tweets 1,042
- Following 76
- Followers 187
- Likes 157
177 Photos and videos
Pinned Tweet

30 Sep 2025
🔍 New study finds uneven benefits from California's #Chlorpyrifos ban. Following the ban, we found #organophosphate #pesticide use ⬇️ 54% statewide - but not every region benefitted equally:
Read the full publication ➡️ rdcu.be/eINeU
44
3 Oct 2025
"Study found that Monterey County #organophosphate #Pesticides use increased by 26% between 2016 and 2021, with over half of #pregnant women in the County living within 1km of an application site during pregnancy" ➡️ montereyherald.com/2025/10/0…
110
30 Sep 2025
We found that in 9 counties, 1 in 5 #pregnant people live within 1km of #organophosphate use and in #Monterey county, that number rose to 1 in 2. Throughout the state, expecting Hispanic/Latine people were most likely to live near organophosphate pesticide use.
30 Sep 2025

The #sanjoaquinvalley benefitted the most from the #chlorpyrifos ban, with total organophosphate use ⬇️ by 74%; in contrast, the #centralcoast, home to much of the country's strawberry and lettuce supply, saw total organophosphate use UNCHANGED comparing pre- and post-ban
133
30 Sep 2025
The #sanjoaquinvalley benefitted the most from the #chlorpyrifos ban, with total organophosphate use ⬇️ by 74%; in contrast, the #centralcoast, home to much of the country's strawberry and lettuce supply, saw total organophosphate use UNCHANGED comparing pre- and post-ban
30 Sep 2025
🔍 New study finds uneven benefits from California's #Chlorpyrifos ban. Following the ban, we found #organophosphate #pesticide use ⬇️ 54% statewide - but not every region benefitted equally:
Read the full publication ➡️ rdcu.be/eINeU
153
11 Jul 2025
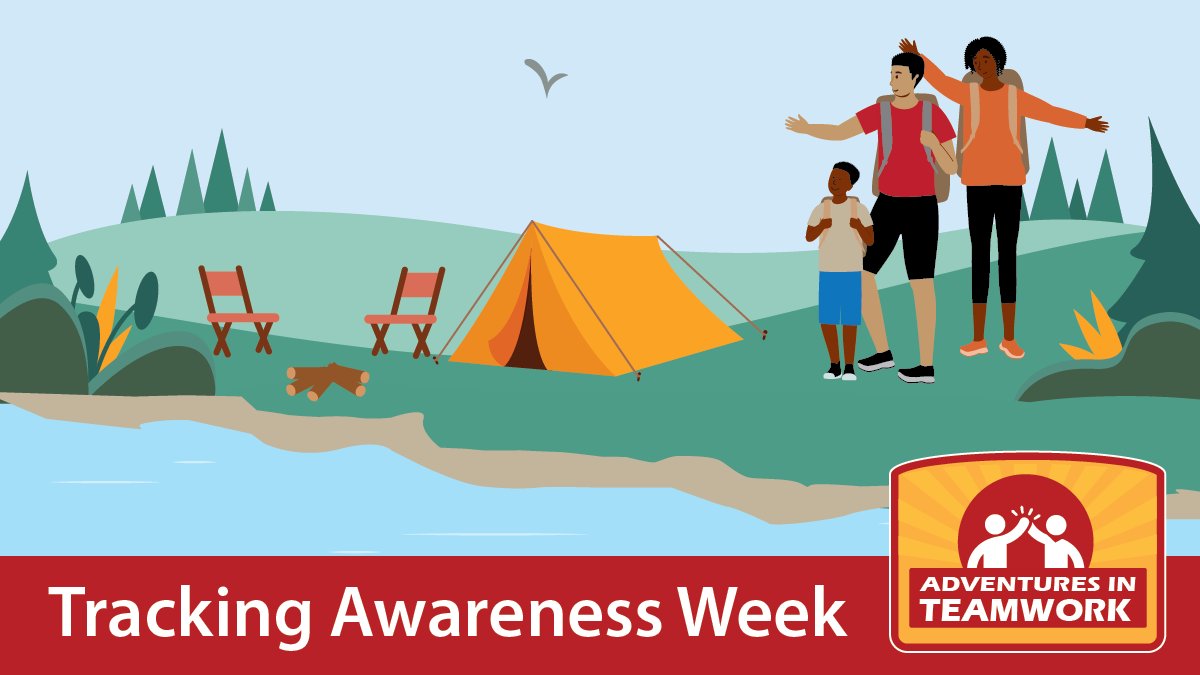
Communities across California are increasingly facing #extremeheat and #wildfire smoke - often at the same time. Last month, we hosted a #webinar exploring exposure & vulnerability through data and tools #futuredirection #taw2025 youtube.com/watch?v=Ru3FwkXU…
12 Jul 2024
Innovation is part of the Tracking Program's DNA - learn about our program's future additions and enhancements to our data and tools. #beadataexplorer #taw2024
33
11 Jul 2025
We're partnering with Roots of Change to launch a new project to protect #farmworkers from #extremeheat in the Central Valley. This project aims to strengthen Terra Bella community's ability to respond to extreme heat by developing a school-based #resilience hub #throughtheyears
15
10 Jul 2025
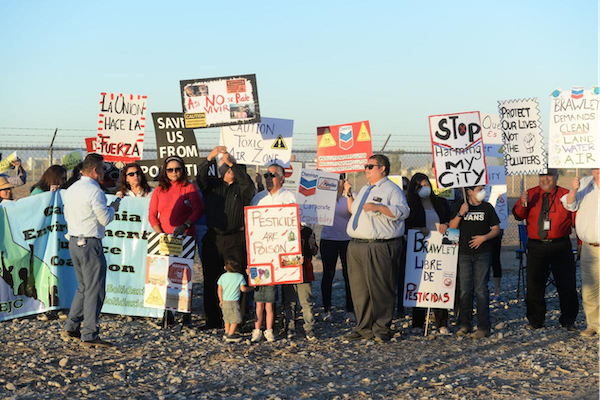
In our Brawley Health ACTION environmental study, we convened a #communityadvisorygroup of local leaders to give guidance and feedback. They ensured we answered community questions about soil contamination and were also involved in a history assessment #throughtheyears
15 Jul 2021
With the Brawley Health ACTION Environmental Study we are working with community to learn about a contamination site and other sources of pollution that have been longstanding EJ concerns. Learn more: buff.ly/3yNlXar #PoweredByTracking #EnvironmentalJustice
15
10 Jul 2025
#throughtheyears our #partnerships have helped us to mobilize data to inform action for healthier communities across the state. Check out a list of who we've worked with and are currently working with ⬇️: trackingcalifornia.org/about…
10 Jul 2024
Our mission is to mobilize data to inform action for healthier communities, and partnerships are a critical part of our efforts to achieve this. Learn more about the project partners we work with: trackingcalifornia.org/about… #taw2024 #beadataexplorer #adventuresinteamwork
15
9 Jul 2025
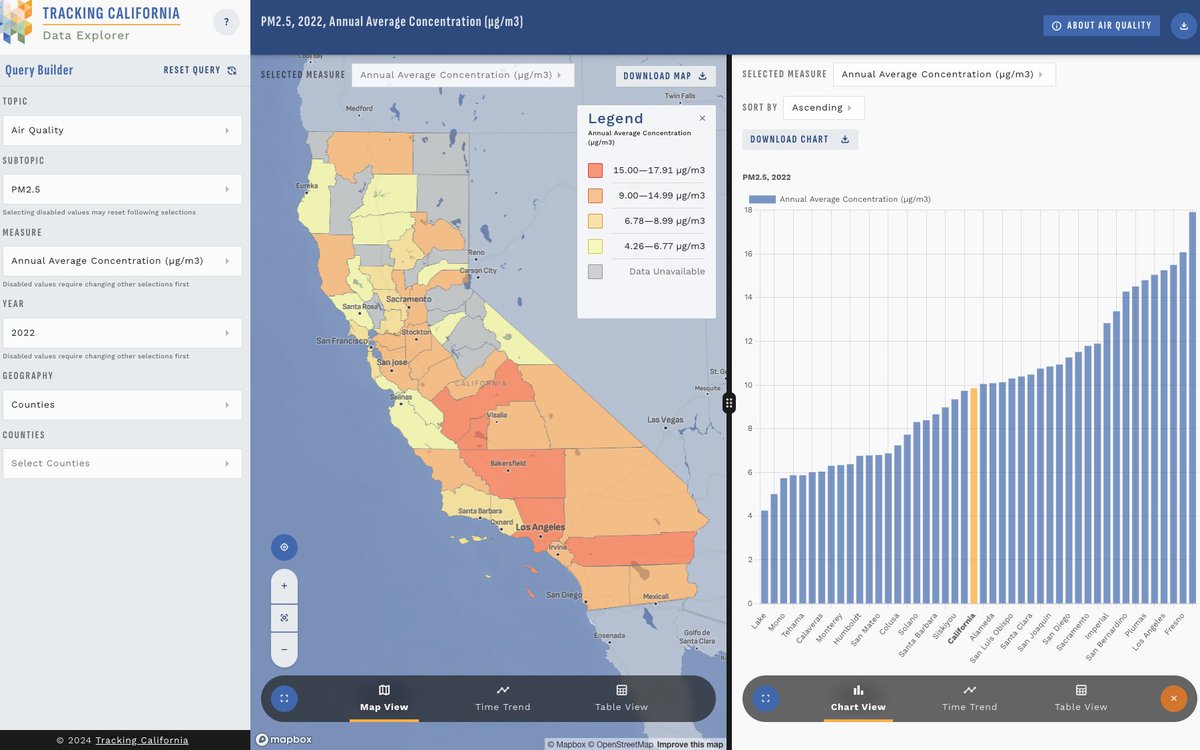
Between 2020-2021, we examined over 3M SARS-CoV-2 infections and about 50K COVID-19 deaths associated with long-term neighborhood levels of PM2.5. #throughtheyears #dataforaction Learn more about the COVID and Air Pollution Study ⬇️
8 Aug 2022
"We were able to characterize air pollution at a much smaller area - down at a neighborhood level." In a recent study we conducted, we found that those living in neighborhoods with the highest PM2.5 exposure were at increased risk of getting sick and dying from COVID-19.
27
9 Jul 2025
From 2018-2021, we provided technical assistance to community-based organizations to set up community #airmonitoring networks. #throughtheyears As part of this work, we also developed #roadtocleanair - a storymap which highlights where community partners work and live ⬇️
15 Jul 2021
The “road to clean air” highlights EJ leaders and their experiences with air pollution. Check out this map to visit the seven communities in California where our community partners work and live: buff.ly/3Ba4U46 #PoweredByTracking #EnvironmentalJustice

1
16
9 Jul 2025
In 2021, we designed and tested a filtration system for swamp coolers to reduce #wildfire #smoke exposure and health risks among #farmworkers - seven farmworkers leaders living in SJV also developed videos about their experiences ⬇️ #throughtheyears
11 Jul 2024
In our FRESSCA-mujeres project, members of Coalinga, Lost Hills, and Bakersfield developed stories of resilience highlighting issues of contamination in their community, advocating for clean air, and the importance of indoor air cleaners. #beadataexplorer youtube.com/playlist?list=PL…
17
8 Jul 2025
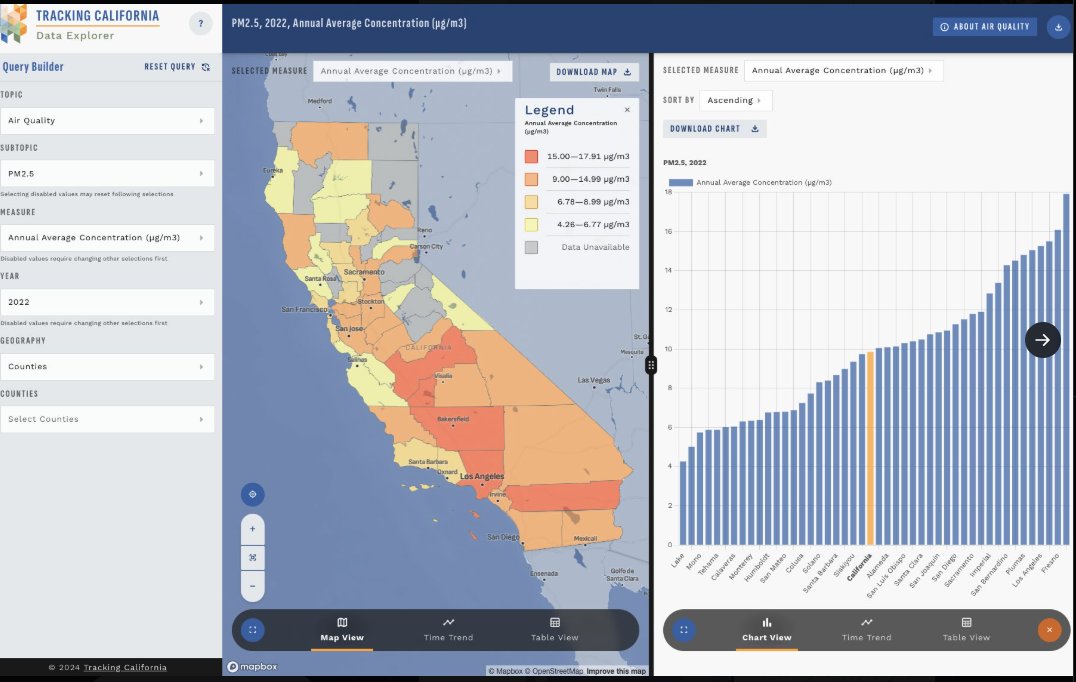
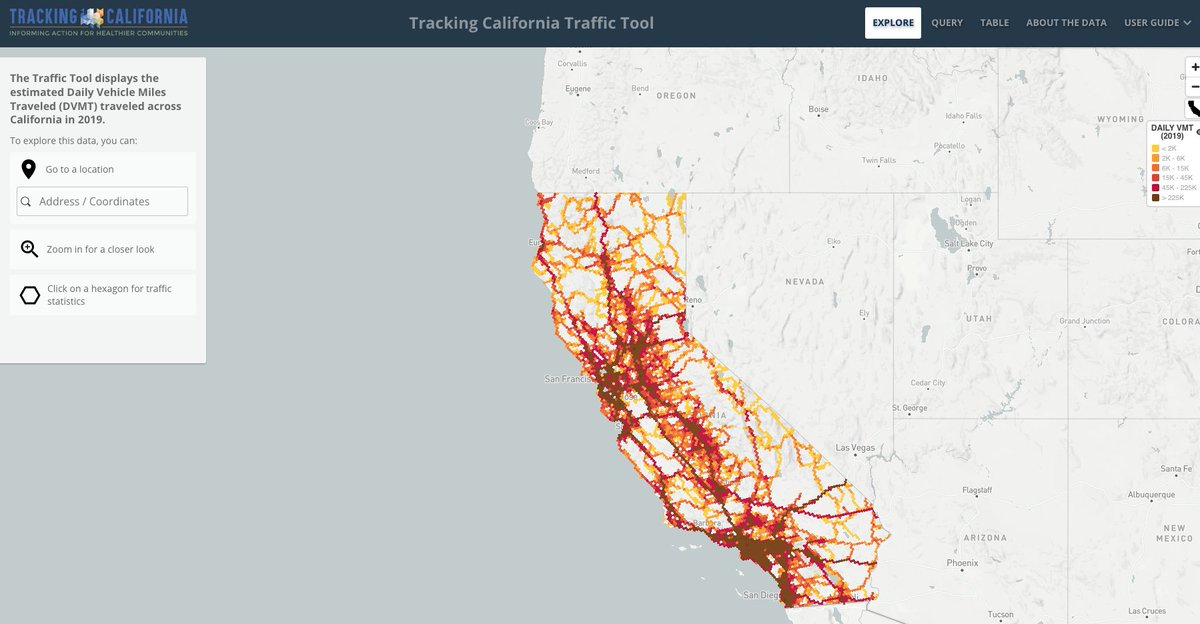
Last year, we launched a new data explorer and traffic tool - improving accessibility and usability of our datasets. The data explorer is also now available in Spanish data.trackingcalifornia.org/… #throughtheyears #taw2025 #dataforaction
9 Jul 2024
Our updated traffic tool expands access to and use of #data on traffic volumes throughout California for 2019 - Within the tool, search for a location and calculate #traffic volumes within 1000 meters. #beadataexplorer #taw2024 cdn.zevross.com/phi/traffic-…
9
8 Jul 2025
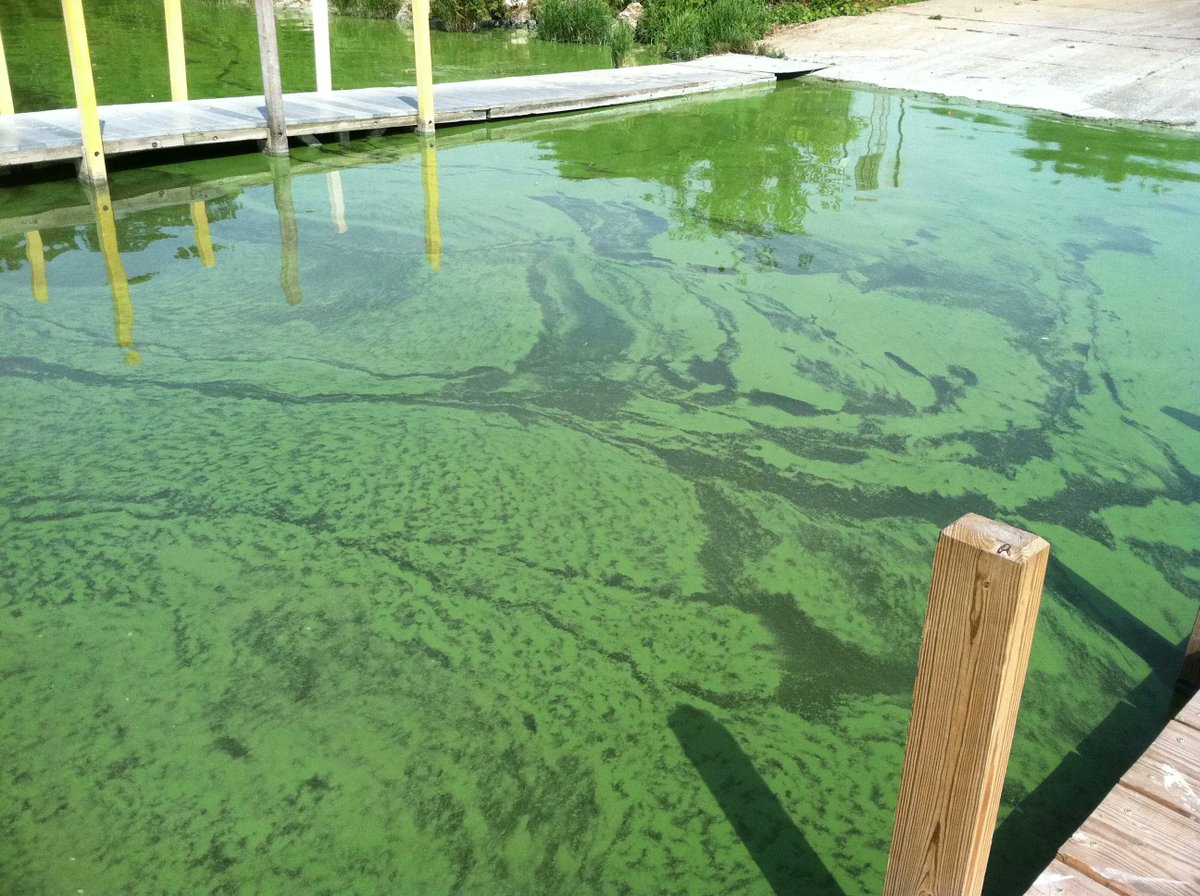
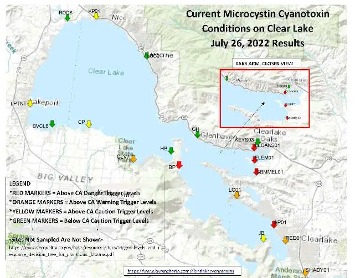
Since 2020, our Cal-WATCH project has been monitoring #habs in #freshwater bodies in Lake County. In 2023, we communicated to local health officers who issued an emergency alert and led two public water systems to provide drinking water to impacted residents. #throughtheyears
20 Jul 2023
We're using #DataforAction! Tracking California fills information gaps in environmental health issues. The Cal-WATCH project led to an emergency "Do Not Drink" alert issued by a local health department and two public drinking water systems, protecting the health of residents.
81
8 Jul 2025
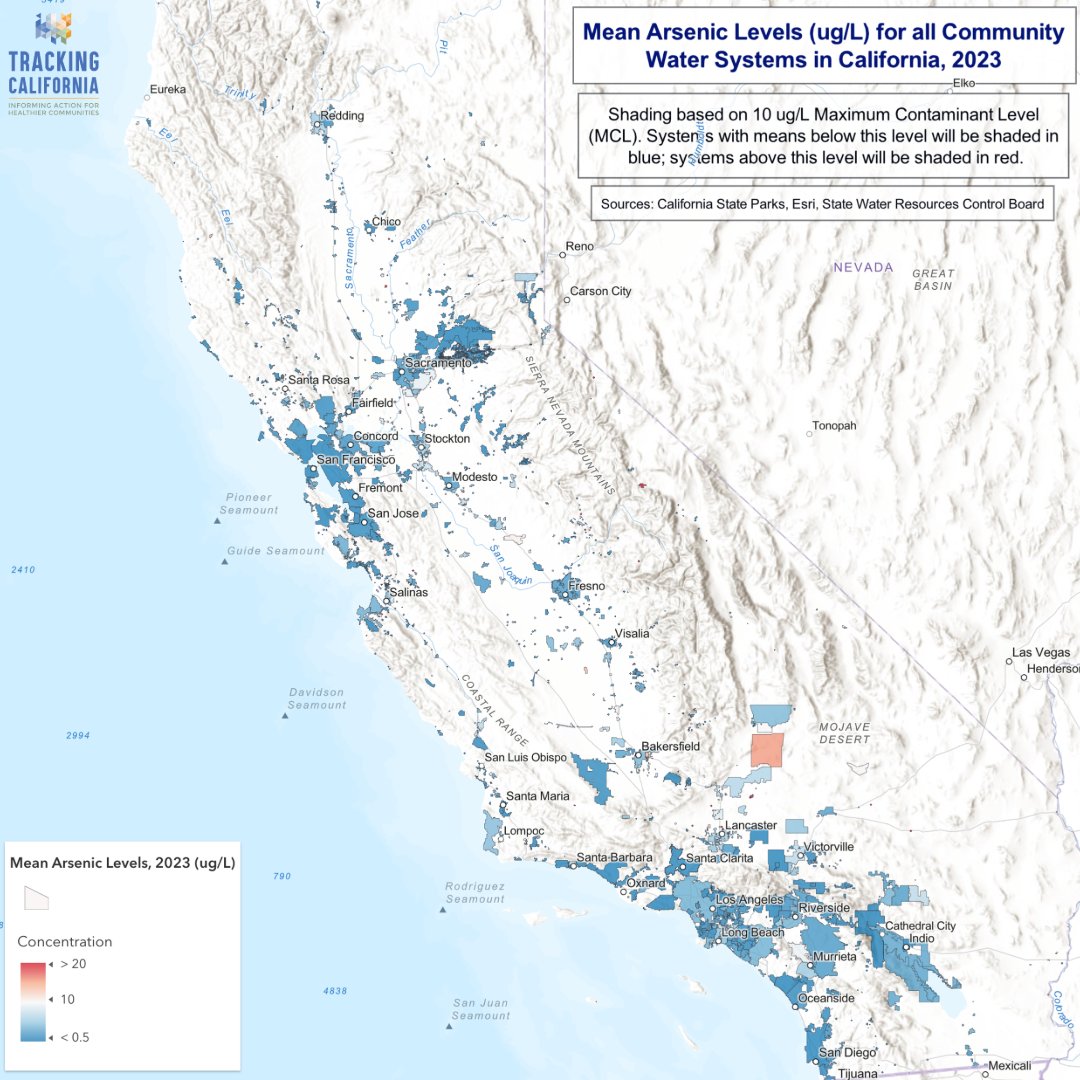
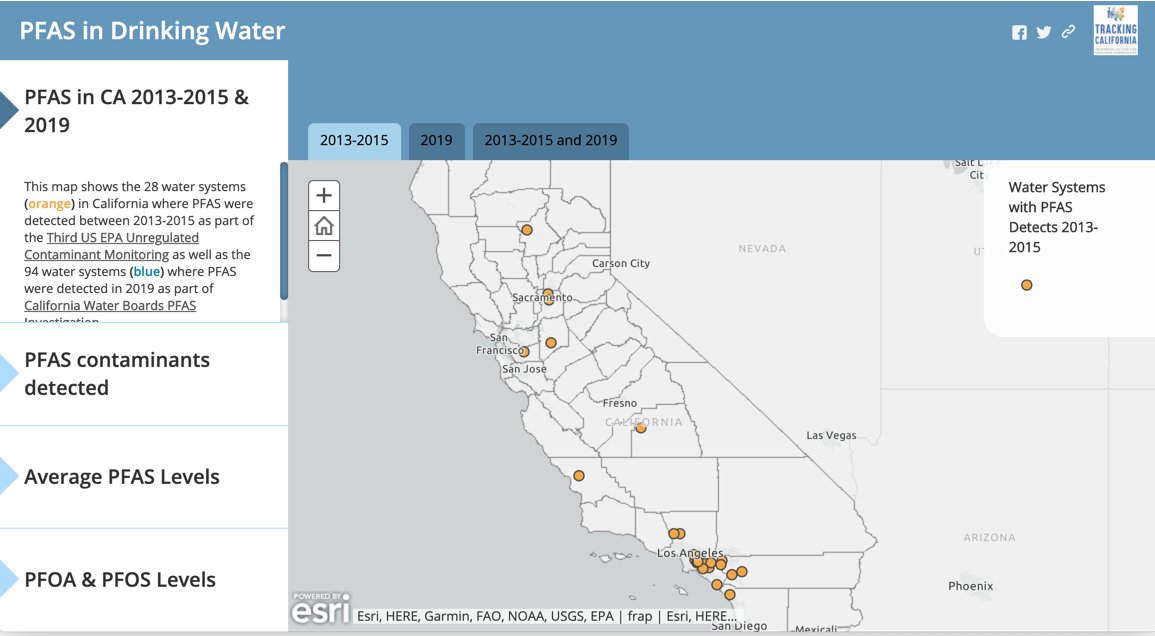
From 2019-2020, California Waterboards ordered water systems to test for #pfas under health and safety codes in CA's #safedrinkingwateract. We mapped results from testing near solid waste landfills, airports, fire training facilities, and other sites. #throughtheyears #taw2025
6 Jul 2020
Unique data include interative PFAS Maps that display the most current PFAS water quality testing data from the California Waterboards.
#PoweredByTracking #UniqueData #PFAS
trackingcalifornia.org/pfas/…
14
8 Jul 2025
In 2015, we calculated that preventable environmental health conditions in children cost CA $254M each year and over $10B throughout the child's life. #throughtheyears #taw2025 #dataforaction Learn more ➡️ trackingcalifornia.org/proje…
22 Oct 2019
A1e: In our 2015 report on the cost of childhood environmental health conditions we looked at the loss economic productivity due to lead exposure. We found that each year California children will lose $8-11 billion in earnings due to lead exposure.
trackingcalifornia.org/cost-…
7
8 Jul 2025
Our #pesticide in schools report published in 2014 helped protect children from pesticides, including spray buffers and notification systems for schools #throughtheyears #dataforaction trackingcalifornia.org/proje…
10 Jul 2019
In 2014, Tracking California published a report on ag pesticide use near public schools. While many schools did not have any pesticide use nearby, some did. Latino school kids in particular were more likely to attend schools with more nearby pesticide use.
#BeyondData #TAW2019

10
8 Jul 2025
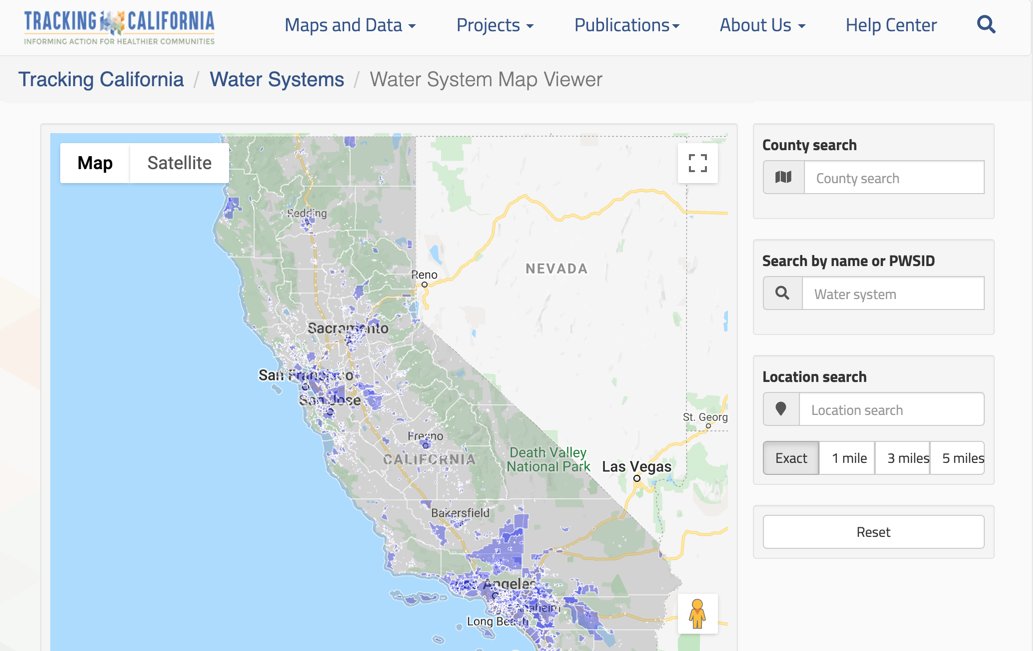
In 2010, our WBT was launched - data on 4800 public #drinkingwater systems were made available for use for emergency preparedness, including wildfire response and recovery. Although the tool retired in 2020, the data is still available tinyurl.com/3cv2zxyp #throughtheyears
6 Jul 2020
Unique data include our Water Boundary Tool, an interactive tool that allowed users to crowd-source community water system boundaries. The tool has provided mission critical data to a wide variety of stakeholders in CA.
#PoweredByTracking #UniqueData
trackingcalifornia.org/news/…
9
8 Jul 2025
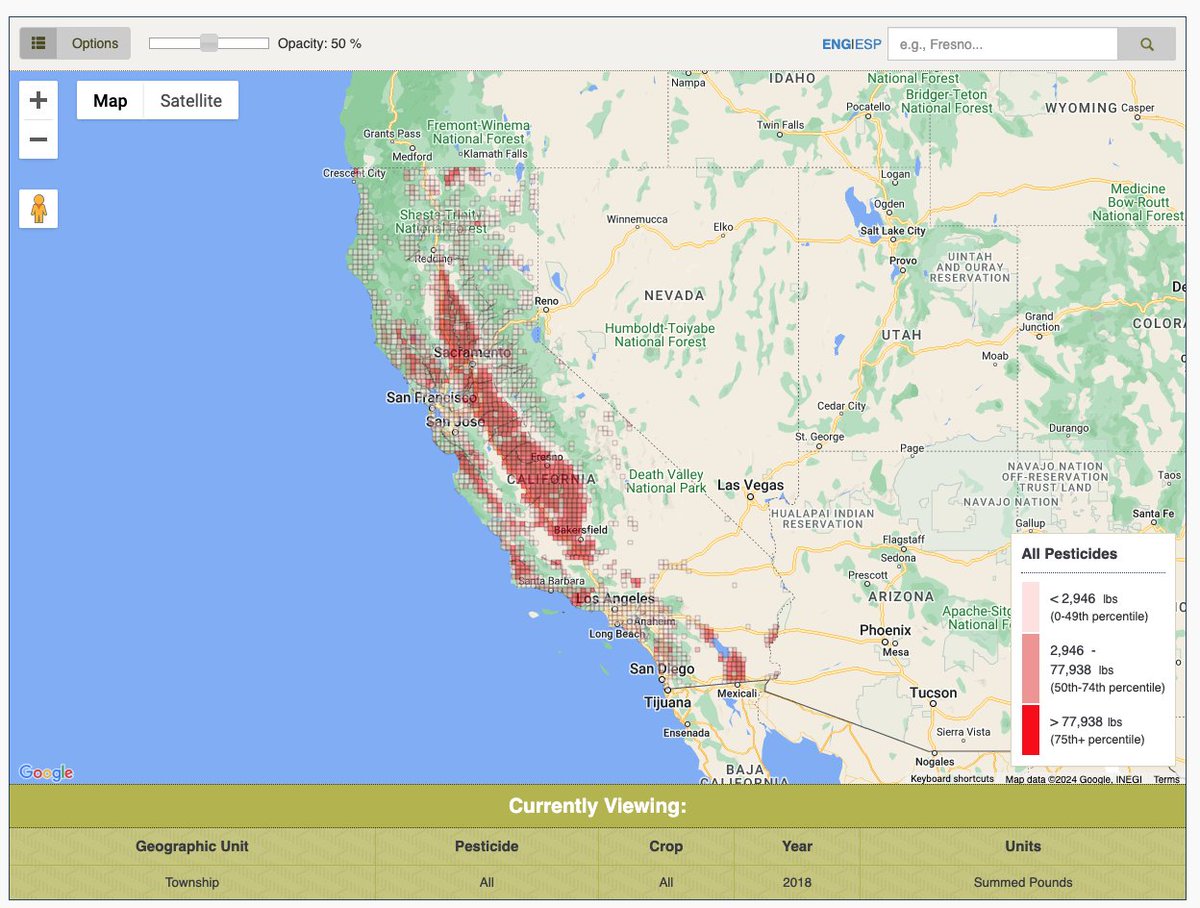
In 2009, we launched our #pesticide mapping tool - for the first time, pesticide data for all of California is made accessible and usable to the public. #throughtheyears
9 Jul 2024
Our #pesticidemappingtool allows users to easily access and visualize pesticide use data. Learn about the top 10 #pesticides in your area, how much was applied, and how they impact health. The tool is available in both English and Spanish. #beadataexplorer trackingcalifornia.org/data-…
9
8 Jul 2025
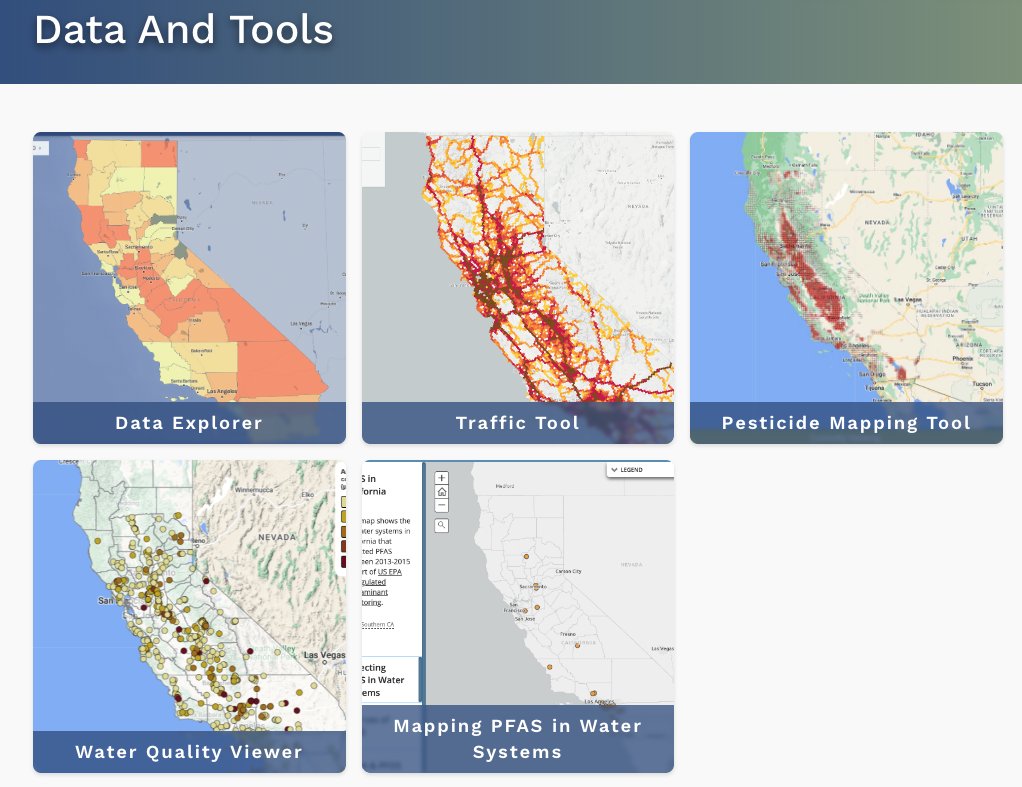
#throughtheyears our program has shared ways data can be used for action and tools that make data accessible in different formats on our site. Explore our data tools ➡️ trackingcalifornia.org/data-… #TAW2025 #toolsofthetrade #dataforaction
15
7 Jul 2025
We continue partnering with Big Valley Band of Pomo Indians to monitor for #harmfulalgalblooms #habs in Lake County through our Cal-WATCH project. Learn more about current conditions ⬇️: bvrancheria.com/clearlakecya… #throughtheyears #wetrackthat
4 Aug 2022
"Nearly 70 lakes, rivers and reservoirs have issued “caution,” “warning” and “danger” advisories this year alone, but Clear Lake in particular has been an area where the toxic blooms’ impacts are far-reaching". bit.ly/3d9gghh
69