
TradingView indicators & more👇
Joined March 2021
- Tweets 15,939
- Following 316
- Followers 40,007
- Likes 39,638
4,910 Photos and videos


NQ, ES, & YM: breakout days & targets
This report takes the initial balance, draws extensions from its range, and shows how often price hits those extension levels
Ex. the " 1.0" extension for a given day would be evaluated as:
ib_high [(ib_high - ib_low) * 1.0]
Negative numbered extensions are similar but drawn from the range low, ex. "-0.5" would be:
ib_low - [(ib_high - ib_low) * 0.5]
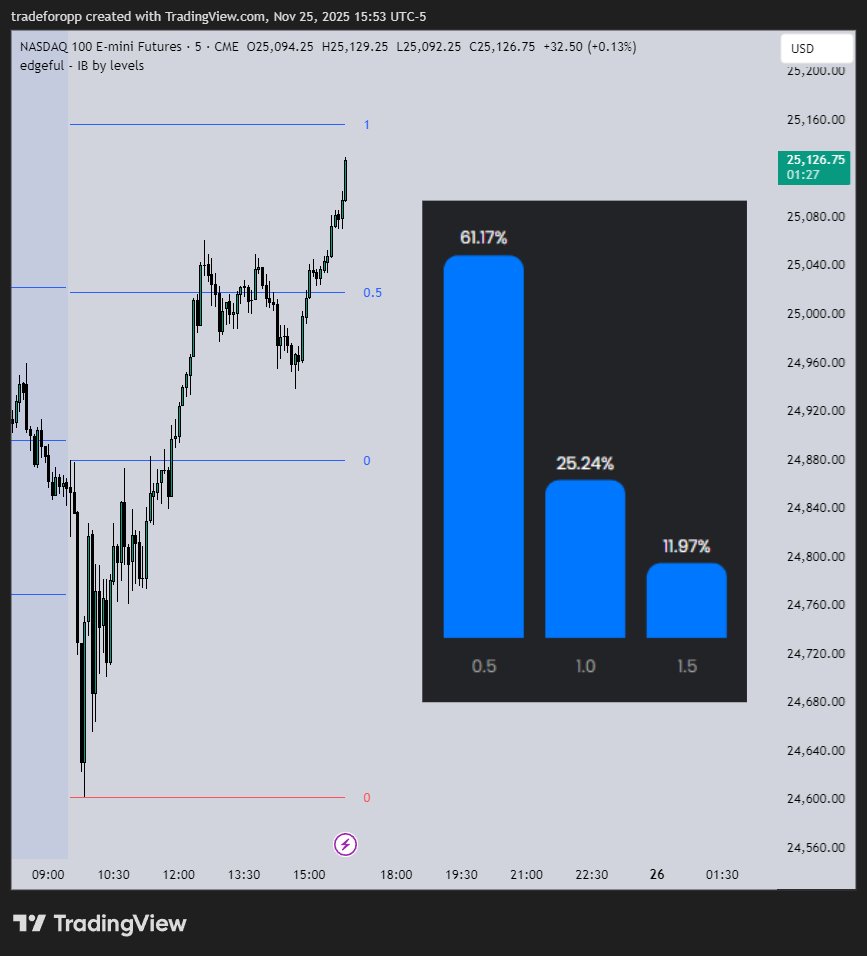
With today being considered a breakout day on NQ, ES, and YM (confirmed with price only trading above the IB high, never below the IB low), here are the probabilities of a few extensions from these IB ranges
NQ (3 year lookback):
0.2: 87.54%🔵🔵🔵🔵🔵
0.4: 70.29%🔵🔵🔵🔵
0.6: 52.08%🔵🔵🔵
0.8: 36.1%🔵🔵
1.0: 25.24%🔵
ES (3 year lookback):
0.2: 92.2%🔵🔵🔵🔵🔵
0.4: 77.66%🔵🔵🔵🔵
0.6: 60.64%🔵🔵🔵
0.8: 52.42%🔵🔵
1.0: 39.36%🔵
YM (3 year lookback):
0.2: 86.25%🔵🔵🔵🔵🔵
0.4: 69.07%🔵🔵🔵🔵
0.6: 51.2%🔵🔵🔵
0.8: 40.21%🔵🔵
1.0: 29.21%🔵
Another couple notes regarding these breakout days:
1. They are validated with a wick criteria; all price has to do is wick through the IB high to be considered a breakout day, OR wick through the IB low for a breakdown day
2. If price ever wicks through both the IB high *and* the IB low - at any point throughout RTH session (the time window I'm using for this report) - that reclassifies the breakout/breakdown day as a double break day. Double break days have completely different data attached to these levels
The attached chart is an example of how these extension targets get hit across *all* days on NQ - breakout, breakdown, and double break
4
4
30
5,607
Any questions about reports/timeframes etc. feel free to lmk - DMs are open, replies are on "verified only" bc of bots
Try Edgeful for free: edgeful.com/?via=tfo
2
3
13
3,496
NQ: retracement probabilities of varying opening prices
I want to look at the probability of NQ hitting the following open prices (EST) during the RTH session:
> 4:00
> 6:00
> 8:00
Before looking at each retracement by size (distance from the open price to RTH open), these are the results for the entire 3 year lookback:
[4:00 - RTH opened above this price]
68% retracement probability
[4:00 - RTH opened below this price]
75% retracement probability
---
[6:00 - RTH opened above this price]
72% retracement probability
[6:00 - RTH opened below this price]
76% retracement probability
---
[8:00 - RTH opened above this price]
77% retracement probability
[8:00 - RTH opened below this price]
82% retracement probability
---
Now, broken down by size (distance from the open price to the RTH open):
[4:00 - RTH opened above this price]
< 0.1%: 86% (75/87 days)🔵🔵🔵🔵🔵
0.1-0.19%: 87% (53/61 days)🔵🔵🔵🔵🔵🔵
0.2-0.39%: 67% (82/123 days)🔵🔵🔵🔵
0.4-0.59%: 52% (33/63 days)🔵🔵🔵
0.6-0.99%: 42% (18/43 days)🔵🔵
1-1.49%: 33% (3/9 days)🔵
[4:00 - RTH opened below this price]
< 0.1%: 91% (92/101 days)🔵🔵🔵🔵🔵🔵
0.1-0.19%: 79% (64/81 days)🔵🔵🔵🔵🔵
0.2-0.39%: 75% (72/96 days)🔵🔵🔵🔵
0.4-0.59%: 57% (25/44 days)🔵🔵
0.6-0.99%: 59% (24/41 days)🔵🔵🔵
1-1.49%: 57% (8/14 days)🔵🔵
---
[6:00 - RTH opened above this price]
< 0.1%: 93% (101/109 days)🔵🔵🔵🔵🔵🔵
0.1-0.19%: 73% (69/94 days)🔵🔵🔵🔵🔵
0.2-0.39%: 70% (85/122 days)🔵🔵🔵🔵
0.4-0.59%: 57% (26/46 days)🔵🔵🔵
0.6-0.99%: 34% (10/29 days)🔵🔵
1-1.49%: 0% (0/5 days)🔵
[6:00 - RTH opened below this price]
< 0.1%: 93% (94/101 days)🔵🔵🔵🔵🔵
0.1-0.19%: 81% (64/79 days)🔵🔵🔵🔵
0.2-0.39%: 67% (71/106 days)🔵🔵🔵
0.4-0.59%: 61% (22/36 days)🔵🔵
0.6-0.99%: 67% (20/30 days)🔵🔵🔵
1-1.49%: 60% (6/10 days)🔵
---
[8:00 - RTH opened above this price]
< 0.1%: 95% (130/137 days)🔵🔵🔵🔵🔵🔵
0.1-0.19%: 74% (68/92 days)🔵🔵🔵🔵🔵
0.2-0.39%: 73% (67/92 days)🔵🔵🔵🔵
0.4-0.59%: 59% (22/37 days)🔵🔵🔵
0.6-0.99%: 32% (6/19 days)🔵🔵
1-1.49%: 14% (0/6 days)🔵
[8:00 - RTH opened below this price]
< 0.1%: 91% (145/159 days)🔵🔵🔵🔵🔵🔵
0.1-0.19%: 81% (74/91 days)🔵🔵🔵🔵🔵
0.2-0.39%: 76% (63/83 days)🔵🔵🔵🔵
0.4-0.59%: 69% (20/29 days)🔵🔵
0.6-0.99%: 60% (12/20 days)🔵
1-1.49%: 71% (5/7 days)🔵🔵🔵
2
4
31
3,984
This post expands on one I shared a few days ago on midnight open retracements: x.com/TradeForOpp/status/200…
Any questions about reports/timeframes etc. feel free to lmk - DMs are open, replies are on "verified only" bc of bots
Try Edgeful for free: edgeful.com/?via=tfo

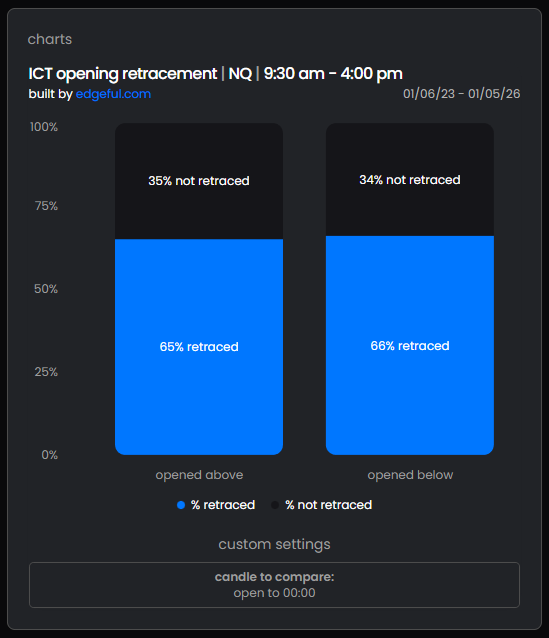
NQ: midnight opening retracements
The ICT opening retracement report defaults to using the midnight open as the retracement target (but can be changed to any other time)
Overall, in the last 3 years, if RTH opened above the midnight open, the retracement success rate during the RTH session was 65%, and 66% if RTH opened below the midnight open
By weekday, the numbers don't vary too much, but I'll attach for completeness:
[RTH opened above midnight open]
Mon: 53% (46/87 days)🔵
Tue: 68% (51/75 days)🔵🔵🔵
Wed: 69% (57/83 days)🔵🔵🔵🔵🔵
Thu: 69% (60/87 days)🔵🔵🔵🔵🔵
Fri: 67% (53/79 days)🔵🔵
[RTH opened below midnight open]
Mon: 71% (48/68 days)🔵🔵🔵🔵🔵
Tue: 65% (53/81 days)🔵🔵
Wed: 68% (48/71 days)🔵🔵🔵
Thu: 59% (39/66 days)🔵
Fri: 69% (51/74 days)🔵🔵🔵🔵
Now, broken down by distance/size for all days of the week (how far RTH opened from the midnight open), the results are as follows:
[RTH opened above midnight open]
< 0.1%: 86% (64/74 days)
0.1-0.19%: 83% (55/66 days)
0.2-0.39%: 66% (76/116 days)
0.4-0.59%: 59% (41/70 days)
0.6-0.99%: 42% (28/66 days)
1-1.49%: 14% (2/14 days)
>= 1.5%: 20% (1/5 days)
[RTH opened below midnight open]
< 0.1%: 91% (64/70 days)
0.1-0.19%: 75% (47/63 days)
0.2-0.39%: 67% (66/98 days)
0.4-0.59%: 51% (26/51 days)
0.6-0.99%: 50% (25/50 days)
1-1.49%: 44% (8/10 days)
>= 1.5%: 30% (3/10 days)
As with most other reports, breaking down the success criteria by something like distance/size makes it a bit more intuitive in my opinion
Practically speaking, if the RTH session opens far away from some target distance (midnight open), the chances of hitting that level are probably low, compared to days where that target is much closer by RTH open
Likewise, if the target is further back in time compared to another - say you were comparing the midnight retracements vs 8:00 am EST retracements during RTH - chances are, since more time has elapsed from 12:00-9:30 compared to 8:00-9:30, allowing price more time to move until the RTH open, *on average* RTH would likely start further away from the 12:00 level and closer to the 8:00 level, and as a result offer lower retracement rates for the 12:00 open vs the 8:00 open
These are just generalized examples, but imo breaking down reports in this way helps demystify the concept; it's a lot more comprehensive as opposed to just saying there's a 70% chance of X happening... okay, but how/when/why?
1
6
3,308
NQ: midnight opening retracements
The ICT opening retracement report defaults to using the midnight open as the retracement target (but can be changed to any other time)
Overall, in the last 3 years, if RTH opened above the midnight open, the retracement success rate during the RTH session was 65%, and 66% if RTH opened below the midnight open
By weekday, the numbers don't vary too much, but I'll attach for completeness:
[RTH opened above midnight open]
Mon: 53% (46/87 days)🔵
Tue: 68% (51/75 days)🔵🔵🔵
Wed: 69% (57/83 days)🔵🔵🔵🔵🔵
Thu: 69% (60/87 days)🔵🔵🔵🔵🔵
Fri: 67% (53/79 days)🔵🔵
[RTH opened below midnight open]
Mon: 71% (48/68 days)🔵🔵🔵🔵🔵
Tue: 65% (53/81 days)🔵🔵
Wed: 68% (48/71 days)🔵🔵🔵
Thu: 59% (39/66 days)🔵
Fri: 69% (51/74 days)🔵🔵🔵🔵
Now, broken down by distance/size for all days of the week (how far RTH opened from the midnight open), the results are as follows:
[RTH opened above midnight open]
< 0.1%: 86% (64/74 days)
0.1-0.19%: 83% (55/66 days)
0.2-0.39%: 66% (76/116 days)
0.4-0.59%: 59% (41/70 days)
0.6-0.99%: 42% (28/66 days)
1-1.49%: 14% (2/14 days)
>= 1.5%: 20% (1/5 days)
[RTH opened below midnight open]
< 0.1%: 91% (64/70 days)
0.1-0.19%: 75% (47/63 days)
0.2-0.39%: 67% (66/98 days)
0.4-0.59%: 51% (26/51 days)
0.6-0.99%: 50% (25/50 days)
1-1.49%: 44% (8/10 days)
>= 1.5%: 30% (3/10 days)
As with most other reports, breaking down the success criteria by something like distance/size makes it a bit more intuitive in my opinion
Practically speaking, if the RTH session opens far away from some target distance (midnight open), the chances of hitting that level are probably low, compared to days where that target is much closer by RTH open
Likewise, if the target is further back in time compared to another - say you were comparing the midnight retracements vs 8:00 am EST retracements during RTH - chances are, since more time has elapsed from 12:00-9:30 compared to 8:00-9:30, allowing price more time to move until the RTH open, *on average* RTH would likely start further away from the 12:00 level and closer to the 8:00 level, and as a result offer lower retracement rates for the 12:00 open vs the 8:00 open
These are just generalized examples, but imo breaking down reports in this way helps demystify the concept; it's a lot more comprehensive as opposed to just saying there's a 70% chance of X happening... okay, but how/when/why?
2
3
33
6,271
Any questions about reports/timeframes etc. feel free to lmk - DMs are open, replies are on "verified only" bc of bots
Try Edgeful for free: edgeful.com/?via=tfo
4
1,651
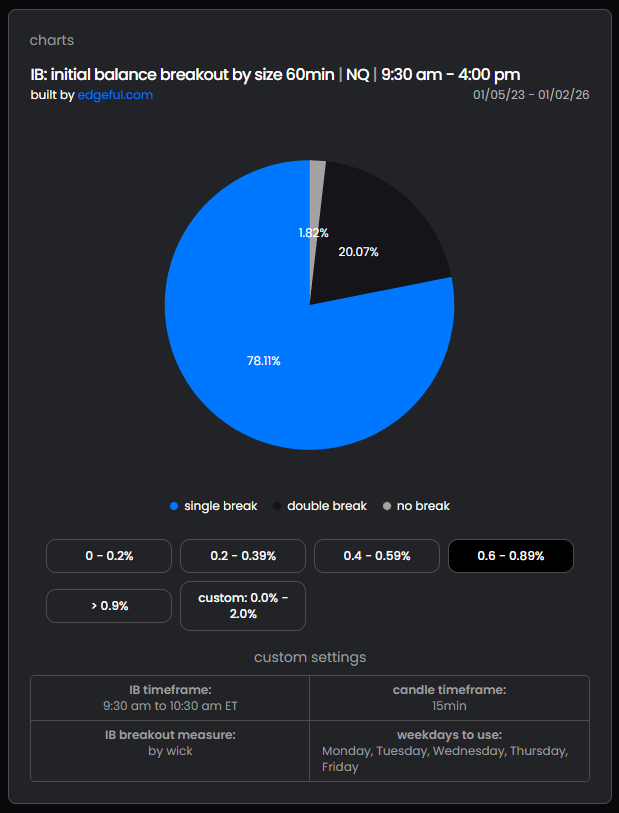
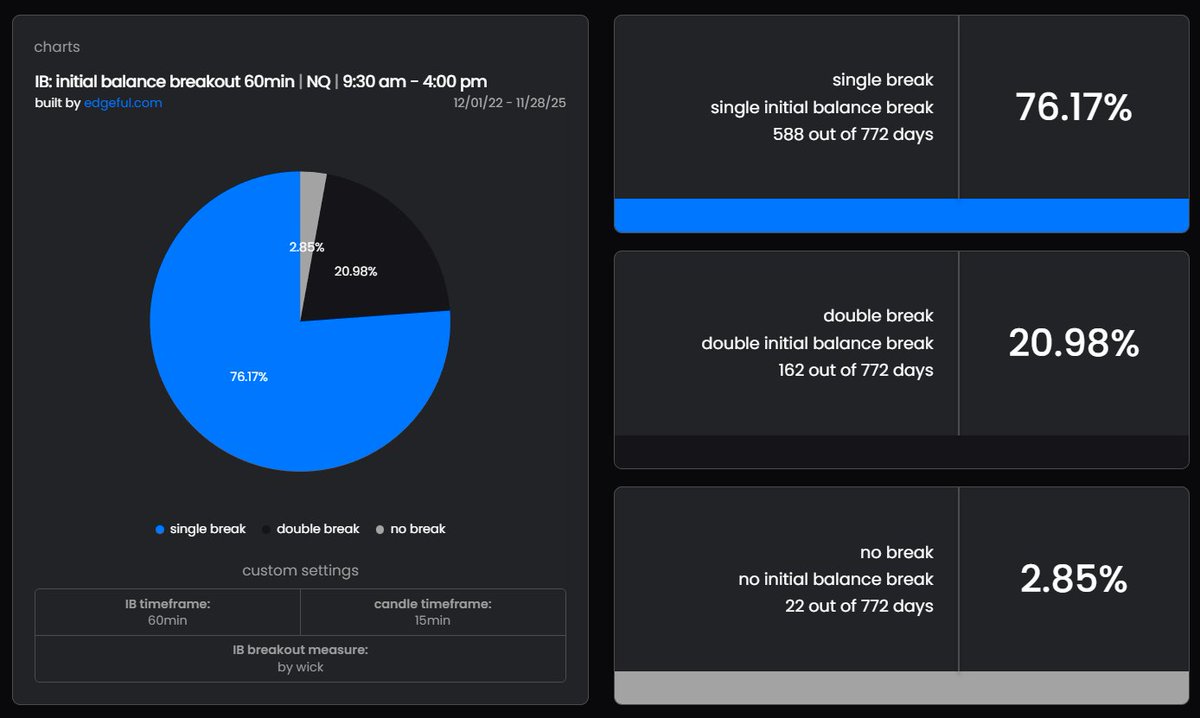
NQ: probability of a double break
I'm customizing the initial balance breakout report to see how often NQ breaks one, both, or neither side of the first 30m, 1h, 1.5h etc. of RTH
"Break" criteria is defined with a wick (not a close), and I'm using a lookback period of 3 years (772 trading days)
First 30m (9:30-10:00):
- single break: 61.92%🔵
- double break: 37.69%⚫⚫⚫⚫⚫⚫
- no break: 0.39%⚪
First 1h (9:30-10:30):
- single break: 75.78%🔵🔵🔵🔵
- double break: 21.24%⚫⚫⚫⚫⚫
- no break: 2.98%⚪⚪
First 1.5h (9:30-11:00):
- single break: 77.33%🔵🔵🔵🔵🔵🔵
- double break: 14.64%⚫⚫⚫⚫
- no break: 8.03%⚪⚪⚪
First 2h (9:30-11:30):
- single break: 77.2%🔵🔵🔵🔵🔵
- double break: 9.84%⚫⚫⚫
- no break: 12.95%⚪⚪⚪⚪
First 2.5h (9:30-12:00):
- single break: 74.35%🔵🔵🔵
- double break: 6.61%⚫⚫
- no break: 19.04%⚪⚪⚪⚪⚪
First 3h (9:30-12:30):
- single break: 70.73%🔵🔵
- double break: 5.05%⚫
- no break: 24.22%⚪⚪⚪⚪⚪
Though as you could imagine, the size of these ranges can surely be a key factor in how often they breaks
Using the first 1h range as an example, these are the probabilities when filtered by range size:
0-0.2% (14 days fit this criteria):
- single break: 92.86% 🔵🔵🔵🔵🔵
- double break: 0% ⚫
- no break: 7.14%
0.2-0.39% (78 days fit this criteria):
- single break 65.39%🔵
- double break: 33.33% ⚫⚫⚫⚫⚫
- no break: 1.28% ⚪⚪
0.4-0.59% (186 days fit this criteria):
- single break: 69.89% 🔵🔵
- double break: 30.11% ⚫⚫⚫⚫
- no break: 0% ⚪
0.6-0.89% (274 days fit this criteria):
- single break 78.11%🔵🔵🔵
- double break 20.07% ⚫⚫⚫
- no break: 1.82% ⚪⚪⚪
>0.9% (220 days fit this criteria):
- single break: 80.46% 🔵🔵🔵🔵
- double break: 12.27% ⚫⚫
- no break: 7.27% ⚪⚪⚪⚪
1
2
26
3,032
Any questions about reports/timeframes etc. feel free to lmk - DMs are open, replies are on "verified only" bc of bots
Try Edgeful for free: edgeful.com/?via=tfo
1
1,498
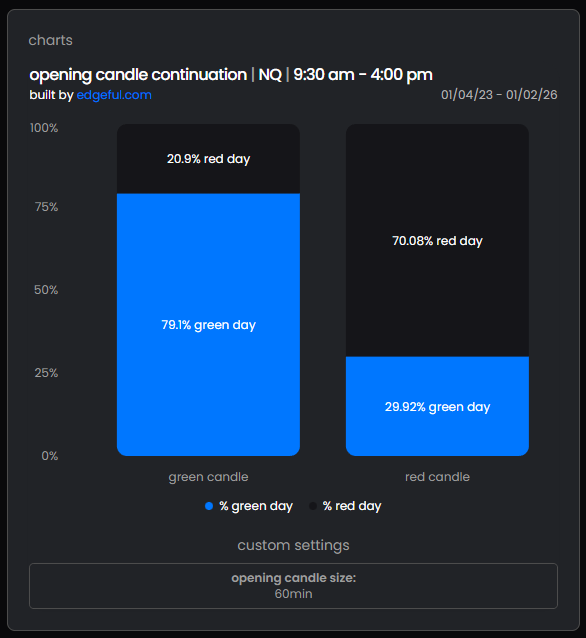
NQ: letting the first hour set the tone
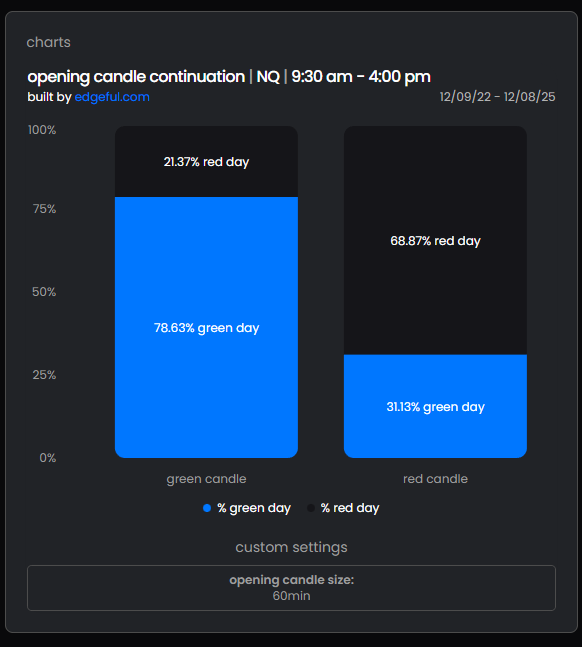
The opening candle continuation report correlates the close of the first hour with the close of the daily candle (both RTH)
I prefer to break this down by size (how far 10:30 price is from 9:30 price) because, as you could imagine, the day is probably more likely to end in the same direction when the 1st hour closes further from the open
The following data shows the probability that the day closes in the same direction as the 1st hour, filtered by the size of the opening candle (measured from open to close), using a 3 year lookback
Green 🟢1st hour:
0-0.2%: 68% 🟢 day odds (98/144 times)
0.2-0.39%: 84% 🟢 day odds (73/87 times)
0.4-0.59%: 84% 🟢 day odds (73/87 times)
0.6-0.89%: 83% 🟢 day odds (49/59 times)
>0.9: 100% 🟢 day odds (25/25 times)
Red 🔴1st hour:
0-0.2%: 53% 🔴 day odds (68/127 times)
0.2-0.39%: 65% 🔴 day odds (61/94 times)
0.4-0.59%: 83% 🔴 day odds (52/63 times)
0.6-0.89%: 91% 🔴 day odds (53/58 times)
>0.9: 90% 🔴 day odds (26/29 times)
As another example, take ES, again with a 3 year lookback:
Green 🟢1st hour:
0-0.2%: 71% 🟢 day odds (154/218 times)
0.2-0.39%: 76% 🟢 day odds (86/113 times)
0.4-0.59%: 73% 🟢 day odds (40/55 times)
0.6-0.89%: 84% 🟢 day odds (16/19 times)
>0.9: 100% 🟢 day odds (7/7 times)
Red 🔴1st hour:
0-0.2%: 55% 🔴 day odds (101/182 times)
0.2-0.39%: 75% 🔴 day odds (82/110 times)
0.4-0.59%: 82% 🔴 day odds (31/38 times)
0.6-0.89%: 86% 🔴 day odds (19/22 times)
>0.9: 78% 🔴 day odds (7/9 times)
You'll see ES typically doesn't move as much %-wise compared to NQ, so the sample sizes on some of ES's larger opening candle ranges are much smaller (and therefore less significant) compared to NQ
2
33
3,475
Any questions about reports/timeframes etc. feel free to lmk - DMs are open, replies are on "verified only" bc of bots
Try Edgeful for free: edgeful.com/?via=tfo
1
1,435

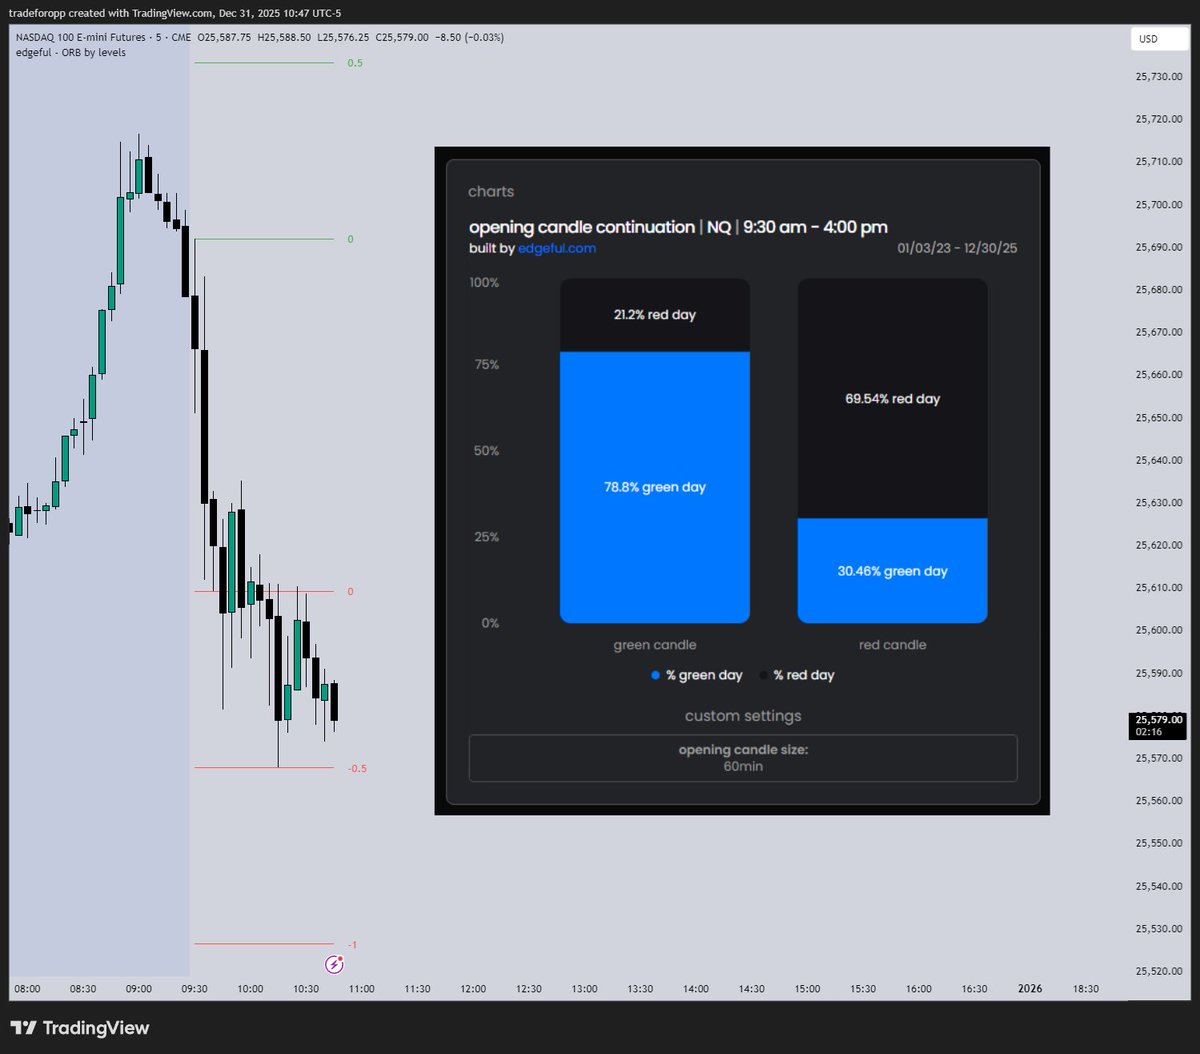
31 Dec 2025
By 10:30 on NQ:
The 1st hour closed below its open:
~70% chance of a red day (RTH)
The 1st hour's low formed after the high:
~69% chance the low gets taken first
The previous day's RTH low was traded through:
~62% chance of a red day (RTH)
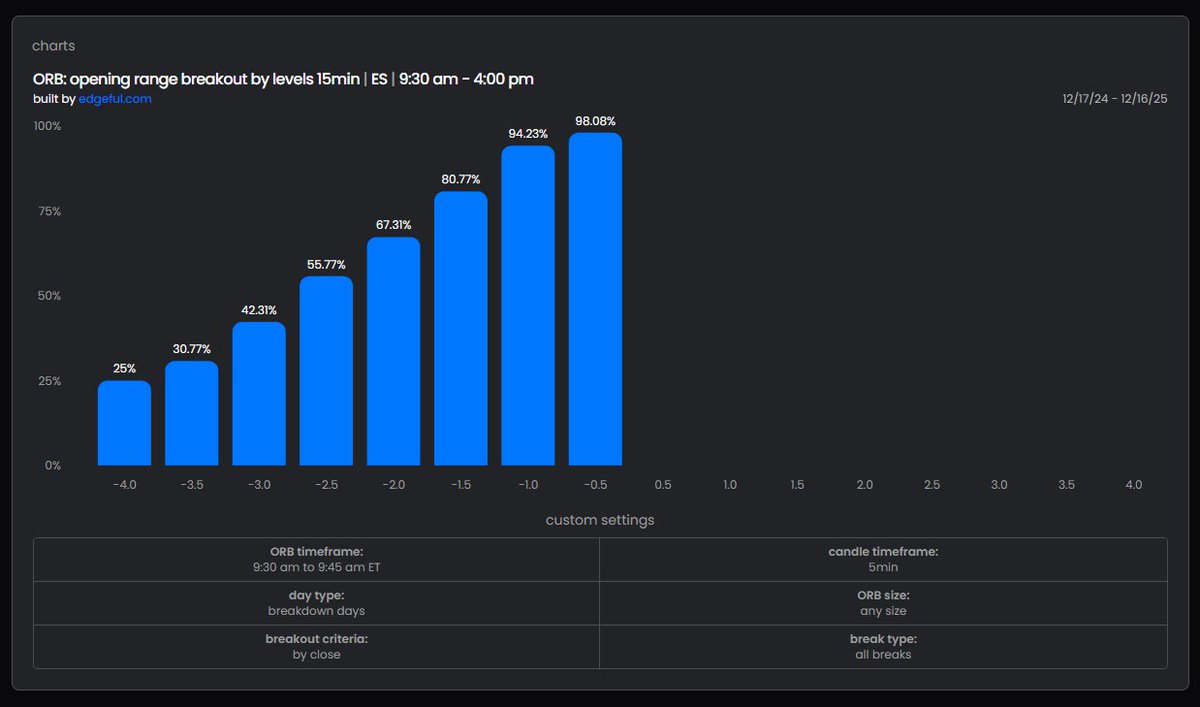
There was a breakdown from the 15m ORB (via a 5m close thru the low as confirmation). If the 5m does not close thru the OR high, the likelihood of a few OR extensions being reached are as follows:
> -0.5: ~94% hit rate
> -1.0: ~81% hit rate
> -1.5: ~62% hit rate
> -2.0: ~48% hit rate
Note, if the 5m *does* close above the 15m OR at any point today, then the previous stats are irrelevant; we would instead have to look at stats for double break days, which are shown here:
> 2.0: ~15% hit rate
> 1.5: ~26% hit rate
> 1.0: ~42% hit rate
> 0.5: ~69% hit rate
> -0.5: ~65% hit rate
> -1.0: ~41% hit rate
> -1.5: ~31% hit rate
> -2.0: ~20% hit rate
*All reports were generated using a 3 year lookback period on NQ
3
4
53
6,573
31 Dec 2025
Any questions about reports/timeframes etc. feel free to lmk - DMs are open, replies are on "verified only" bc of bots
Try Edgeful for free: edgeful.com/?via=tfo
1,472
24 Dec 2025
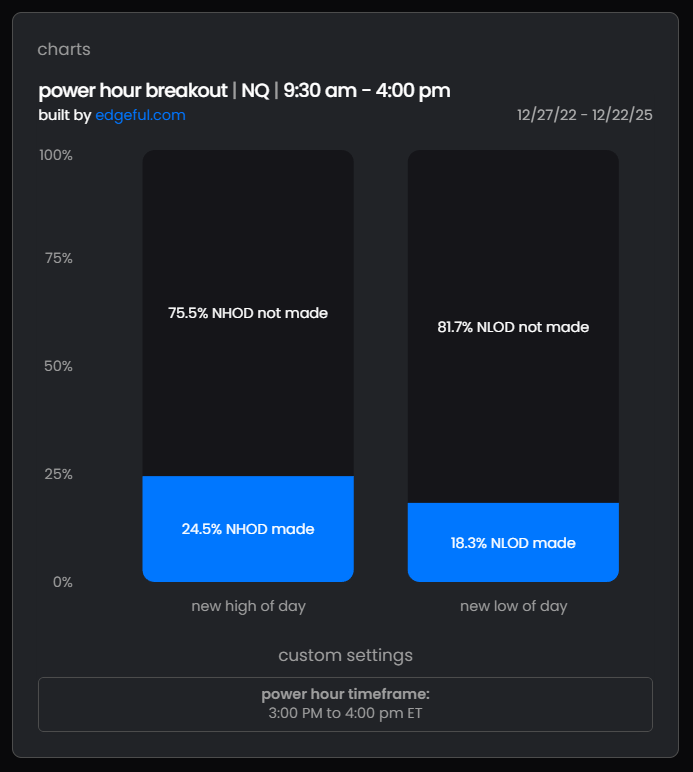
NQ: 82% of the time, power hour (3-4pm) does *not* create a new low of the day*
And 75% of the time, it does not create a new high of the day*
(*3 year lookback)
This report is extremely straight forward:
> take the range high and low from 9:30am-3:00pm EST
> track if power hour (3-4pm) breaks either side
Looking at the last month as an example, this shows whether a new high of day or new low of day was made from 3-4pm:
12/22: NHOD ❌, NLOD ❌
12/19: NHOD ❌, NLOD ❌
12/18: NHOD ❌, NLOD ❌
12/17: NHOD ❌, NLOD ✅
12/16: NHOD ✅, NLOD ❌
12/15: NHOD ❌, NLOD ❌
12/12: NHOD ❌, NLOD ❌
12/11: NHOD ❌, NLOD ❌
12/10: NHOD ✅, NLOD ❌
12/9: NHOD ❌, NLOD ❌
12/8: NHOD ❌, NLOD ❌
12/5: NHOD ❌, NLOD ❌
12/4: NHOD ❌, NLOD ❌
12/3: NHOD ✅, NLOD ❌
12/2: NHOD ❌, NLOD ❌
12/1: NHOD ❌, NLOD ❌
11/26: NHOD ❌, NLOD ❌
11/25: NHOD ✅, NLOD ❌
11/24: NHOD ✅, NLOD ❌
Data like this can be useful when setting expectations/framing trade ideas, ex. if you were looking for longs at or after 3pm, would it be wise to target a NHOD?
This data alone might caution against that - however a NHOD still occurs 1 out of every ~4 times, and a NLOD 1 our of every ~5 times, so it could be beneficial to understand data points that might suggest when these outcomes are more favorable
Another way to look at this data is by observing where power hour opened relative to the 9:30am-3:00pm range
If NQ opened *above* the midpoint of this range, 98.6% of the time a NLOD was not made, and 60% of the time a NHOD was not made
And if NQ opened *below* the midpoint of the range, 97.4% of days did not make a NHOD, and 58% did not make a NLOD
4
3
36
5,339
24 Dec 2025
Any questions about reports/timeframes etc. feel free to lmk - DMs are open, replies are on "verified only" bc of bots
Try Edgeful for free: edgeful.com/?via=tfo
4
1,714
17 Dec 2025
Applying the same statistics to NQ, ES, and YM today:
Noting ✅ if it succeeded, ❌ if it failed
-----
NQ:
1st hour closed below its open:
> 72% red day ✅
1st hour high formed before the low:
> 68% the low breaks first✅
Extension level hit rates for a breakdown day, measured from the 15m opening range:
> 95% for the -0.5✅
> 86% for the -1.0✅
> 68% for the -1.5✅
-----
ES:
1st hour closed below its open:
> 70% red day ✅
1st hour high formed before the low:
> 67% the low breaks first✅
Extension level hit rates for a breakdown day, measured from the 15m opening range:
> 98% for the -0.5✅
> 94% for the -1.0✅
> 81% for the -1.5✅
-----
YM:
1st hour closed above its open:
> 72% green day ❌
1st hour high formed after the low:
> 71% the high breaks first ❌
Extension level hit rates for a breakout day, measured from the 15m opening range:
> 91% for the 0.5❌
> 78% for the 1.0❌
> 58% for the 1.5❌
YM eventually broke down through the 15m opening range low after first breaking above its high; data for the opposing extensions on a double break day is as follows:
> 66% for the -0.5✅
> 40% for the -1.0✅
> 28% for the -1.5✅
-----
*All data using a 1 year lookback and specifically considering the RTH session for "first hour", "green/red day" etc.
*The opening range hit rates for breakout/breakdown days assume price ONLY closes through one side of the 15m opening range throughout the day (on a 5m timeframe); otherwise, if it closes through both sides of the OR, it gets classified as a double break day which significantly changes the data (see YM for an example of this)
*The attached picture is an example showing the breakdown level hit rates for ES using its 15m opening range
2
1
22
3,043
17 Dec 2025
Any questions about reports/timeframes etc. feel free to lmk - DMs are open, replies are on "verified only" bc of bots
Try Edgeful for free: edgeful.com/?via=tfo
2
1,374
11 Dec 2025
NQ: there are many ways to frame an opening range breakout but I want to highlight data from two: the 15m and the 1h
The 15m provides some great directional targets in a sustained breakout, ex.
> 94% odds of hitting the 0.5 extension from the OR
> 79% odds for the 1.0 extension
> 60% for the 1.5
(^ 5y lookback on *breakout days*)
But as soon as price closes through the other side of the OR, that becomes a double break day, *significantly* changing the odds:
> 94%👉67% odds for the 0.5 extension
> 79%👉39% odds for the 1.0
> 60%👉25% for the 1.5
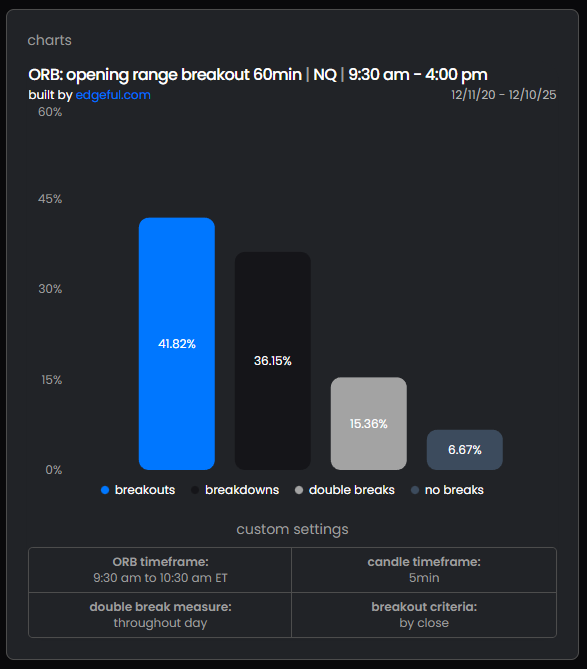
So where can the 1h be applied:
I like the 1h because the 15m is unreliable *on its own* to gauge the confidence of a breakout/breakdown day:
> 39% of all days close beyond both sides of the range (5m tf)
These days all started as breakout or breakdown days, until price eventually closed through the other side of the OR
But looking at the 1h opening range:
> Only 15% of days close through both sides of the range (5m tf)
> 78% of days break out in just one direction, while 7% don't break at all (still using 5m close here)
Even if using a wick criteria for what constitutes a "break" of the range, only 23% of days break both sides of the 1h range, while 52% of days break both sides of the 15m range
All that is to say, while the 15m OR (or any OR for that matter) can provide great levels to play off of, the nature of this one being so small (in both size and time) results in a much lower confidence of a sustained break
If looking for directional moves, something like the 1h OR can *add to existing confluence* that a given day's break might hold and not turn into a double break day
2
1
35
6,399
11 Dec 2025
Any questions about reports/timeframes etc. feel free to lmk - DMs are open, replies are on "verified only" bc of bots
Try Edgeful for free: edgeful.com/?via=tfo
1,512
Trade For Opportunity retweeted

11 Dec 2025
Here is our public version of the broadening formation indicator that ACTUALLY knows how to find them.
tradingview.com/script/zSldm…
I'd appreciate if you liked the indicator! This has taken me many many many hours to create.
p.s v1 does still have a few bugs but works well enough!
21
10
198
29,518
9 Dec 2025
NQ: if the first 1h of RTH closes above the 9:30am open, there's a ~79% chance of a green day*
And if the first 1h is red, there's a ~69% chance of a red day*
(*3 year lookback)
How does this hold up to the last month, for example?
11/10: 🟢1h, 🟢day☑️
11/11: 🔴1h, 🟢day❌
11/12: 🔴1h, 🔴day☑️
11/13: 🔴1h, 🔴day☑️
11/14: 🟢1h, 🟢day☑️
11/17: 🟢1h, 🔴day❌
11/18: 🔴1h, 🔴day☑️
11/19: 🟢1h, 🟢day☑️
11/20: 🟢1h, 🔴day❌
11/21: 🔴1h, 🟢day❌
11/24: 🟢1h, 🟢day☑️
11/25: 🔴1h, 🟢day❌
11/26: 🔴1h, 🟢day❌
11/27: 🟢1h, 🟢day☑️
11/28: 🟢1h, 🟢day☑️
12/01: 🟢1h, 🟢day☑️
12/02: 🟢1h, 🟢day☑️
12/03: 🟢1h, 🟢day☑️
12/04: 🔴1h, 🔴day☑️
12/05: 🟢1h, 🟢day☑️
12/08: 🔴1h, 🔴day☑️
12/09: 🟢1h, 🟢day☑️
Overall, 16/22 days (~73%) followed the RTH 1st hour to daily close correlation
Days with a green 1st hour were successful 11/13 times (~85%),
And days with a red 1st hour were just 4/9 times (~44%)
Another piece of information that might be useful in this analysis is the size of the 1st hour candle - aka how far the 1st hour relative to its open - since you could imagine, if the 1st hour closed 1% from its open, there's probably a slimmer chance that it completely reverses by EOD, compared to a day whose 1st hour closed say just 0.01% from its open
Here's the same data with the opening candle sizes:
11/10: 🟢1h, 🟢day☑️ - 0.39%
11/11: 🔴1h, 🟢day❌- 0.09%
11/12: 🔴1h, 🔴day☑️- 0.72%
11/13: 🔴1h, 🔴day☑️- 0.38%
11/14: 🟢1h, 🟢day☑️- 0.93%
11/17: 🟢1h, 🔴day❌- 0.8%
11/18: 🔴1h, 🔴day☑️- 0.79%
11/19: 🟢1h, 🟢day☑️- 1.15%
11/20: 🟢1h, 🔴day❌- 0.25%
11/21: 🔴1h, 🟢day❌- 0.12%
11/24: 🟢1h, 🟢day☑️- 0.66%
11/25: 🔴1h, 🟢day❌- 0.16%
11/26: 🔴1h, 🟢day❌- 0.22%
11/27: 🟢1h, 🟢day☑️- 0.02%
11/28: 🟢1h, 🟢day☑️- 0.04%
12/01: 🟢1h, 🟢day☑️- 0.44%
12/02: 🟢1h, 🟢day☑️- 0.41%
12/03: 🟢1h, 🟢day☑️- 0.0%
12/04: 🔴1h, 🔴day☑️- 0.61%
12/05: 🟢1h, 🟢day☑️- 0.43%
12/08: 🔴1h, 🔴day☑️- 0.18%
12/09: 🟢1h, 🟢day☑️- 0.15%
(Note the attached chart is from the initial, 3 year lookback)
3
1
23
3,855
9 Dec 2025
Any questions about reports/timeframes etc. feel free to lmk - DMs are open, replies are on "verified only" bc of bots
Try Edgeful for free: edgeful.com/?via=tfo
3
1,181