
📊 Daily Market Insights 💹 Stock & Macro Analysis 📰 Breaking Economic News 🔔 Actionable Updates for Traders & Investors By @TradingBrief
Joined December 2023
- Tweets 710
- Following 238
- Followers 90
- Likes 1,640
487 Photos and videos


Pinned Tweet

9 Sep 2025
🚀 Welcome to @TradingBrief
If you’re after:
📊 Market insights – key data & economic events
💹 Stock analysis – clear, actionable breakdowns
📰 Macro news – what really moves the markets
🔔 Fast updates – beat the crowd with timely info
I track what matters for traders & investors — so you can stay ahead.
👇 Hit follow and gain your edge.
5
553
23 Oct 2025
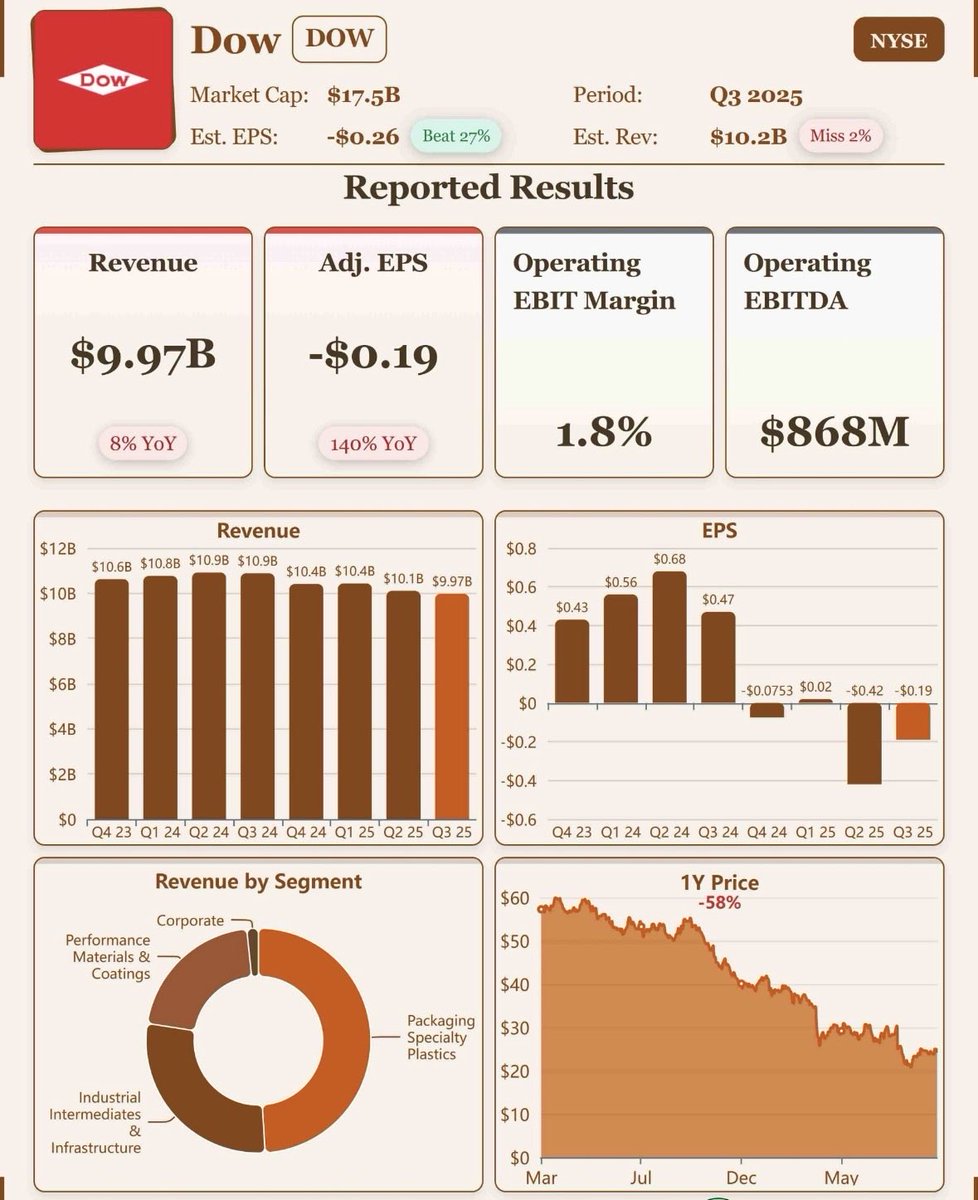
Dow, $DOW, Q3-25. Results:
📊 Adj. EPS: -$0.19 🟢
💰 Revenue: $10.0B 🔴
📈 Net Income: $124M
🔎 Sequential improvement in earnings and cash flow driven by cost-cutting and strong performance from new Gulf Coast assets.
1
55
21 Oct 2025
$MAT | Mattel Q3’25 Earnings Highlights
🔹 Revenue: $1.74B (Est. $1.84B) 🔴; DOWN -6% YoY (–7% in constant currency)
🔹 EPS (Adj.): $0.89 (Est. $1.06) 🔴; DOWN -22% YoY
🔹 Net Income: $278M; DOWN -25% YoY
🔹 Operating Income: $380M (Adj. $387M); DOWN -22% YoY
🔹 Gross Margin: 50.0% (Est. 50.3%) 🔴; DOWN -310bps YoY
🔹 Adjusted Gross Margin: 50.2%; DOWN -290bps YoY
Guidance (Reiterated FY25)
🔹 Adj. EPS: $1.54–$1.66 (Est. $1.61) 🟡
🔹 Adj. Gross Margin: ~50% (Est. 50.3%) 🟡
🔹 Net Sales: 1% to 3% constant currency 🟡
🔹 Adj. Operating Income: $700M–$750M
🔹 Free Cash Flow: ~$500M
🔹 Adj. Tax Rate: 23%–24%
Segment Highlights (YoY)
🔹 Dolls: $674M; DOWN -11% as reported (–12% constant FX)
🔹 Infant, Toddler & Preschool: $262M; DOWN -25% (–26% constant FX)
🔹 Vehicles: $626M; UP 8% ( 6% constant FX)
🔹 Action Figures, Building Sets, Games & Other: $404M; UP 11% ( 9% constant FX)
Cash Flow & Capital Returns
🔹 Operating Cash Flow (9M’25): –$203M; LOWER YoY
🔹 Share Repurchases: $202M in Q3; $412M YTD
🔹 FY25 Target: $600M total repurchases
🔹 Cash Used for Investing: $98M; IMPROVED YoY
Management Commentary
🔸 “While our US business was challenged by retailer order delays amid tariff uncertainty, consumer demand remains strong globally.” — Ynon Kreiz, CEO
🔸 “Orders have accelerated since the start of Q4, and we expect a strong holiday season with topline growth.”
🔸 “We operated with excellence in a dynamic environment and remain on track to achieve our $600M share repurchase goal.” — Paul Ruh, CFO
2
111
21 Oct 2025
Pegasystems, $PEGA, Q3-25. Results:
📊 Adj. EPS: $0.30 🟢
💰 Revenue: $381.4M 🟢
📈 Net Income: $43.4M
🔎 Strong Pega Cloud ACV growth ( 27%) and $347M in operating cash flow fueled major share repurchases and AI momentum.
1
84
21 Oct 2025
EQT Corporation, $EQT, Q3-25. Results:
📊 Adj. EPS: $0.52 🟢
💰 Revenue: $1.75B 🔴
📈 Net Income: $336M
🔎 Free cash flow of $484M and record-low unit operating costs reflect strong execution and integration of Olympus assets.
1
254
21 Oct 2025
$NFLX Netflix Q3 FY25:
• Revenue 17% Y/Y to $11.5B (in-line).
• Operating margin 28% (-1pp Y/Y).
• EPS $5.87 ($1.10 miss).
FY25 Guidance:
• Revenue ~$45.1B ($0.1B raise).
• Operating margin 29% (0.5pp cut).
1
69
21 Oct 2025
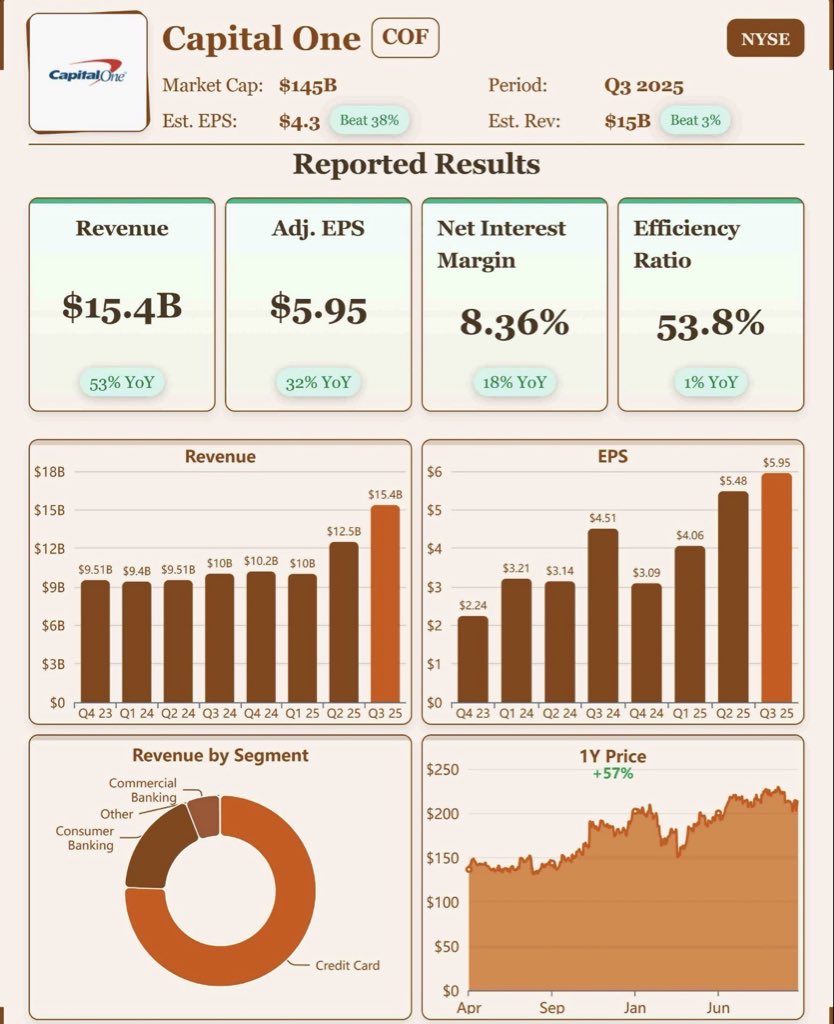
Capital One, $COF, Q3-25. Results:
📊 Adj. EPS: $5.95 🟢
💰 Revenue: $15.36B 🟢
📈 Net Income: $3.2B
🔎 Strong top-line growth, solid credit results, and continued momentum in Discover integration.
🔹 Net Interest Margin: 8.36% (Est. 8.11%) 🟢; UP 74bps QoQ
🔹 Provision for Credit Losses: $2.71B (Est. $3.80B) 🟢; DOWN -8.7B QoQ
🔹 Net Charge-Offs: $3.47B (Est. $3.71B) 🟢
🔹 Efficiency Ratio: 53.8% (Est. 51%) 🔴
🔹 Total Deposits: $468.8B (Est. $479.8B) 🔴; FLAT QoQ
🔹 Loans Held for Investment: $443.2B (Est. $443.9B) 🟡; UP 1% QoQ
🔹 Net Income: $3.2B, or $4.83/sh (GAAP)
Segment & Loan Growth
🔹 Credit Card Loans: $271.0B; UP <1% QoQ
🔹 Domestic Card Loans: $254.0B; UP 1% QoQ
🔹 Consumer Banking Loans: $83.2B; UP 2% QoQ
🔹 Auto Loans: $82.0B; UP 3% QoQ
🔹 Commercial Banking Loans: $88.9B; UP 1% QoQ
Other Key Metrics
🔹 CET1 Ratio: 14.4%
🔹 Pre-Provision Earnings: $7.1B; UP 29% QoQ
🔹 Loan Reserve Release: $760M
🔹 Avg. Deposits: $467.3B; UP 13% QoQ
🔹 Interest-Bearing Deposit Rate: 3.27%; 5bps QoQ
🔹 September Charge-Offs: 4.35%
🔹 September Delinquencies: 3.89%
Adjusting Items (Pre-tax impact)
🔹 Discover Integration Expenses: $348M ($0.41/sh)
🔹 Discover Intangible Amortization: $498M ($0.59/sh)
🔹 Discover FV Mark Amortization: $105M ($0.12/sh)
Management Commentary
🔸 “Our adjusted earnings, top-line growth, credit results, and capital generation continued to be strong.”
🔸 “The Discover integration continues to go well and we are well positioned to capitalize on the opportunities ahead.” — Richard D. Fairbank, CEO
🔸️Buyback authorisation of $16 billion of common shares.
1
1
4
211
21 Oct 2025
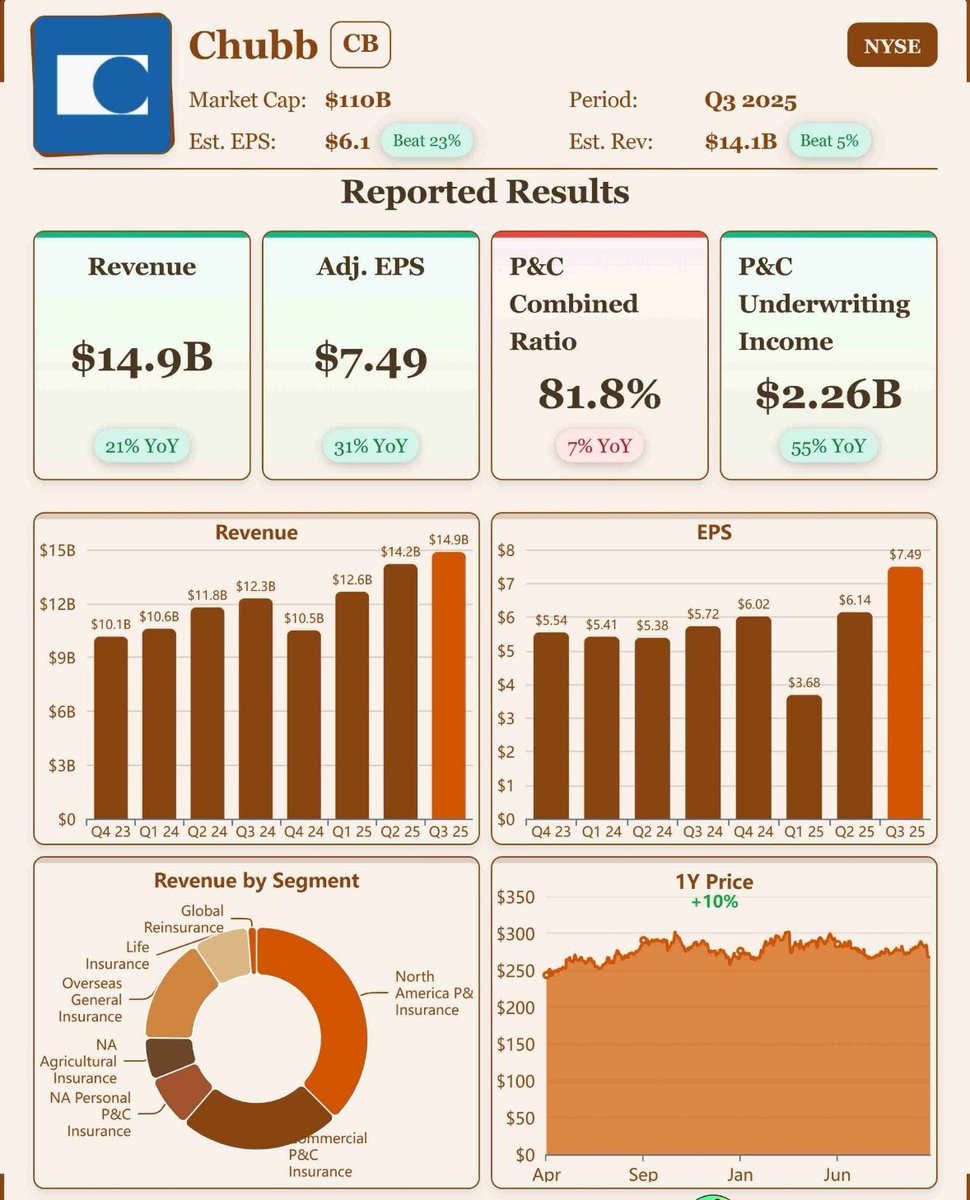
Chubb, $CB, Q3-25. Results:
📊 Adj. EPS: $7.49 🟢
💰 Revenue: $14.9B 🟢
📈 Net Income: $2.80B
🔎 Record underwriting and investment income drove core operating EPS to $7.49; combined ratio hit a record low of 81.8%.
1
2
276
21 Oct 2025
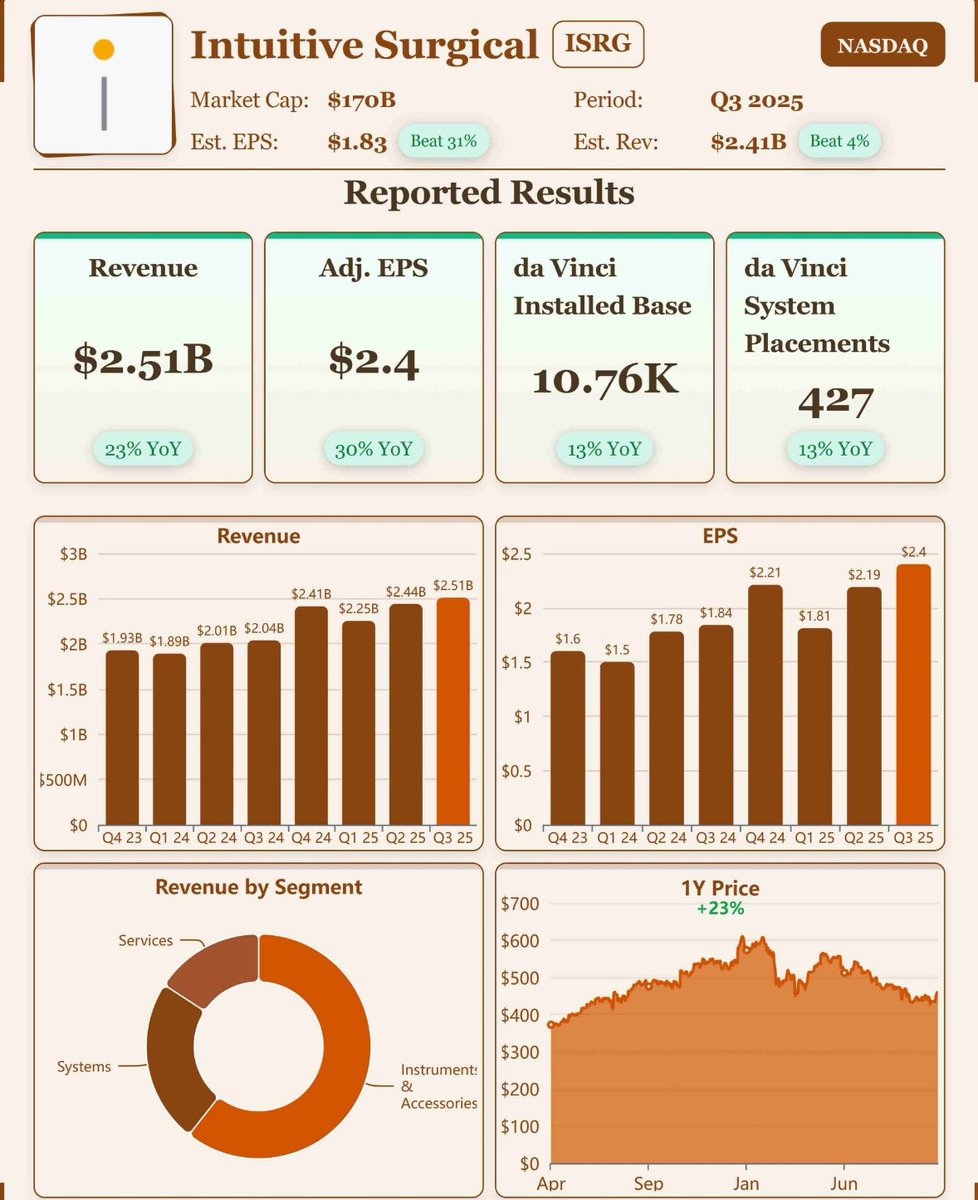
Intuitive Surgical, $ISRG, Q3-25. Results:
📊 Adj. EPS: $2.40 🟢
💰 Revenue: $2.51B 🟢
📈 Net Income: $704M
🔎 Continued growth in da Vinci and Ion procedures, with 427 da Vinci systems placed—240 of them da Vinci 5 units.
🔹 Non-GAAP OI: $976M (vs. $755M) 🟢
FY25 Outlook
🔹 da Vinci Procedure Growth: 17 – 17.5% YoY (vs. 17% FY24)
🔹 Non-GAAP Gross Margin: 67 – 67.5% (vs. 69.1% FY24) 🟡
→ Includes ~70 bps impact from tariffs
🔹 Non-GAAP OpEx Growth: 11 – 13% YoY (vs. 10% FY24)
Q3 Operational Highlights
🔹 Worldwide Procedures: 20% YoY
🔹 da Vinci: 19% YoY
🔹 Ion: 52% YoY
🔹 System Placements:
🔹 da Vinci Systems: 427 (vs. 379 YoY)
🔹 Includes 240 da Vinci 5 systems (vs. 110 YoY)
🔹 Ion Systems: 50 (vs. 58 YoY)
🔹 Installed Base:
🔹da Vinci: 10,763 ( 13% YoY)
🔹Ion: 954 ( 30% YoY)
Revenue Breakdown:
🔹 Instruments & Accessories: $1.52B ( 20% YoY)
🔹 Systems: $590M ( 33% YoY)
🔹 Service & Other: $400M (approx., steady YoY)
Balance Sheet & Capital Return
🔹 Cash & Investments: $8.43B (↓ $1.1B QoQ)
🔹 Share Repurchases: 4.0M shares for $1.92B in Q3
🔹 Operating Cash Flow: Strong, offset by buybacks capex
CEO Comment (Dave Rosa)
🔸 “We’re pleased with our strong results this quarter, underscored by continued growth and adoption of our Ion and da Vinci 5 platforms.”
🔸 “We remain focused on the Quintuple Aim — better patient outcomes, improved care team experience, wider access to high-quality care, and lower overall costs.”
1
113
21 Oct 2025
Texas Instruments, $TXN, Q3-25. Results:
📊 Adj. EPS: $1.48 🔴
💰 Revenue: $4.74B 🟢
📈 Net Income: $1.36B
🔎 Broad-based growth across all end markets drove a 14% revenue increase, with strong free cash flow and $6.6B returned to shareholders.
🔹 Operating Profit: $1.66B (Est. $1.67B) 🟡 7% YoY
Q4 Guidance
🔹 Revenue: $4.22B–$4.58B (Est. $4.50B) 🔴
🔹 EPS: $1.13–$1.39 (Est. $1.40) 🔴
Q3 Segments
Analog
🔹 Revenue: $3.73B; 16% YoY
🔹 Operating Profit: $1.49B; 13% YoY
🔹 Margin: 39.8%
Embedded Processing
🔹 Revenue: $709M; 9% YoY
🔹 Operating Profit: $108M; Flat YoY
🔹 Margin: 15.2%
Other
🔹 Revenue: $304M; 11% YoY
🔹 Operating Profit: $69M; -47% YoY (includes restructuring charges)
Other Key Metrics
🔹 Free Cash Flow: $1.07B (Est. $655M) 🟢 65% YoY
🔹 Capex: $1.20B (Est. $1.28B) 🟡
🔹 Operating Cash Flow: $2.19B; TTM $6.9B ( 10% YoY)
🔹 Trailing-12M FCF: $2.4B; 14% of revenue
🔹 Cash Returned to Shareholders (TTM): $6.6B
• Dividends: $4.95B ( 4% YoY)
• Buybacks: $1.61B ( 253% YoY)
CEO Commentary (Haviv Ilan)
🔸 “Revenue increased 7% sequentially and 14% YoY with growth across all end markets.”
🔸 “Our $6.9B in trailing-12-month operating cash flow highlights the strength of our business model and 300mm manufacturing advantage.”
🔸 “We continue to invest heavily — $4.8B in capex and $3.9B in R&D and SG&A — while returning $6.6B to shareholders.”
1
69
21 Oct 2025
Netflix, $NFLX, Q3-25 Results:
📊 Adj. EPS: $5.87 🔴
💰 Revenue: $11.51B 🔴
📈 Net Income: $2.55B
🔎 Netflix posted record view share in the US and UK, and hit its best ad sales quarter ever, driven by strong content like KPop Demon Hunters and live events.
2
143
21 Oct 2025
$NFLX | Netflix Q3’25 Earnings Highlights
🔹 Revenue: $11.51B (Est. $11.52B) 🔴; UP 17% YoY
🔹 EPS: $5.87 (Est. $6.94) 🔴; UP 9% YoY
🔹 Free Cash Flow: $2.66B; UP 21% YoY
Q4’25 Guidance
🔹 Revenue: $11.96B (Est. $11.90B) 🟢
🔹 EPS: $5.45 (Est. $5.42) 🟢
🔹 Operating Income: $2.86B (Est. $2.88B) 🔴
🔹 Operating Margin: 23.9% (Est. 24.1%) 🔴
FY25 Guidance
🔹 Revenue: $45.1B; from $44.8B–$45.2B
🔹 Operating Margin: 29%; from ~30% (reported) / 29.5% (F/X basis)
🔹 Free Cash Flow: ~$9B; from $8.0B–$8.5B
Q3 Segment Revenue (YoY)
🔹 U.S. & Canada (UCAN): $5.07B; UP 17% YoY
🔹 EMEA: $3.70B; UP 18% YoY
🔹 Latin America: $1.37B; UP 10% YoY
🔹 APAC: $1.37B; UP 21% YoY
Other Key Q3 Metrics
🔹 Operating Income: $3.25B; UP 12% YoY
🔹 Operating Margin: 28.2%; DOWN -1.8 ppts YoY
🔹 Operating Cash Flow: $2.83B; UP 22% YoY
🔹 Share Repurchases: $1.9B; Authorization Remaining $10.1B
🔹 Cash & Equivalents: $9.3B; Gross Debt: $14.5B
Commentary
🔸 “Operating margin was below guidance due to an expense related to an ongoing dispute with Brazilian tax authorities; absent this, we would have exceeded our Q3’25 operating margin forecast.”
🔸 “We recorded our best ad sales quarter ever and are on track to more than double ads revenue in 2025.”
🔸 “We’re finishing the year with good momentum and an exciting Q4 slate, including the final season of Stranger Things and multiple live events.”
1
121
14 Oct 2025
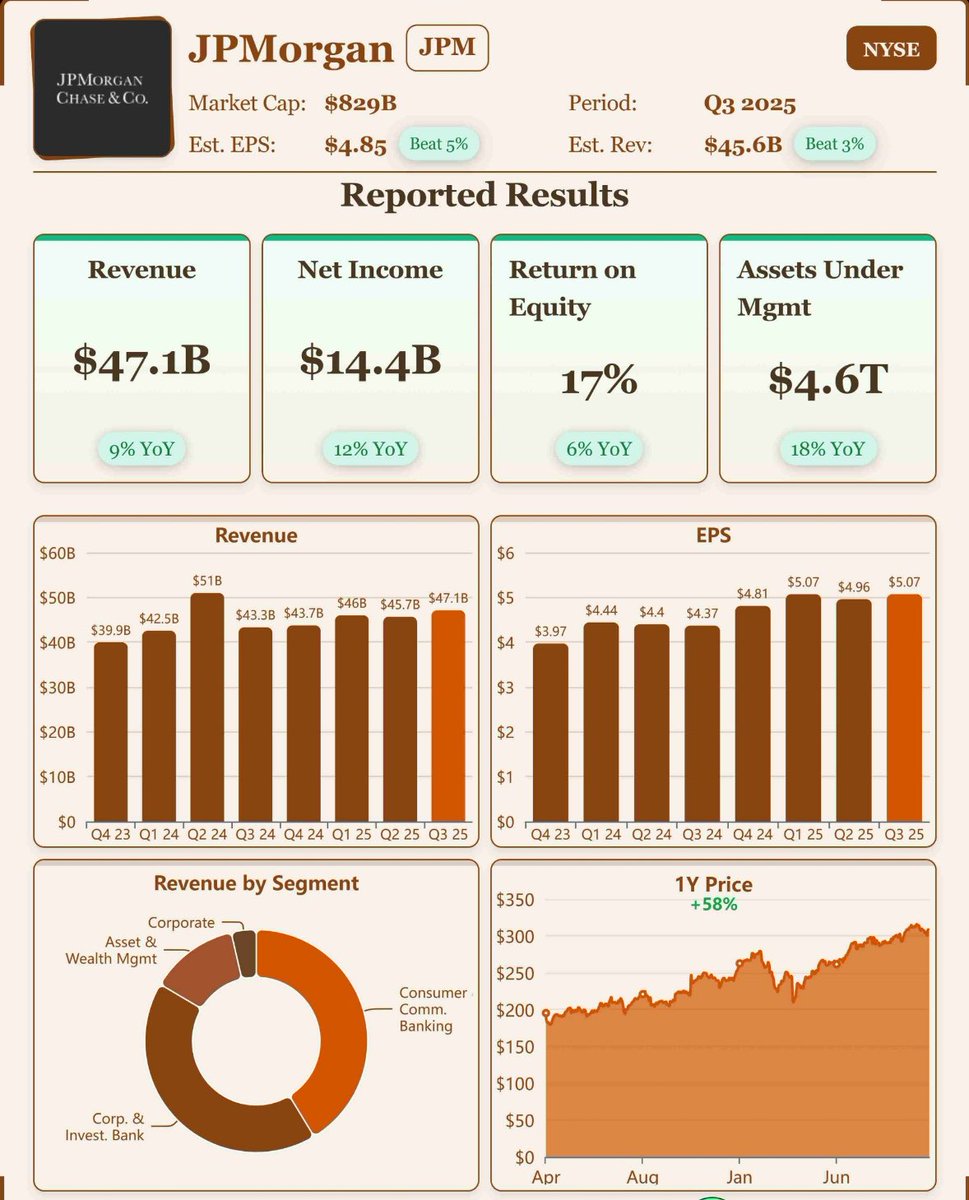
JPMorgan Chase, $JPM, 3Q-25. Results:
📊 EPS: $5.07 🟢
💰 Revenue: $47.1B 🟢
📈 Net Income: $14.4B
🔎 Strong quarter driven by record Markets revenue ($8.9B) and solid performance across CIB, CCB, and AWM, with net income rising 12% YoY.
1
82
7 Oct 2025
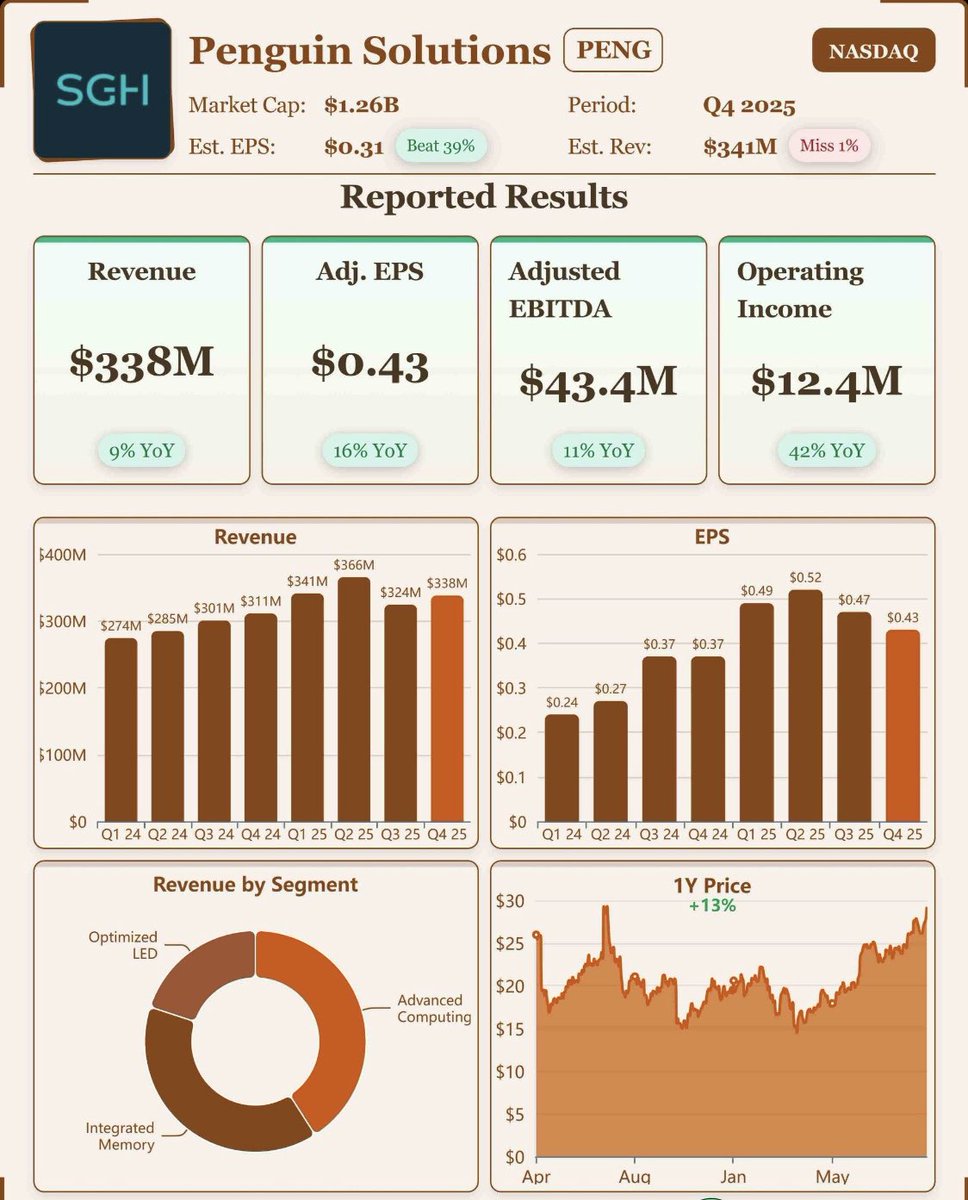
Penguin Solutions, $PENG, Q4-25. Results:
📊 Adj. EPS: $0.43 🟢
💰 Revenue: $338M 🔴
📈 Net Income: $9.4M
🔎 Transformation to an enterprise AI infrastructure company shows momentum with growing sales and profitability.
2
152
7 Oct 2025
Tesla $TSLA has officially rolled out cheaper models:
Model 3 Standard RWD – $36,990
Model Y Standard RWD – $39,990
The new trims strip back some premium features but still offer a 321-mile range on the Model Y.
3
153
7 Oct 2025
Qualcomm $QCOM is buying Italian hardware maker Arduino, known for its low-cost circuit boards used in robotics labs and prototypes.
Arduino will operate as an independent subsidiary. First new product: an Arduino board powered by a Qualcomm chip priced at $45–55.
2
71
7 Oct 2025
$DELL raised its long-term outlook, now guiding for 7–9% annual sales growth through FY2030 (vs 3–4% prior) and at least 15% EPS growth (vs 8% prior)
The company has built a $20B AI business in two years and pledged to keep raising its dividend 10% annually through 2030
2
68
7 Oct 2025
Hello all, below is a list of today’s top 5 analyst calls for stocks that have been upgraded, downgraded, or newly initiated — based on reviews from major financial analysts and brokerages.
Top 5 Upgrades:
1️⃣ Seaport Research upgraded $NFLX to Buy from Neutral with a price target of $1,385, up from $1,230.
2️⃣ Jefferies upgraded $AMD to Buy from Hold with a price target of $300, up from $170.
3️⃣ JPMorgan upgraded $EAT to Overweight from Neutral with a price target of $175, down from $180.
4️⃣ TD Cowen upgraded $VEEV to Buy from Hold with a price target of $380, up from $297.
5️⃣ Evercore ISI upgraded $EW to Outperform from In Line with a price target of $88, up from $80.
Top 5 Downgrades:
1️⃣ Jefferies downgraded $DLTR to Underperform from Hold with a price target of $70, down from $110.
2️⃣ Citi downgraded $GEHC to Neutral from Buy with a price target of $83, down from $93.
3️⃣ JPMorgan downgraded $SYF to Neutral from Overweight with a price target of $75, down from $80.
4️⃣ Stephens downgraded $KMX to Equal Weight from Overweight with a price target of $42, down from $53.
5️⃣ JPMorgan downgraded $OMF to Neutral from Overweight with a price target of $57, down from $63.
Top 5 Initiations:
1️⃣ Raymond James initiated coverage of $BRCB with an Outperform rating and a $26 price target.
2️⃣ Deutsche Bank initiated coverage of $VIA with a Buy rating and a $55 price target.
3️⃣ UBS resumed coverage of $DOCN with a Neutral rating and a $40 price target, up from $32.
4️⃣ Goldman Sachs initiated coverage of $LGN with a Buy rating and a $37 price target, implying 20% upside.
5️⃣ Cantor Fitzgerald initiated coverage of $GEMI with an Overweight rating and a $37 price target.
Let me know if you’d like a quick breakdown on why these changes were made — happy to provide more details
2
54
7 Oct 2025
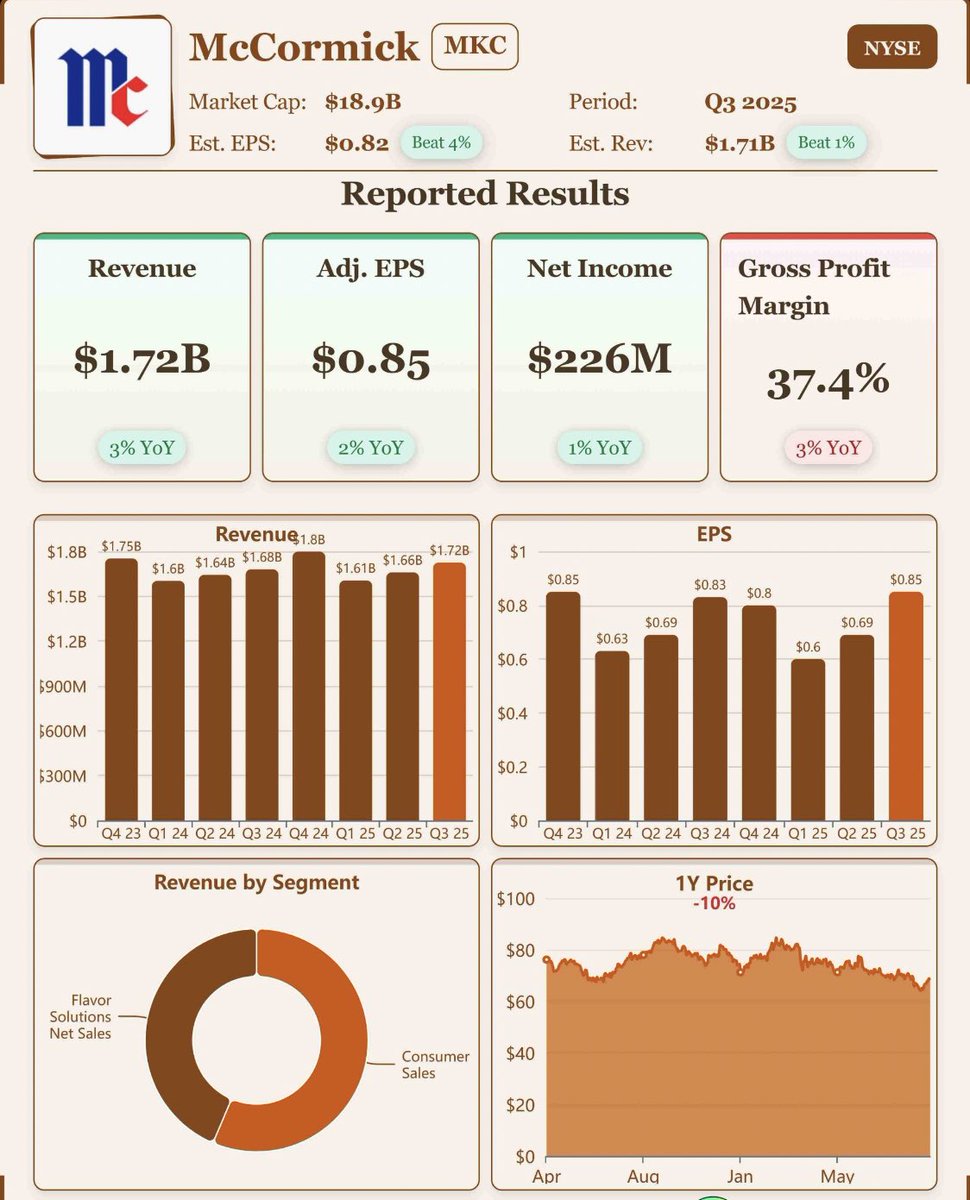
McCormick & Company, $MKC, Q3-25. Results:
📊 Adj. EPS: $0.85 🟢
💰 Revenue: $1.72B 🟢
📈 Net Income: $225.5M
🔎 Fifth consecutive quarter of volume-led growth despite margin pressure from rising costs and tariffs.
2
28
7 Oct 2025
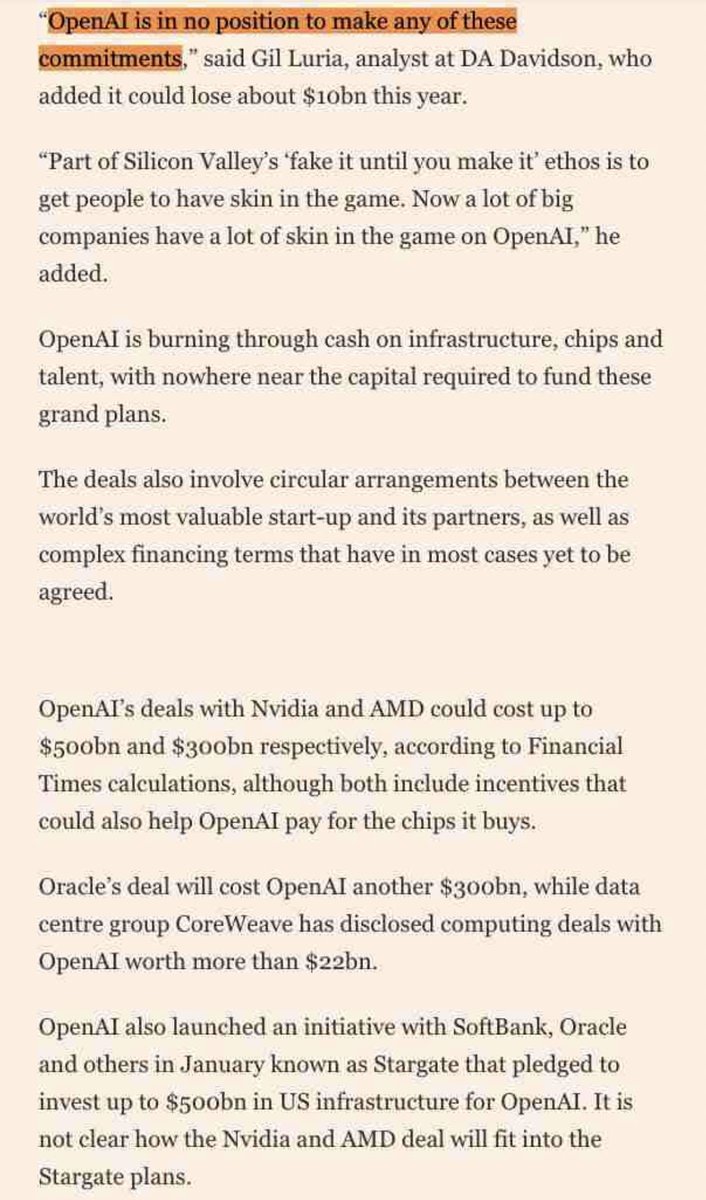
OpenAI has now locked in roughly $1 trillion worth of computing deals this year with $NVDA, $AMD, $ORCL, and $CRWV, covering more than 20 gigawatts of AI capacity over the next decade.
For context, that’s about the output of 20 nuclear reactors. Each 1GW of AI compute build-out runs close to $50B.
Financial Times estimates:
• $500B for Nvidia
• $300B for AMD
• $300B for Oracle
• $22B already disclosed by CoreWeave
2
143