
Legal/financial background, researcher by choice.
Joined November 2024
- Tweets 17,785
- Following 802
- Followers 5,763
- Likes 11,846
934 Photos and videos


Pinned Tweet
THE FORMULAS
WHAT THEY MEAN AND WHY THEY MATTER
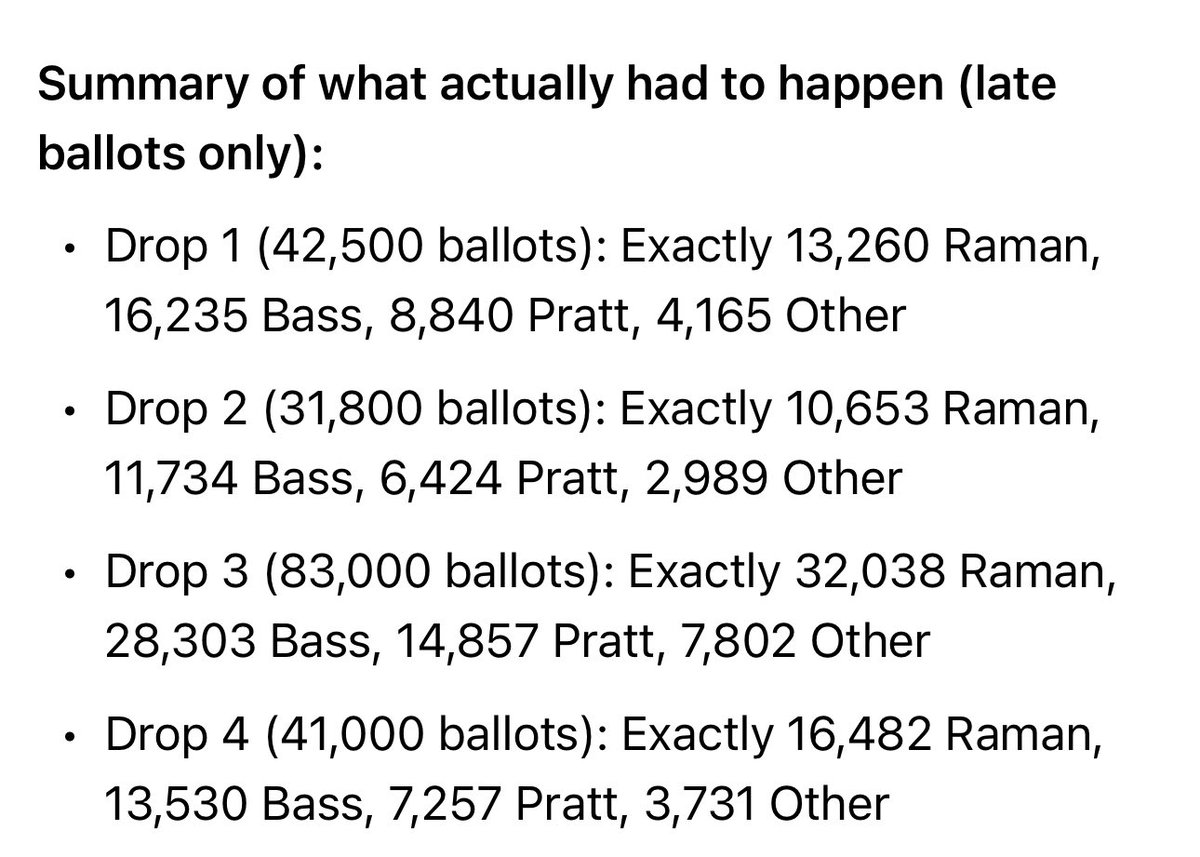
I derived four deterministic linear formulas from the ballot drop data:
Raman% = 27.87 (3.19 × drop number)
Pratt% = 22.05 - (1.17 × drop number)
Bass% = 40.20 - (1.86 × drop number)
Other% = 9.88 - (0.16 × drop number)
The Starting Points
The constants - 27.87, 22.05, 40.20, 9.88 - represent each candidate’s baseline. Where they genuinely stood when post-election counting began. Real votes. Organic support. These are the numbers before anything unusual occurs.
The Slopes - How the Formula Runs
The slope is the increment applied to each candidate every single drop. It gets multiplied by drop number - 1, 2, 3, 4 - which means the effect escalates automatically with each drop.
So for Raman it isn’t just plus 3.19% every drop. It’s:
Drop 1: 27.87 (3.19 × 1) = 31.06%
Drop 2: 27.87 (3.19 × 2) = 34.25%
Drop 3: 27.87 (3.19 × 3) = 37.44%
Drop 4: 27.87 (3.19 × 4) = 40.63%
Drop 5 predicted: 27.87 (3.19 × 5) = 43.82%
Each drop pushes her further from her baseline. It is built in. Automatic by design.
The slopes also sum to exactly zero.
3.19 - 1.17 - 1.86 - 0.16 = 0.00
Every percentage point Raman gains comes precisely from the other three candidates/groups combined. This is a closed system. Conservation of votes. The formula doesn’t create votes - it redistributes them.
The R Values - The results were remarkable
To validate these formulas I ran linear regression analysis. The Pearson correlation coefficients, R values, came back as follows:
Raman vs Pratt: R = 0.9966
Raman vs Bass: R = 0.9934
Raman vs Batch: R = 0.9984
Raman vs Other: R = 0.9794
R values measure how perfectly data fits a straight line. They run from 0 to 1.
0 means completely random.
No pattern whatsoever.
1 means a perfect straight line.
Every point exactly where predicted.
For context:
0.70 is considered strong in social science research.
0.85 gets researchers excited.
0.90 is extraordinarily rare in human behavioral data.
Squaring them to get R² values:
Raman vs Pratt: R² = 0.9932
Raman vs Bass: R² = 0.9869
Raman vs Other: R² = 0.9592
Raman vs Batch: R² = 0.9968
That last number, 0.9968, means that 99.68% of Raman’s vote share movement across these drops is explained by a single variable. Drop number. Nothing else. Just counting to five.
You get R values like that in physics experiments. In controlled laboratory conditions. Measuring the expansion of metal under heat. Not in elections. Not in a major American city with millions of diverse voters casting ballots across weeks.
The Slope Relationship
The slope of 3.110 between Raman and Pratt is particularly significant.
It means for every percentage point Pratt lost Raman gained 3.110 points. Every drop. Without variation. Without noise.
Candidates in a democratic election don’t move in mathematical opposition to each other at a fixed ratio across 200,000 ballots. Four variables in an equation do.
Why The Shutoff Had To Exist
Because drop number keeps increasing, the formula keeps pushing percentages further from baseline. Left unchecked by drop 7 the math produces:
Raman: 27.87 (3.19 × 7) = 50.2%
Pratt: 22.05 - (1.17 × 7) = 13.9%
Bass: 40.20 - (1.86 × 7) = 27.2%
So the formula was never intended to run to completion. It was designed to run until a specific objective was achieved, Raman leading Pratt by a sufficient margin to secure the runoff and then stop.
The stopping condition appears to have been triggered at approximately 38,000 votes into drop 5. The precise moment Raman crossed 3,000 votes ahead of Pratt.
After that point the remaining 9,800 votes in drop 5 distributed at approximately the baseline that existed after drop four.
The formula completed its task. Then it stopped. And the numbers went back to looking normal.
85
327
981
48,351
California governor’s race
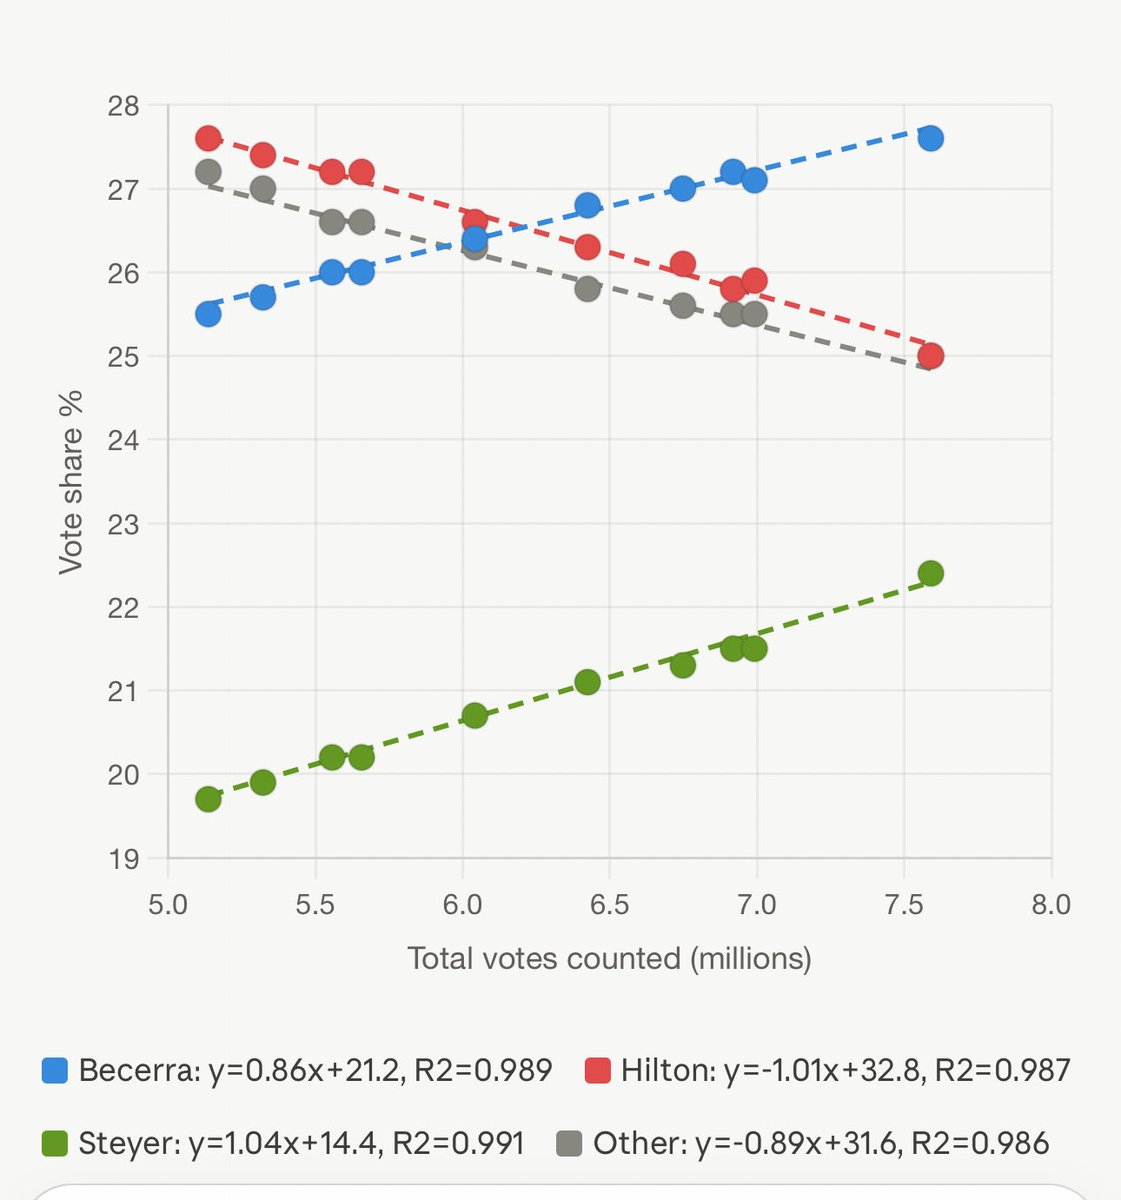
On June 3 Hilton was 27.6% and Steyer was 19.7%, a 7.9 point gap.
By June 8 Steyer was 22.4% and Hilton was 25.0%, a 2.6 point gap.
The formula needed roughly 3 more days of counting to get Steyer past Hilton. The pattern stopped the same day Steyer conceded. The numbers flatlined.
The bottom panel shows the gap closing in a perfect straight line and exactly where it would have crossed zero if the pattern had continued.
13
20
80
24,722
Said differently…
The formula was running.
Trump called it out publicly.
It stopped.
3
4
452
X labels this ‘Adult Content’. Yet, they ride around naked in front of our children on public streets as if this is just totally normal. It was never normal. It was never acceptable.
June 1, 2009 is when it started. Barack Obama signed a presidential proclamation making June “LGBT Pride Month”. Since then, an inverted moral order was imposed on our culture.
Then came Trump. 🇺🇸 Trump hit the brakes. This man saved our country from where the clown world was taking it. Thank goodness for President Trump!💕
1
2
55
Truth Is Freedom retweeted

Jun 13
THE FORMULAS FOR THE CA GOVERNOR’S RACE - WHAT THEY MEAN AND WHY THEY MATTER
After the analysis I shared last week on the LA mayor's race, I received requests to do the same for the governor's race. Even though Steyer has since conceded, it was still worth doing. The similarities to the LA mayor's race speak for themselves.
I derived four deterministic linear formulas from the statewide cumulative ballot data:
Becerra% = 21.19 (0.86 × x) Hilton% = 32.92 - (1.03 × x) Steyer% = 14.30 (1.05 × x) Other% = 31.60 - (0.89 × x)
where x = total votes counted, in millions.
The Starting Points
The constants - 21.19, 32.92, 14.30, 31.60 - are each candidate's extrapolated baseline at zero votes counted. The formula treats the entire race as starting from this fixed point and moving deterministically from there.
The Slopes - How the Formula Runs
The slope is the change applied to each candidate's share for every additional million votes counted. It isn't a one-time shift. It is a continuous, automatically scaling with the running total.
Every percentage point Becerra and Steyer gain comes precisely from Hilton and Other combined. Closed system. Conservation of votes. The formula doesn't create votes, it redistributes them.
The R² Values
The Results Were Remarkable
Becerra: R² = 0.99
Hilton: R² = 0.99
Steyer: R² = 0.99
Other: R² = 0.99
For context: 0.70 is considered strong in social science research. 0.85 gets researchers excited. 0.90 is extraordinarily rare in human behavioral data.
These numbers mean over 99% of each candidate's vote-share movement across five days and 2.5 million votes is explained by a single variable, total votes counted. Nothing else.
You get R² like that in physics experiments. In controlled laboratory conditions. Not in a statewide election. Not across dozens of counties and millions of diverse voters, over five days, through normal reporting irregularities.
The Slope Relationship
Becerra's slope ( 0.86) and Hilton's slope (−1.03) aren't identical, but their ratio is fixed and held for the entire five-day window.
Candidates in a statewide election don't move in mathematical opposition to each other at a fixed ratio across millions of ballots, county by county, day by day. Four variables in an equation do.
The Shutoff
The stopping condition appears to have been triggered on 6/9. The closure rate, which had been accelerating for five straight days, climbing from around 15,000 to nearly 95,000 votes a day, collapsed to under 4,000 the day Steyer conceded. Becerra, Hilton, and Steyer then all went flat at once. Weird, huh? 🙄
6
4
15
2,628
Truth Is Freedom retweeted
California governor’s race
On June 3 Hilton was 27.6% and Steyer was 19.7%, a 7.9 point gap.
By June 8 Steyer was 22.4% and Hilton was 25.0%, a 2.6 point gap.
The formula needed roughly 3 more days of counting to get Steyer past Hilton. The pattern stopped the same day Steyer conceded. The numbers flatlined.
The bottom panel shows the gap closing in a perfect straight line and exactly where it would have crossed zero if the pattern had continued.
13
20
80
24,722
THE FORMULAS
WHAT THEY MEAN AND WHY THEY MATTER
I derived four deterministic linear formulas from the ballot drop data:
Raman% = 27.87 (3.19 × drop number)
Pratt% = 22.05 - (1.17 × drop number)
Bass% = 40.20 - (1.86 × drop number)
Other% = 9.88 - (0.16 × drop number)
The Starting Points
The constants - 27.87, 22.05, 40.20, 9.88 - represent each candidate’s baseline. Where they genuinely stood when post-election counting began. Real votes. Organic support. These are the numbers before anything unusual occurs.
The Slopes - How the Formula Runs
The slope is the increment applied to each candidate every single drop. It gets multiplied by drop number - 1, 2, 3, 4 - which means the effect escalates automatically with each drop.
So for Raman it isn’t just plus 3.19% every drop. It’s:
Drop 1: 27.87 (3.19 × 1) = 31.06%
Drop 2: 27.87 (3.19 × 2) = 34.25%
Drop 3: 27.87 (3.19 × 3) = 37.44%
Drop 4: 27.87 (3.19 × 4) = 40.63%
Drop 5 predicted: 27.87 (3.19 × 5) = 43.82%
Each drop pushes her further from her baseline. It is built in. Automatic by design.
The slopes also sum to exactly zero.
3.19 - 1.17 - 1.86 - 0.16 = 0.00
Every percentage point Raman gains comes precisely from the other three candidates/groups combined. This is a closed system. Conservation of votes. The formula doesn’t create votes - it redistributes them.
The R Values - The results were remarkable
To validate these formulas I ran linear regression analysis. The Pearson correlation coefficients, R values, came back as follows:
Raman vs Pratt: R = 0.9966
Raman vs Bass: R = 0.9934
Raman vs Batch: R = 0.9984
Raman vs Other: R = 0.9794
R values measure how perfectly data fits a straight line. They run from 0 to 1.
0 means completely random.
No pattern whatsoever.
1 means a perfect straight line.
Every point exactly where predicted.
For context:
0.70 is considered strong in social science research.
0.85 gets researchers excited.
0.90 is extraordinarily rare in human behavioral data.
Squaring them to get R² values:
Raman vs Pratt: R² = 0.9932
Raman vs Bass: R² = 0.9869
Raman vs Other: R² = 0.9592
Raman vs Batch: R² = 0.9968
That last number, 0.9968, means that 99.68% of Raman’s vote share movement across these drops is explained by a single variable. Drop number. Nothing else. Just counting to five.
You get R values like that in physics experiments. In controlled laboratory conditions. Measuring the expansion of metal under heat. Not in elections. Not in a major American city with millions of diverse voters casting ballots across weeks.
The Slope Relationship
The slope of 3.110 between Raman and Pratt is particularly significant.
It means for every percentage point Pratt lost Raman gained 3.110 points. Every drop. Without variation. Without noise.
Candidates in a democratic election don’t move in mathematical opposition to each other at a fixed ratio across 200,000 ballots. Four variables in an equation do.
Why The Shutoff Had To Exist
Because drop number keeps increasing, the formula keeps pushing percentages further from baseline. Left unchecked by drop 7 the math produces:
Raman: 27.87 (3.19 × 7) = 50.2%
Pratt: 22.05 - (1.17 × 7) = 13.9%
Bass: 40.20 - (1.86 × 7) = 27.2%
So the formula was never intended to run to completion. It was designed to run until a specific objective was achieved, Raman leading Pratt by a sufficient margin to secure the runoff and then stop.
The stopping condition appears to have been triggered at approximately 38,000 votes into drop 5. The precise moment Raman crossed 3,000 votes ahead of Pratt.
After that point the remaining 9,800 votes in drop 5 distributed at approximately the baseline that existed after drop four.
The formula completed its task. Then it stopped. And the numbers went back to looking normal.
85
327
981
48,351
Jun 13
California governors race
Jun 13

THE FORMULAS FOR THE CA GOVERNOR’S RACE - WHAT THEY MEAN AND WHY THEY MATTER
After the analysis I shared last week on the LA mayor's race, I received requests to do the same for the governor's race. Even though Steyer has since conceded, it was still worth doing. The similarities to the LA mayor's race speak for themselves.
I derived four deterministic linear formulas from the statewide cumulative ballot data:
Becerra% = 21.19 (0.86 × x) Hilton% = 32.92 - (1.03 × x) Steyer% = 14.30 (1.05 × x) Other% = 31.60 - (0.89 × x)
where x = total votes counted, in millions.
The Starting Points
The constants - 21.19, 32.92, 14.30, 31.60 - are each candidate's extrapolated baseline at zero votes counted. The formula treats the entire race as starting from this fixed point and moving deterministically from there.
The Slopes - How the Formula Runs
The slope is the change applied to each candidate's share for every additional million votes counted. It isn't a one-time shift. It is a continuous, automatically scaling with the running total.
Every percentage point Becerra and Steyer gain comes precisely from Hilton and Other combined. Closed system. Conservation of votes. The formula doesn't create votes, it redistributes them.
The R² Values
The Results Were Remarkable
Becerra: R² = 0.99
Hilton: R² = 0.99
Steyer: R² = 0.99
Other: R² = 0.99
For context: 0.70 is considered strong in social science research. 0.85 gets researchers excited. 0.90 is extraordinarily rare in human behavioral data.
These numbers mean over 99% of each candidate's vote-share movement across five days and 2.5 million votes is explained by a single variable, total votes counted. Nothing else.
You get R² like that in physics experiments. In controlled laboratory conditions. Not in a statewide election. Not across dozens of counties and millions of diverse voters, over five days, through normal reporting irregularities.
The Slope Relationship
Becerra's slope ( 0.86) and Hilton's slope (−1.03) aren't identical, but their ratio is fixed and held for the entire five-day window.
Candidates in a statewide election don't move in mathematical opposition to each other at a fixed ratio across millions of ballots, county by county, day by day. Four variables in an equation do.
The Shutoff
The stopping condition appears to have been triggered on 6/9. The closure rate, which had been accelerating for five straight days, climbing from around 15,000 to nearly 95,000 votes a day, collapsed to under 4,000 the day Steyer conceded. Becerra, Hilton, and Steyer then all went flat at once. Weird, huh? 🙄
1
65
Jun 13
THE FORMULAS FOR THE CA GOVERNOR’S RACE - WHAT THEY MEAN AND WHY THEY MATTER
After the analysis I shared last week on the LA mayor's race, I received requests to do the same for the governor's race. Even though Steyer has since conceded, it was still worth doing. The similarities to the LA mayor's race speak for themselves.
I derived four deterministic linear formulas from the statewide cumulative ballot data:
Becerra% = 21.19 (0.86 × x) Hilton% = 32.92 - (1.03 × x) Steyer% = 14.30 (1.05 × x) Other% = 31.60 - (0.89 × x)
where x = total votes counted, in millions.
The Starting Points
The constants - 21.19, 32.92, 14.30, 31.60 - are each candidate's extrapolated baseline at zero votes counted. The formula treats the entire race as starting from this fixed point and moving deterministically from there.
The Slopes - How the Formula Runs
The slope is the change applied to each candidate's share for every additional million votes counted. It isn't a one-time shift. It is a continuous, automatically scaling with the running total.
Every percentage point Becerra and Steyer gain comes precisely from Hilton and Other combined. Closed system. Conservation of votes. The formula doesn't create votes, it redistributes them.
The R² Values
The Results Were Remarkable
Becerra: R² = 0.99
Hilton: R² = 0.99
Steyer: R² = 0.99
Other: R² = 0.99
For context: 0.70 is considered strong in social science research. 0.85 gets researchers excited. 0.90 is extraordinarily rare in human behavioral data.
These numbers mean over 99% of each candidate's vote-share movement across five days and 2.5 million votes is explained by a single variable, total votes counted. Nothing else.
You get R² like that in physics experiments. In controlled laboratory conditions. Not in a statewide election. Not across dozens of counties and millions of diverse voters, over five days, through normal reporting irregularities.
The Slope Relationship
Becerra's slope ( 0.86) and Hilton's slope (−1.03) aren't identical, but their ratio is fixed and held for the entire five-day window.
Candidates in a statewide election don't move in mathematical opposition to each other at a fixed ratio across millions of ballots, county by county, day by day. Four variables in an equation do.
The Shutoff
The stopping condition appears to have been triggered on 6/9. The closure rate, which had been accelerating for five straight days, climbing from around 15,000 to nearly 95,000 votes a day, collapsed to under 4,000 the day Steyer conceded. Becerra, Hilton, and Steyer then all went flat at once. Weird, huh? 🙄
6
4
15
2,628
Jun 10
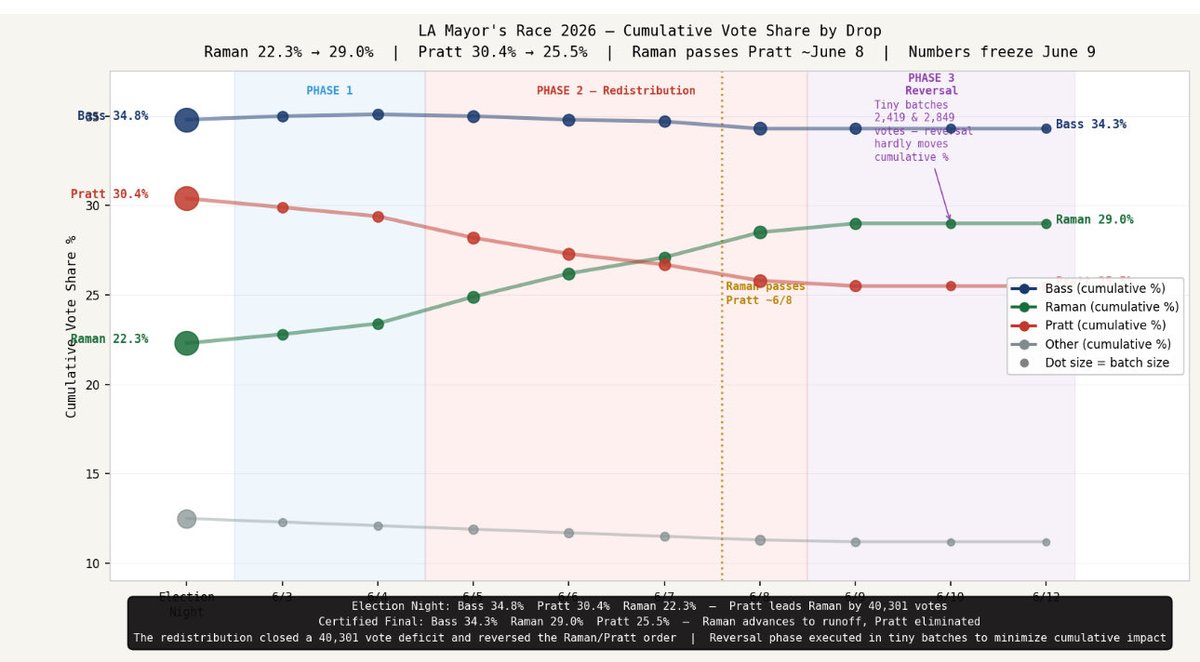
THE DESCENT - WHAT IT LOOKS LIKE
The formulas didn’t stop. It appears they reversed. Same constants. Same slope. Same structure. Just running the other direction.
Using R as the example, ascending it was:
R% = 27.87 (3.19 × drop number)
Descending it appears to be the same formula counting back down:
Drop 6: 27.87 (3.19 × 4)
Drop 7: 27.87 (3.19 × 3)
Drop 8: 27.87 (3.19 x 2)
Drop 9: 27.87 (3.19 x 1)
A formula that runs up and then reverses like a parabola is a mechanism with an objective. Its objective was achieved in Drop 5. Now it’s unwinding.
2
1
215
Jun 10
The data
Jun 10
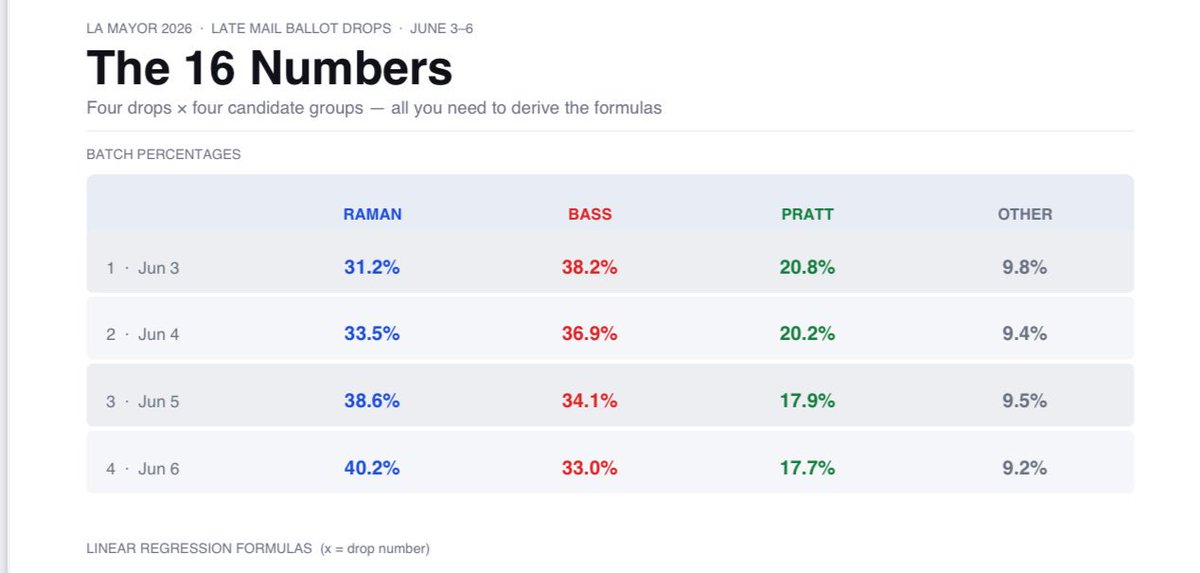
Here is the data people have been requesting.
I tracked four consecutive daily batch releases (June 3–6). Using each group’s share of each batch, I ran standard linear regression on the top three plus a combined category for the remaining 11.
The result: my previous post - linked below - four formulas, one per group, each predicting everyone of the first four releases to within 1%.
All of it derived from 16 numbers.
4
8
373
Jun 10
Here is the data people have been requesting.
I tracked four consecutive daily batch releases (June 3–6). Using each group’s share of each batch, I ran standard linear regression on the top three plus a combined category for the remaining 11.
The result: my previous post - linked below - four formulas, one per group, each predicting everyone of the first four releases to within 1%.
All of it derived from 16 numbers.
1
1
3
495
Jun 10
THE FORMULAS
WHAT THEY MEAN AND WHY THEY MATTER
I derived four deterministic linear formulas from the ballot drop data:
Raman% = 27.87 (3.19 × drop number)
Pratt% = 22.05 - (1.17 × drop number)
Bass% = 40.20 - (1.86 × drop number)
Other% = 9.88 - (0.16 × drop number)
The Starting Points
The constants - 27.87, 22.05, 40.20, 9.88 - represent each candidate’s baseline. Where they genuinely stood when post-election counting began. Real votes. Organic support. These are the numbers before anything unusual occurs.
The Slopes - How the Formula Runs
The slope is the increment applied to each candidate every single drop. It gets multiplied by drop number - 1, 2, 3, 4 - which means the effect escalates automatically with each drop.
So for Raman it isn’t just plus 3.19% every drop. It’s:
Drop 1: 27.87 (3.19 × 1) = 31.06%
Drop 2: 27.87 (3.19 × 2) = 34.25%
Drop 3: 27.87 (3.19 × 3) = 37.44%
Drop 4: 27.87 (3.19 × 4) = 40.63%
Drop 5 predicted: 27.87 (3.19 × 5) = 43.82%
Each drop pushes her further from her baseline. It is built in. Automatic by design.
The slopes also sum to exactly zero.
3.19 - 1.17 - 1.86 - 0.16 = 0.00
Every percentage point Raman gains comes precisely from the other three candidates/groups combined. This is a closed system. Conservation of votes. The formula doesn’t create votes - it redistributes them.
The R Values - The results were remarkable
To validate these formulas I ran linear regression analysis. The Pearson correlation coefficients, R values, came back as follows:
Raman vs Pratt: R = 0.9966
Raman vs Bass: R = 0.9934
Raman vs Batch: R = 0.9984
Raman vs Other: R = 0.9794
R values measure how perfectly data fits a straight line. They run from 0 to 1.
0 means completely random.
No pattern whatsoever.
1 means a perfect straight line.
Every point exactly where predicted.
For context:
0.70 is considered strong in social science research.
0.85 gets researchers excited.
0.90 is extraordinarily rare in human behavioral data.
Squaring them to get R² values:
Raman vs Pratt: R² = 0.9932
Raman vs Bass: R² = 0.9869
Raman vs Other: R² = 0.9592
Raman vs Batch: R² = 0.9968
That last number, 0.9968, means that 99.68% of Raman’s vote share movement across these drops is explained by a single variable. Drop number. Nothing else. Just counting to five.
You get R values like that in physics experiments. In controlled laboratory conditions. Measuring the expansion of metal under heat. Not in elections. Not in a major American city with millions of diverse voters casting ballots across weeks.
The Slope Relationship
The slope of 3.110 between Raman and Pratt is particularly significant.
It means for every percentage point Pratt lost Raman gained 3.110 points. Every drop. Without variation. Without noise.
Candidates in a democratic election don’t move in mathematical opposition to each other at a fixed ratio across 200,000 ballots. Four variables in an equation do.
Why The Shutoff Had To Exist
Because drop number keeps increasing, the formula keeps pushing percentages further from baseline. Left unchecked by drop 7 the math produces:
Raman: 27.87 (3.19 × 7) = 50.2%
Pratt: 22.05 - (1.17 × 7) = 13.9%
Bass: 40.20 - (1.86 × 7) = 27.2%
So the formula was never intended to run to completion. It was designed to run until a specific objective was achieved, Raman leading Pratt by a sufficient margin to secure the runoff and then stop.
The stopping condition appears to have been triggered at approximately 38,000 votes into drop 5. The precise moment Raman crossed 3,000 votes ahead of Pratt.
After that point the remaining 9,800 votes in drop 5 distributed at approximately the baseline that existed after drop four.
The formula completed its task. Then it stopped. And the numbers went back to looking normal.
2
116
Truth Is Freedom retweeted
THE FORMULAS
WHAT THEY MEAN AND WHY THEY MATTER
I derived four deterministic linear formulas from the ballot drop data:
Raman% = 27.87 (3.19 × drop number)
Pratt% = 22.05 - (1.17 × drop number)
Bass% = 40.20 - (1.86 × drop number)
Other% = 9.88 - (0.16 × drop number)
The Starting Points
The constants - 27.87, 22.05, 40.20, 9.88 - represent each candidate’s baseline. Where they genuinely stood when post-election counting began. Real votes. Organic support. These are the numbers before anything unusual occurs.
The Slopes - How the Formula Runs
The slope is the increment applied to each candidate every single drop. It gets multiplied by drop number - 1, 2, 3, 4 - which means the effect escalates automatically with each drop.
So for Raman it isn’t just plus 3.19% every drop. It’s:
Drop 1: 27.87 (3.19 × 1) = 31.06%
Drop 2: 27.87 (3.19 × 2) = 34.25%
Drop 3: 27.87 (3.19 × 3) = 37.44%
Drop 4: 27.87 (3.19 × 4) = 40.63%
Drop 5 predicted: 27.87 (3.19 × 5) = 43.82%
Each drop pushes her further from her baseline. It is built in. Automatic by design.
The slopes also sum to exactly zero.
3.19 - 1.17 - 1.86 - 0.16 = 0.00
Every percentage point Raman gains comes precisely from the other three candidates/groups combined. This is a closed system. Conservation of votes. The formula doesn’t create votes - it redistributes them.
The R Values - The results were remarkable
To validate these formulas I ran linear regression analysis. The Pearson correlation coefficients, R values, came back as follows:
Raman vs Pratt: R = 0.9966
Raman vs Bass: R = 0.9934
Raman vs Batch: R = 0.9984
Raman vs Other: R = 0.9794
R values measure how perfectly data fits a straight line. They run from 0 to 1.
0 means completely random.
No pattern whatsoever.
1 means a perfect straight line.
Every point exactly where predicted.
For context:
0.70 is considered strong in social science research.
0.85 gets researchers excited.
0.90 is extraordinarily rare in human behavioral data.
Squaring them to get R² values:
Raman vs Pratt: R² = 0.9932
Raman vs Bass: R² = 0.9869
Raman vs Other: R² = 0.9592
Raman vs Batch: R² = 0.9968
That last number, 0.9968, means that 99.68% of Raman’s vote share movement across these drops is explained by a single variable. Drop number. Nothing else. Just counting to five.
You get R values like that in physics experiments. In controlled laboratory conditions. Measuring the expansion of metal under heat. Not in elections. Not in a major American city with millions of diverse voters casting ballots across weeks.
The Slope Relationship
The slope of 3.110 between Raman and Pratt is particularly significant.
It means for every percentage point Pratt lost Raman gained 3.110 points. Every drop. Without variation. Without noise.
Candidates in a democratic election don’t move in mathematical opposition to each other at a fixed ratio across 200,000 ballots. Four variables in an equation do.
Why The Shutoff Had To Exist
Because drop number keeps increasing, the formula keeps pushing percentages further from baseline. Left unchecked by drop 7 the math produces:
Raman: 27.87 (3.19 × 7) = 50.2%
Pratt: 22.05 - (1.17 × 7) = 13.9%
Bass: 40.20 - (1.86 × 7) = 27.2%
So the formula was never intended to run to completion. It was designed to run until a specific objective was achieved, Raman leading Pratt by a sufficient margin to secure the runoff and then stop.
The stopping condition appears to have been triggered at approximately 38,000 votes into drop 5. The precise moment Raman crossed 3,000 votes ahead of Pratt.
After that point the remaining 9,800 votes in drop 5 distributed at approximately the baseline that existed after drop four.
The formula completed its task. Then it stopped. And the numbers went back to looking normal.
85
327
981
48,351
California’s new voting method: twelve rulers and a pair of scissors.
1
7
586
The people counting the votes are the same people who run the agencies that regulate the people who own the media and try to curate the narrative.
The people who try to dictate what we can say and read are the same people counting the votes.
It’s one machine. It was always one machine. They just forgot to hide it this time because they didn’t think they’d have to.
They seem to have forgotten that Elon bought Twitter.
1
3
14
179
Correction to the above: I incorrectly described the formula intercepts - 27.87, 22.05, 40.20, 9.88 - as where candidates organically stood when counting began. That was wrong. Those are mathematical artifacts produced by the regression algorithm.
13
8
57
2,279