
Joined July 2023
- Tweets 10,431
- Following 253
- Followers 26,994
- Likes 9,351
7,266 Photos and videos


15h
$BTC
Good morning!
Bitcoin pumped because a peace agreement between the USA and Iran was announced.
However, this doesn't change anything for Bitcoin when we look at the big picture.
The dump from 73k to 61k was so fast and powerful that I believe a V-shaped recovery is very unlikely here.
Instead, we'll probably get back into some kind of range in the upcoming days.
Still waiting to see how this whole thing is going to play out
20
15
78
9,882
Jun 14
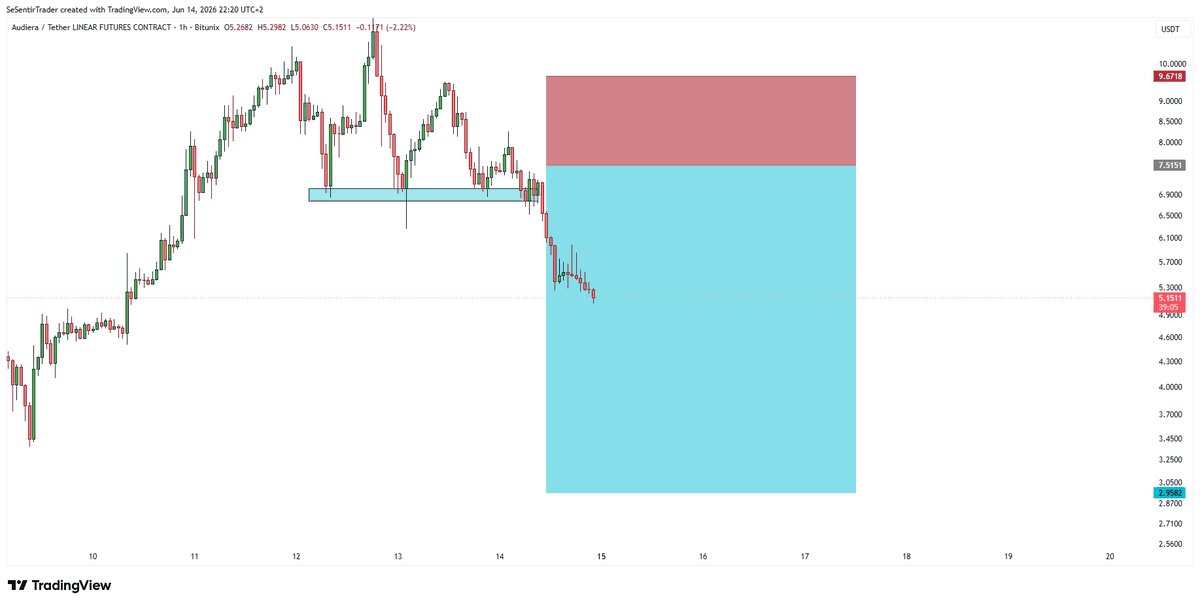
$BEAT dumped as I expected ✅
Unfortunately, my limit sell didn't get filled.
Next time, I'll short without waiting.
Lesson learned.
I'm staying focused on trading opportunities that are actually worth it.
Jun 14

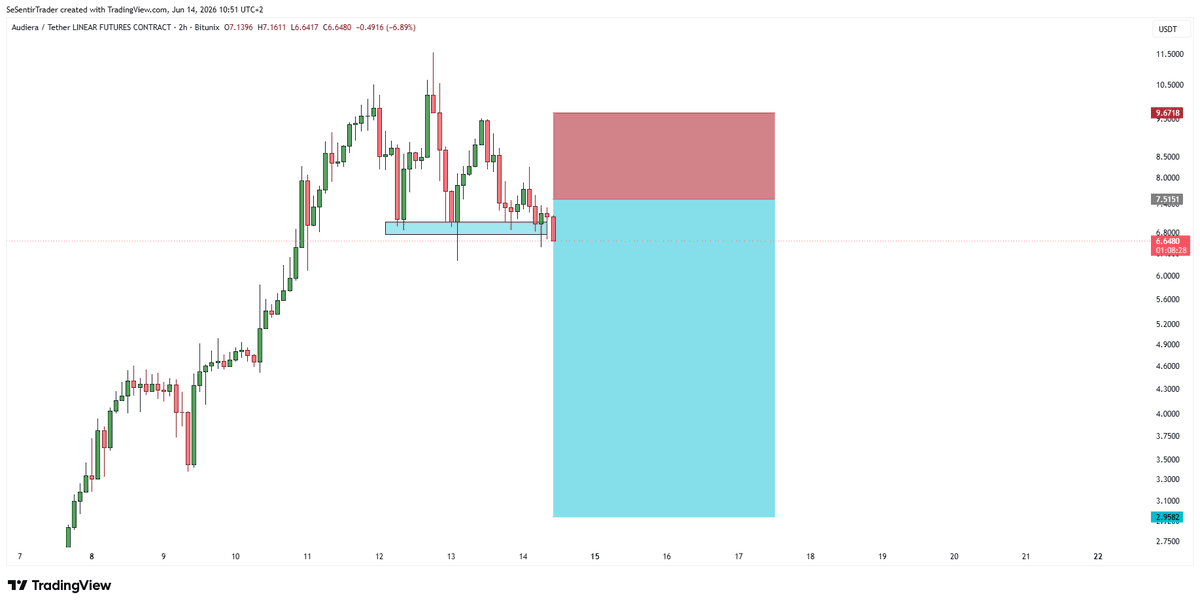
🟥🟥 BEAT LIMIT SHORT TRADE 🟥🟥
ENTRY: 7.515
STOP LOSS: 9.67
TAKE PROFIT: 2.95
I'm planning a limit short on $BEAT at 7.51$
This is a perfect Wyckoff distribution pattern after a strong pump from 1 to 10$.
I'm risking 1 000$ on this trade with a 3 500$ position.
I hope I get filled.
8
5
20
3,841
Jun 14
🟥🟥 BEAT LIMIT SHORT TRADE 🟥🟥
ENTRY: 7.515
STOP LOSS: 9.67
TAKE PROFIT: 2.95
I'm planning a limit short on $BEAT at 7.51$
This is a perfect Wyckoff distribution pattern after a strong pump from 1 to 10$.
I'm risking 1 000$ on this trade with a 3 500$ position.
I hope I get filled.
11
10
34
8,095
Jun 13
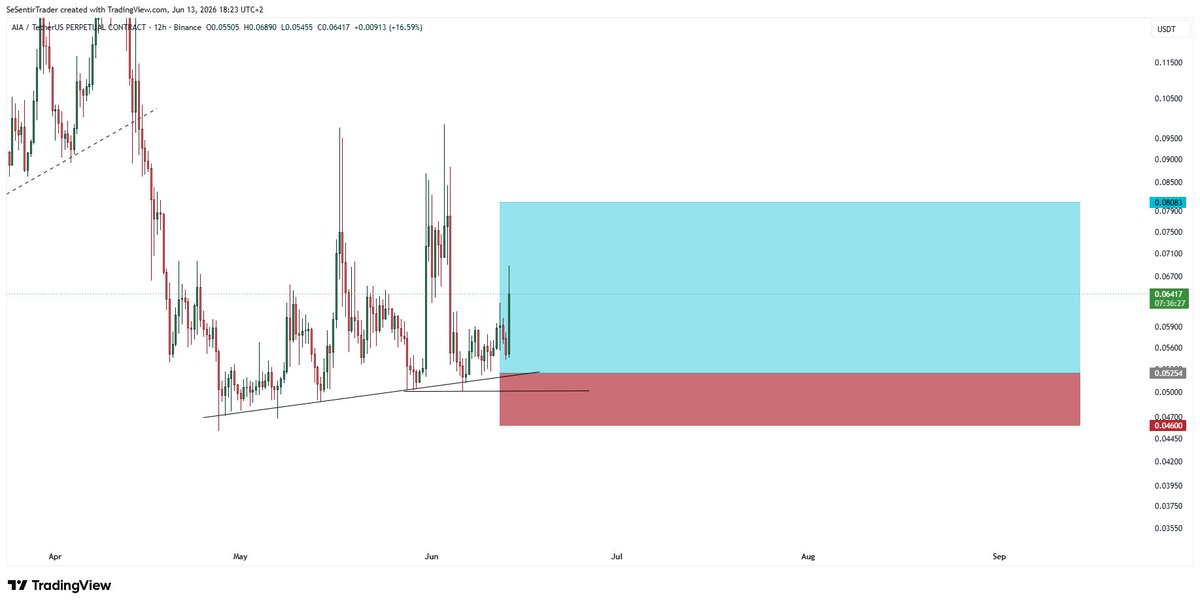
$AIA took off.
Cancelling this limit buy. Didn't get filled.
Jun 11
🟩🟩 AIA LIMIT LONG TRADE 🟩🟩
ENTRY: 0.0525
STOP-LOSS: 0.046
TAKE PROFITS: 0.0808
Leverage: 8X
$AIA is once again in a bottoming cleanly, even more cleanly than in March.
Placing a limit long trade at the lows (0.0525).
Risking 1000$ on this trade.
3
5
25
5,338
Jun 13
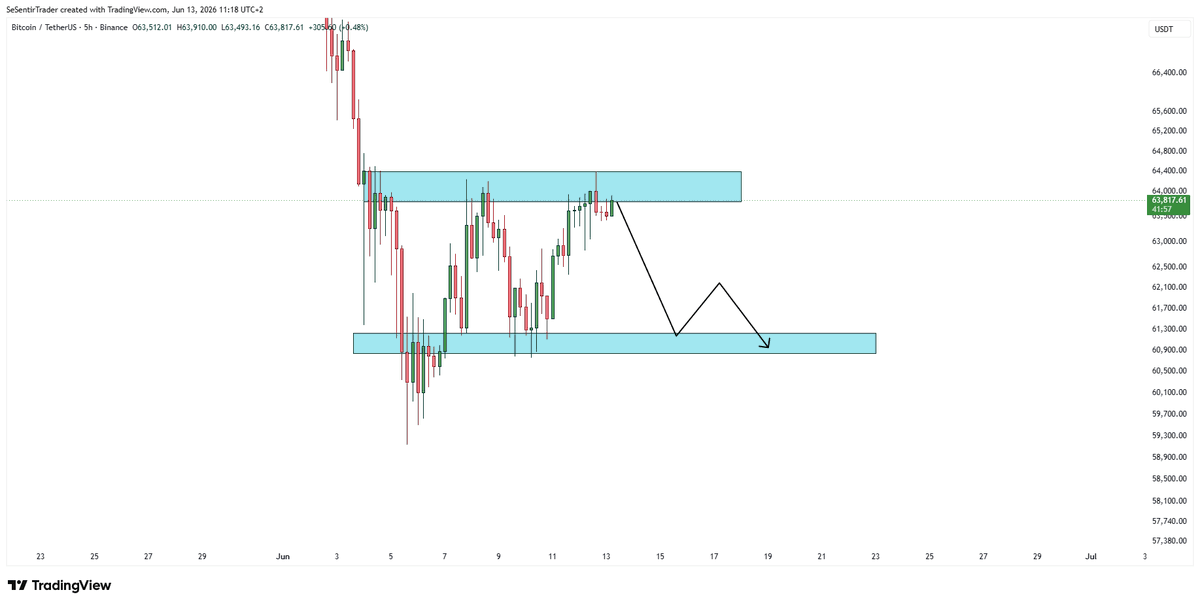
$BTC
It's weekend.
The market is moving slowly and Bitcoin hasn't moved in the last 24 hours.
Still expecting a dump from this level sooner or later as price usually tends to range following a major crash.
Remaining patient until we get something to work with.
23
10
93
8,055
Jun 11
$BTC
We're now in a good old range. Finally something is happening here.
This is a logical reaction because the market seems undecided after this hard dump.
I am still waiting a bit more, Bitcoin isn't fully ready yet for a long or short set-up.
However, we can already watch how price behaves between 61k and 64k, see if there is any weakness and prepare for a potential short.
As I said before, bulls are less likely to make a comeback here because of the overall trend, the fact that ETH made a new low and the 4-year cycle.
13
8
68
8,297
Jun 11
🟩🟩 AIA LIMIT LONG TRADE 🟩🟩
ENTRY: 0.0525
STOP-LOSS: 0.046
TAKE PROFITS: 0.0808
Leverage: 8X
$AIA is once again in a bottoming cleanly, even more cleanly than in March.
Placing a limit long trade at the lows (0.0525).
Risking 1000$ on this trade.
8
7
31
9,053
Jun 11
$BTC
Good morning
We're beginning to form some kind of range on lower timeframes.
I expect Bitcoin to get squeezed more and more in the next few days until it finally breaks down and retests the lows.
It is still too early to short but the time will come sooner or later.
24
10
75
6,489
Jun 10
$BTC
As I expected, we started dumping ✅
I expect Bitcoin to form some kind of bearish continuation pattern over the next few days.
This blue support level around 59 500$ is where Bitcoin is most likely to bounce.
If we get a weak bounce from that level, this will be another argument in favour of a bearish continuation.
Don't FOMO, don't jump into anything and start preparing your short for when the time will come.
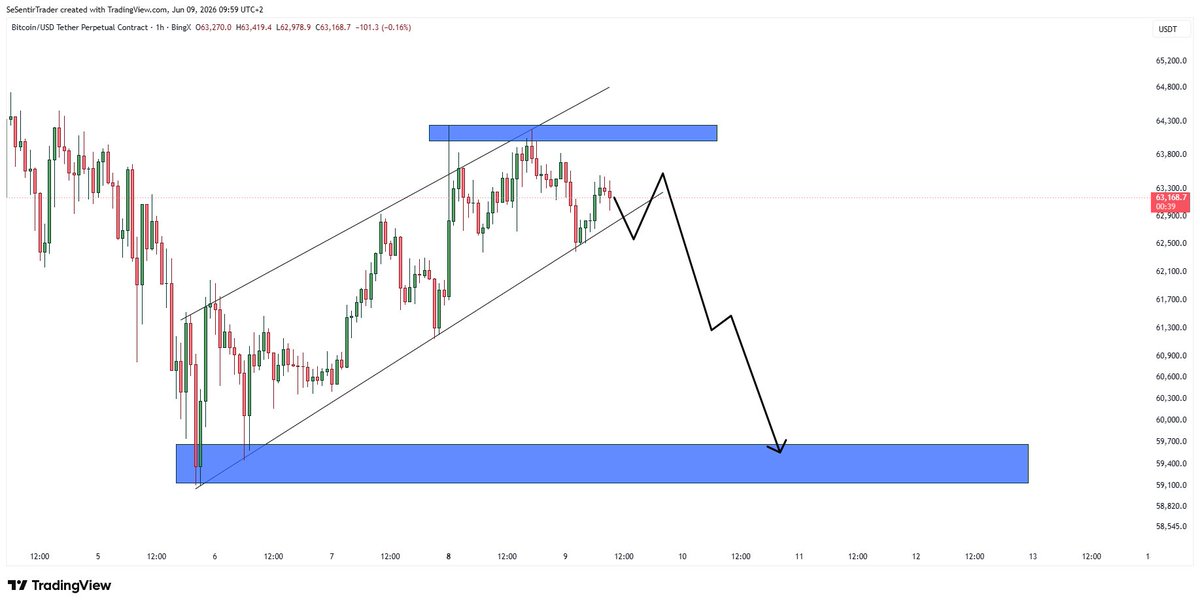
Jun 9
$BTC
Good morning everyone
On lower timeframes, Bitcoin is starting to stall a little.
We remain in an uptrend, but so far no strong bounce around our support level.
Price often ranges after a crash, so it would only be natural for Bitcoin to retest the lows at 60k.
Not jumping into any trade, just waiting for Bitcoin to show me a clear pattern of what's happening.
23
12
91
12,544
Jun 9
$BTC
Good morning everyone
On lower timeframes, Bitcoin is starting to stall a little.
We remain in an uptrend, but so far no strong bounce around our support level.
Price often ranges after a crash, so it would only be natural for Bitcoin to retest the lows at 60k.
Not jumping into any trade, just waiting for Bitcoin to show me a clear pattern of what's happening.
22
16
86
21,439
Jun 8
$BTC
Daily chart
At the beginning of the month, Bitcoin crashed in a straight line, hitting a key local bottom at 60k for the first time since February.
Then, we bounced strongly and had a daily close above 63k.
This is a logical relief rally, as we mostly dumped in a straight line since 73 000$.
However, this doesn't mean Bitcoin bulls are fully back. In fact, the whole structure remains bearish because of this major crash that violently sent Bitcoin back to the lows.
Looking at the bigger picture, I don't really see how this whole structure can hold 60k for weeks.
Plus, we remain in a bear market as part of the 4-year cycle so it also adds up to my bearish bias.
21
11
59
6,633
Jun 8
$BTC
64 000$ finally hit. ✅
No need to rush, as markets take a bit of time to move.
Obviously Bitcoin is in a precarious situation as it smashed right into the lows on the weekly timeframe.
The best scenario would be a range in the next few days, with Bitcoin slowly weakening before finally hitting a new low.
I'm looking forward to a bearish continuation pattern here.
Jun 6
$BTC
Pretty interesting pattern.
We're slowly crashing while recoveries are very weak.
Bears keep pushing the price down but are facing resistance.
This is pretty typical of short squeeze patterns. It is more obvious on some alts than Bitcoin, but I believe we'll have a quick and straight recovery to 64k once bears are out of steam.
24
11
102
21,113
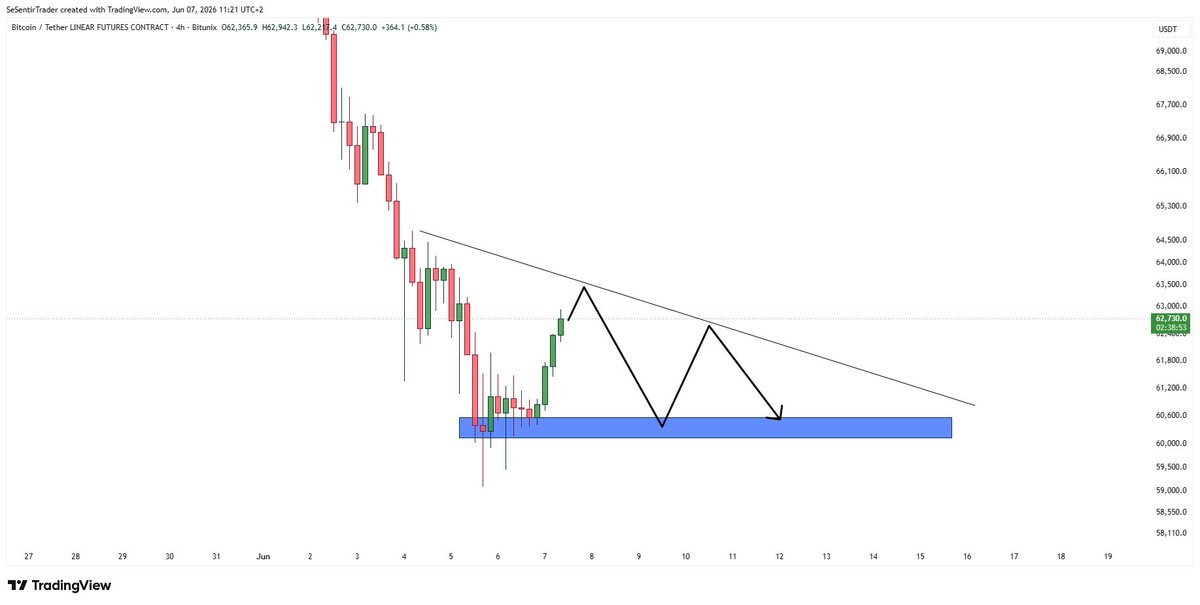
Jun 7
$BTC
As I expected, we had that recovery ✅
I don't believe we'll push to 67k, 64k is already a generous target.
We remain in a downtrend, many sell orders are already stacked, being long now would amount to FOMO.
Hopefully we start ranging a little from now on within this 60-64k area and prepare for the next big move.
Do not long now and expect a V-shaped recovery to 67k. This is a noob mistake and Bitcoin never made such recoveries after slowly bottoming out like this.
Jun 6
$BTC
Pretty interesting pattern.
We're slowly crashing while recoveries are very weak.
Bears keep pushing the price down but are facing resistance.
This is pretty typical of short squeeze patterns. It is more obvious on some alts than Bitcoin, but I believe we'll have a quick and straight recovery to 64k once bears are out of steam.
14
14
104
19,640
Jun 6
$BTC
Pretty interesting pattern.
We're slowly crashing while recoveries are very weak.
Bears keep pushing the price down but are facing resistance.
This is pretty typical of short squeeze patterns. It is more obvious on some alts than Bitcoin, but I believe we'll have a quick and straight recovery to 64k once bears are out of steam.
19
18
70
47,452
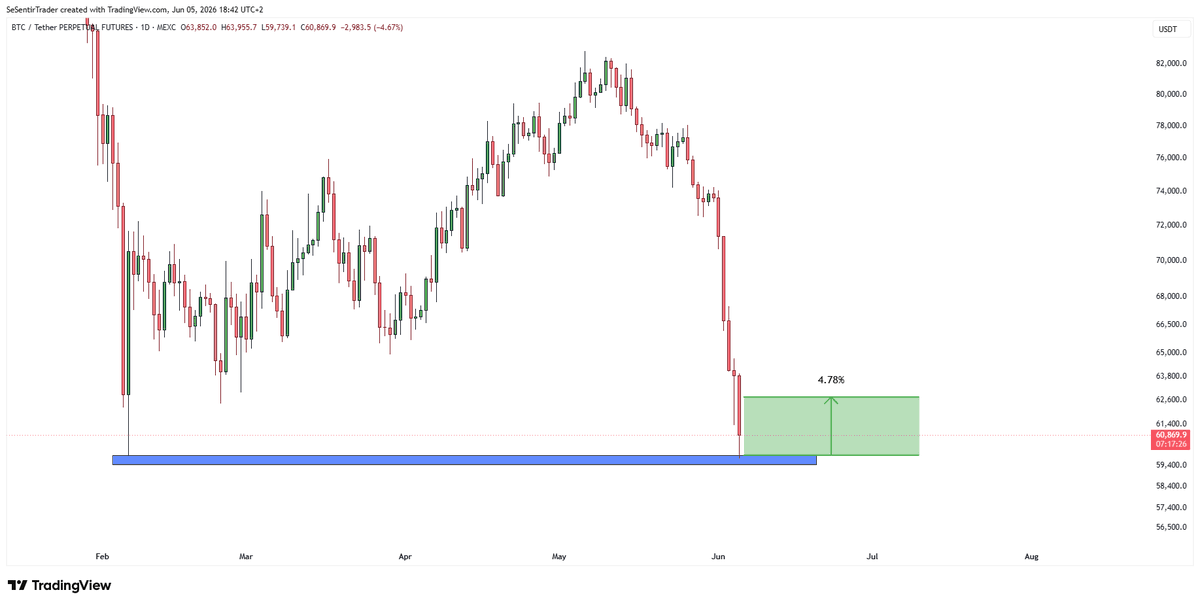
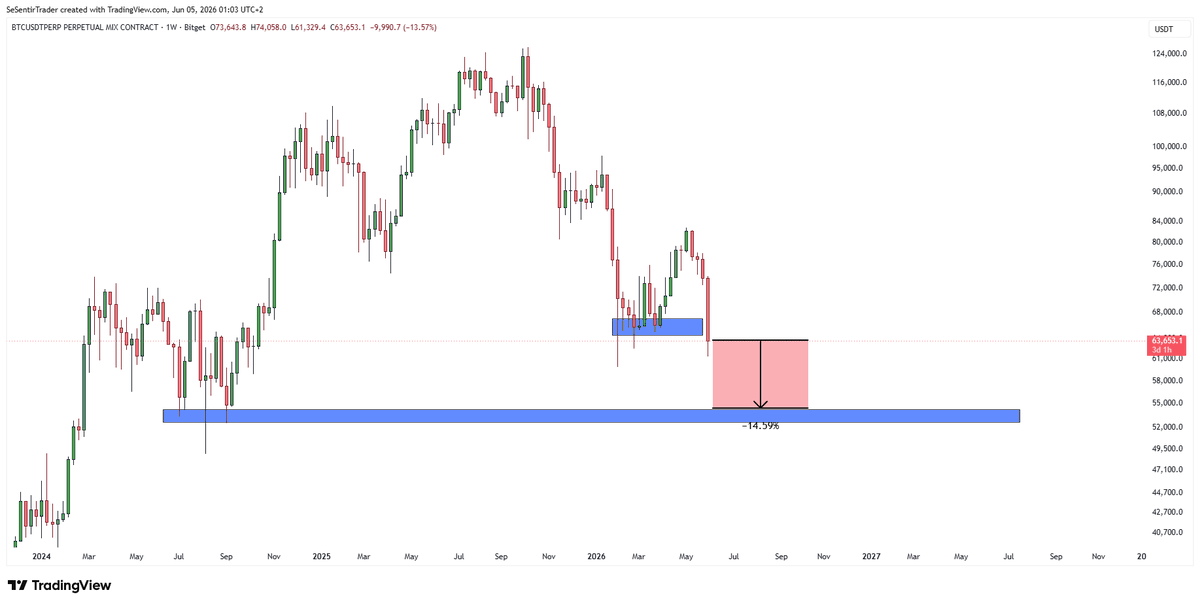
Jun 5
$BTC
This is the last area where Bitcoin can bounce before closing below this February low.
Last chance for Bitcoin to have a small relief rally before the downward move can resume.
Usually price doesn't crash that hard so quickly, it happens with small bounces and buyers giving the price some support.
We already have a -14% weekly candle. A continued crash before next week would make this candle historically bearish.
I hope I'm right and we get some kind of clean structure forming on lower timeframes. Because entering a short now looks scary and suicidal.
9
10
49
5,435
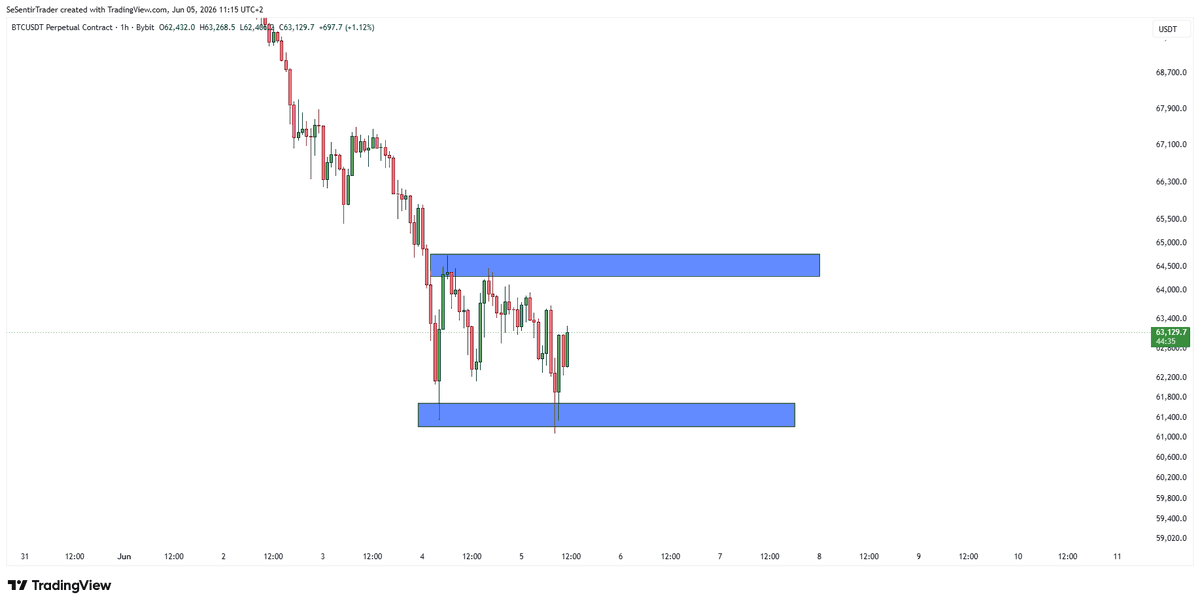
Jun 5
$BTC
We're having the first signs of a pattern forming on lower timeframes.
This will allow shorters to get some safer entries for the impending dump everyone is waiting for.
Not positioning myself just now, waiting for the market to give more clues.
11
8
41
3,626
Jun 4
$BTC
The weekly candle is really giving bearish vibes.
We retest a previous support level with a sharp red candle, smashing right into liquidity.
During the bull market, we used to smash into resistance with strong impulses.
Now it's the exact opposite.
Currently, volatility is very high, which confirms something big is indeed happening with Bitcoin.
The move is surely not over. The next weekly candle can send us to 54k.
10
6
40
5,702
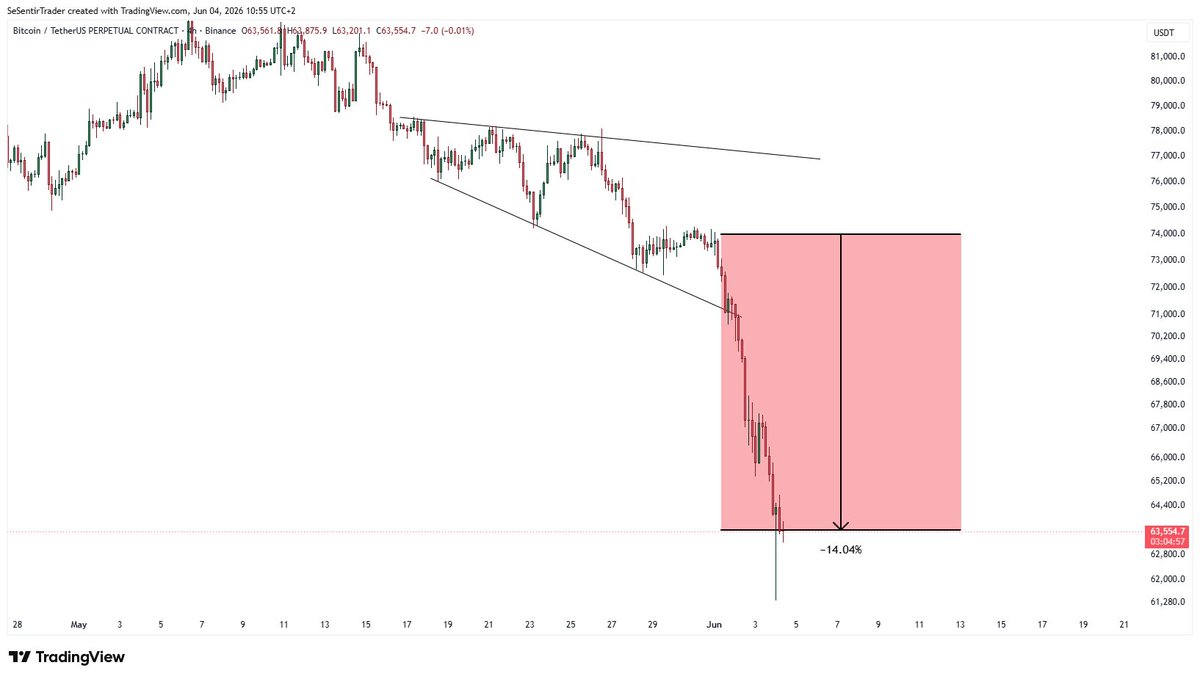
Jun 4
$BTC
-14% ✅
A few days ago I warned you about this expanding wedge pattern on Bitcoin and what it could mean in the next few days.
At 74 000$ it was very clear to me that Bitcoin was weak and that a hard crash was only a matter of time.
When trading Bitcoin, most profits are made during big moves, not when the market is ranging.
This crash looked pretty wild, but I don't think it's over.
We're likely to range a few more days before preparing the next wave that sends us below 60k for a while.
By the way, as I said a few times, this bear market is very likely to end by October 2026 as per the 4-year cycle theory, so we have 4 months ahead of us.
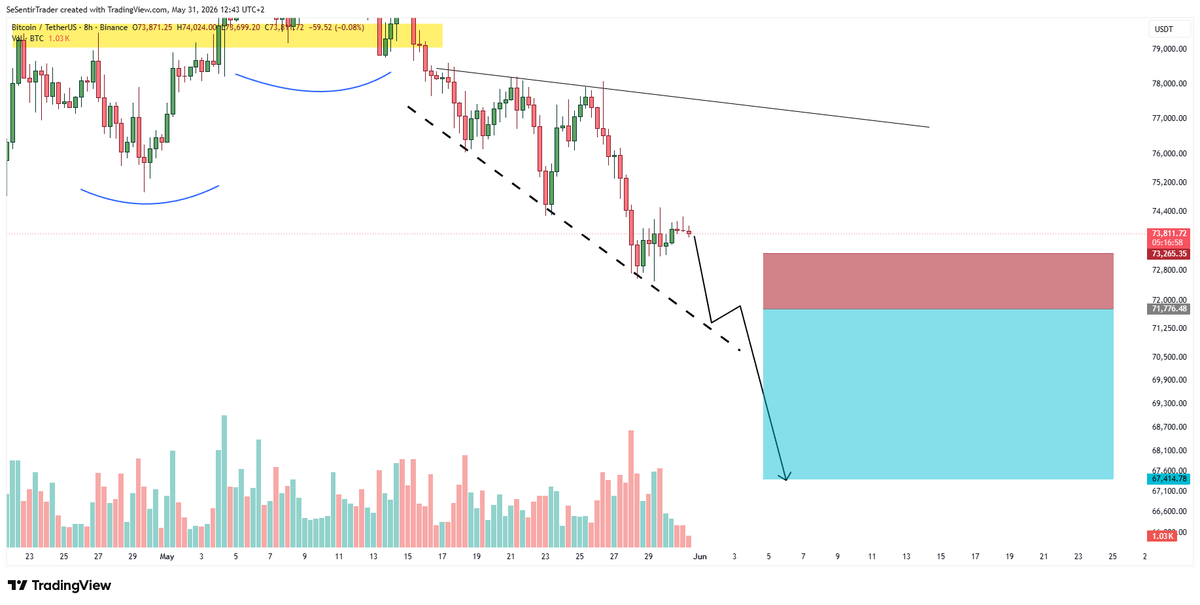
May 31
$BTC
My trading plan
As I said before, Bitcoin is currently in an expanding wedge. Bulls are unable to push the price back to the highs and it signals weakness.
Expecting price to drop again to the next support level (dashed line), make an even weaker bounce before crashing again.
I will be shorting when I see that weak bounce around 71.5k.
We haven't crashed in a straight line yet, but this is soon going to happen.
6
8
29
5,214
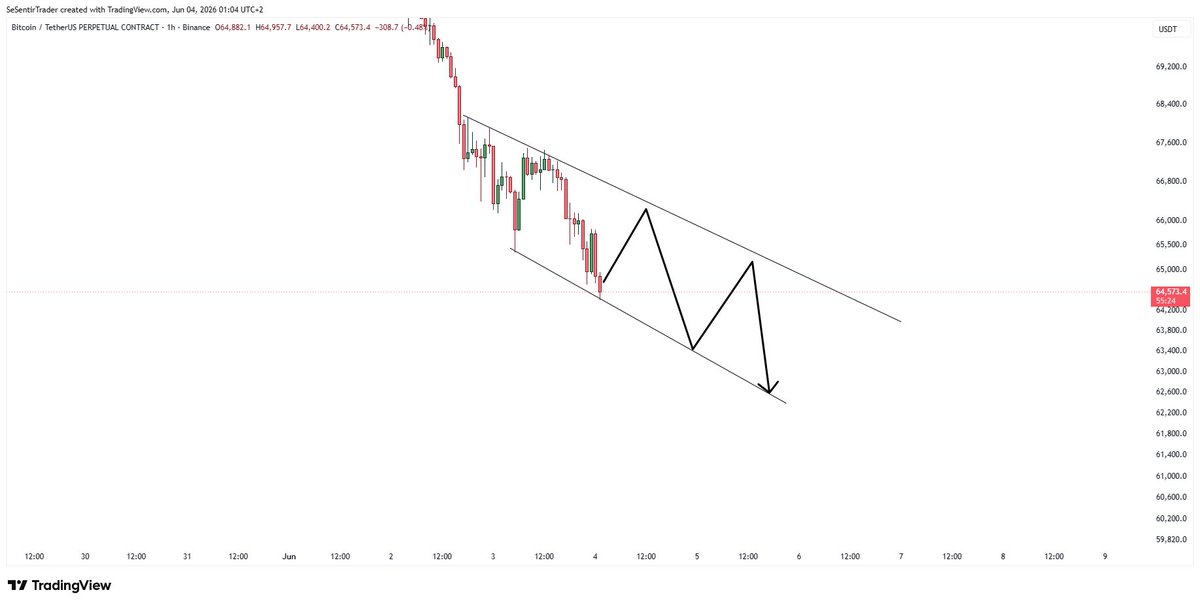
Jun 3
$BTC
WHAT'S NEXT?!
The market is still reeling from the latest crash.
That means an option now could be a downward-trending range until the next big move.
Really too close to call right now.
My guess for Bitcoin would be a range forming somehow on the 4-hour timeframe.
10
16
53
6,280