
Joined March 2026
- Tweets 70
- Following 22
- Followers 11,541
- Likes 68
18 Photos and videos


Pinned Tweet

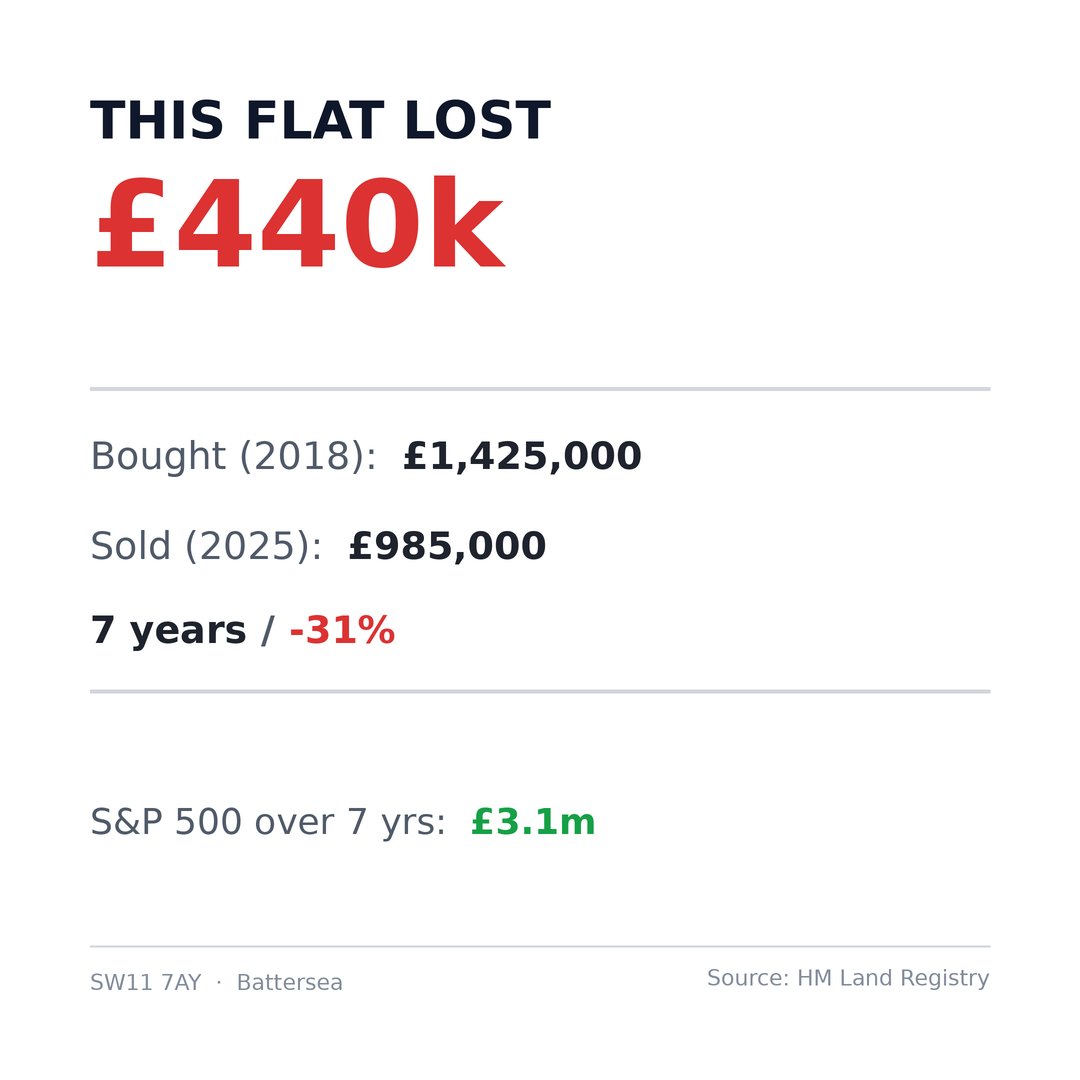
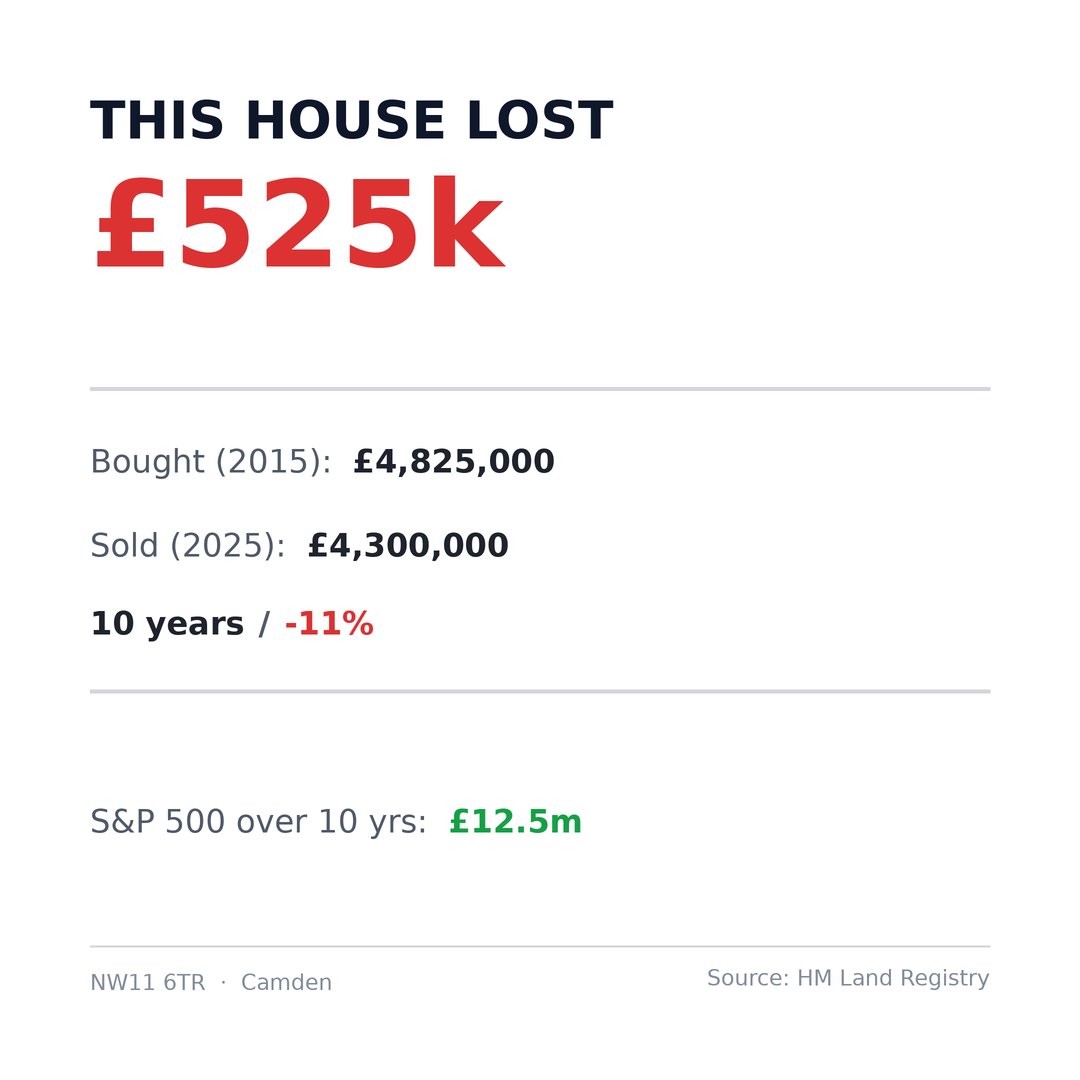
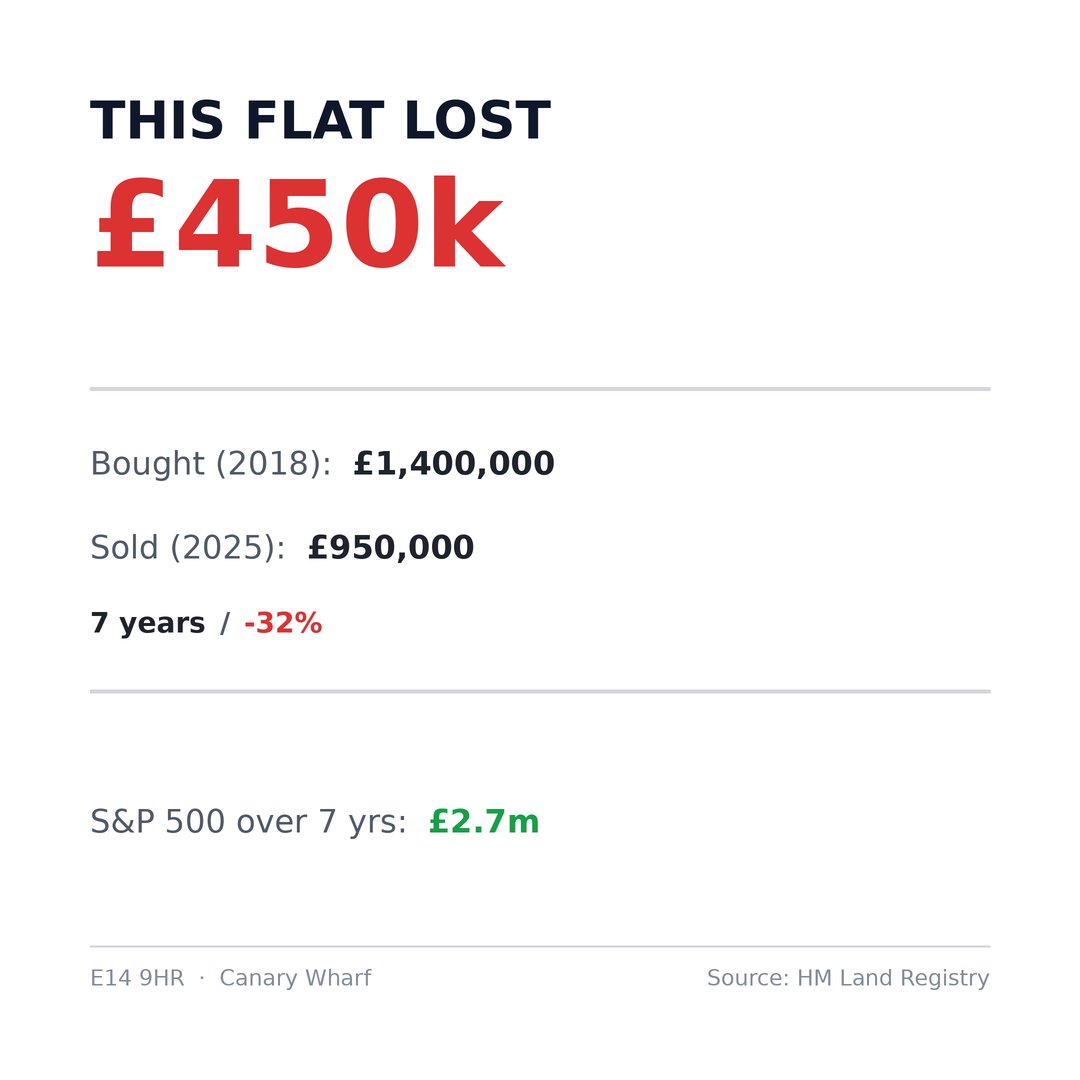
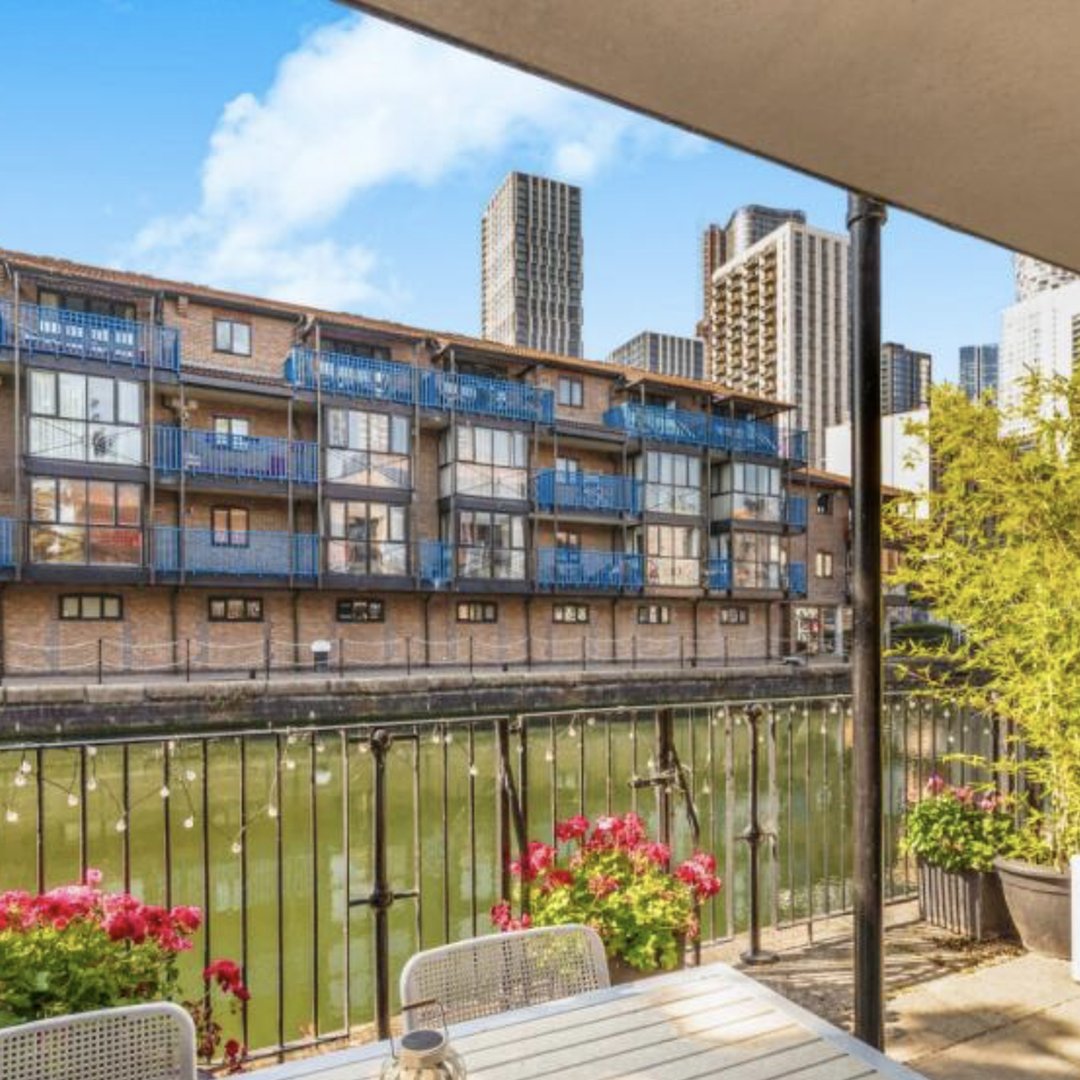
Pan Peninsula. 40th floor. Canary Wharf views.
Bought for £1.4m in 2018.
Sold for £950k in 2025.
£450,000 gone in 7 years.
The S&P 500 would've turned that £1.4m into £2.7m.
Would you still buy in Canary Wharf?

56
107
957
759,202
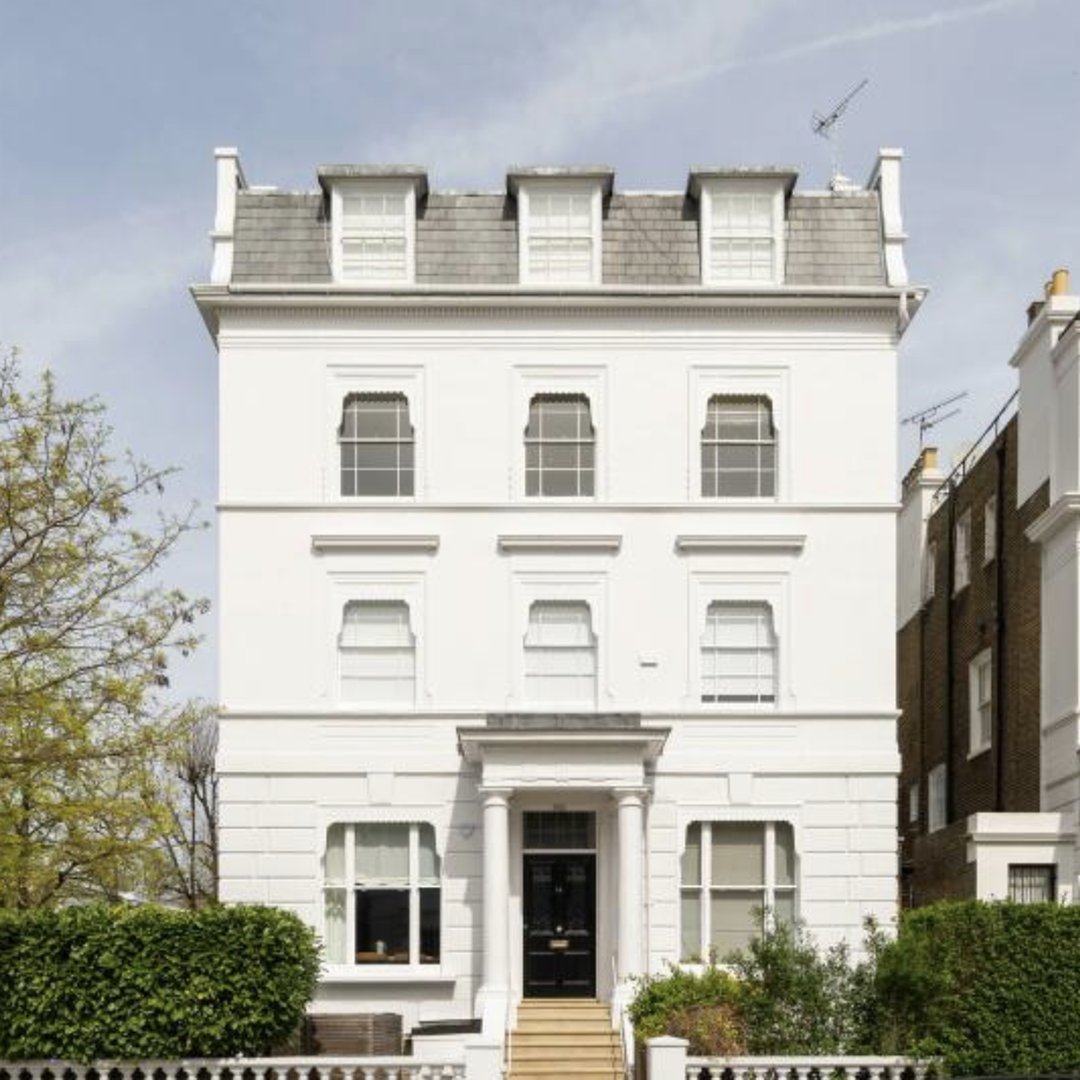
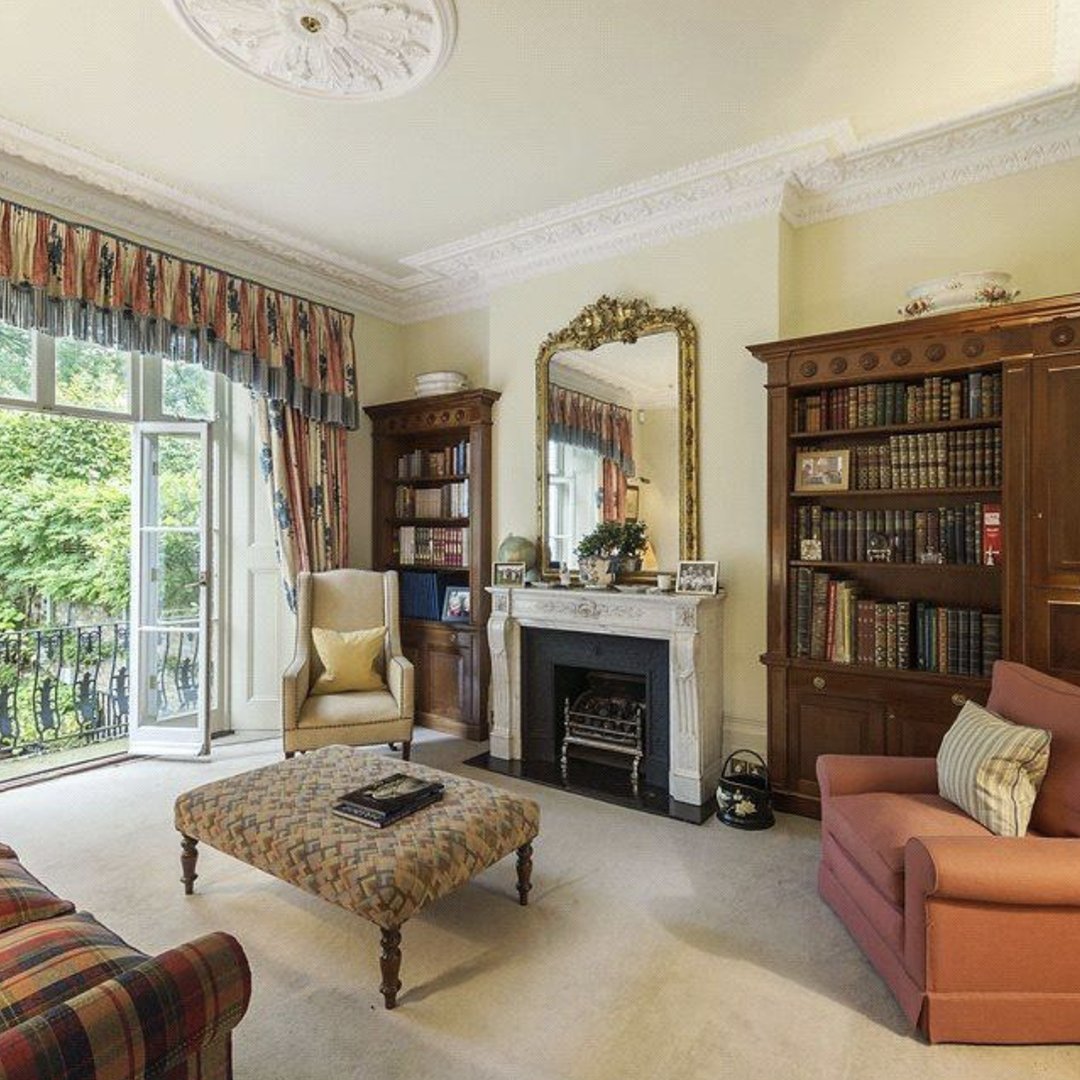
Dawson Place, Notting Hill
Bought in 2010: £10,500,000
Sold in 2025: £21,788,318
One of the largest residential sales in the UK in 2025. An £11.3m gain (108% return) in 15 years. Detached freehold in W2.
9
2
63
10,538
We can't find John & Margaret's home on HM Land Registry, but sounds like it appreciated in value by 5,257% over the past 44 years 😂
Apr 5

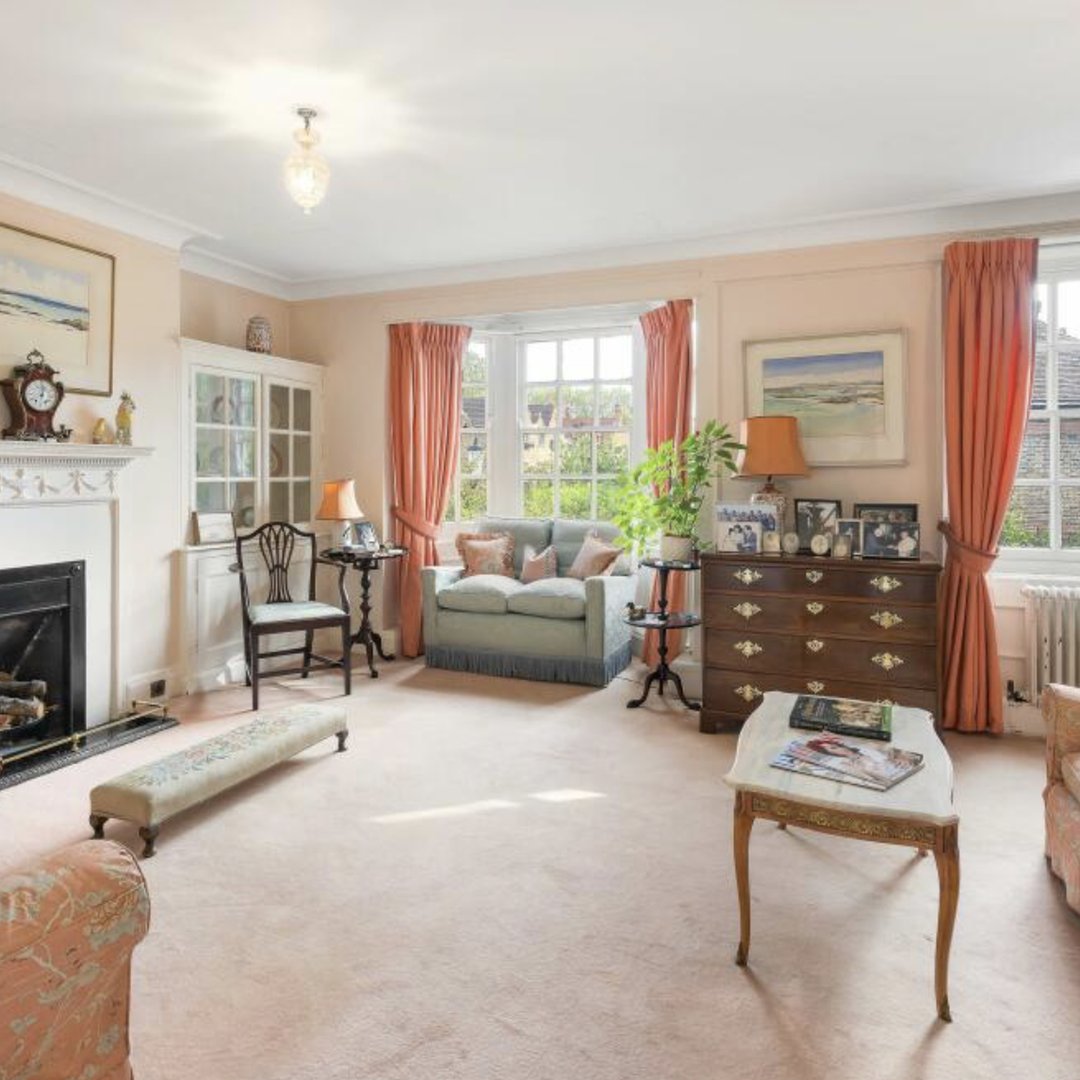
Our little home. Bought in 1982 for £28,000. Just a modest family home in Surrey with a bit of a garden. I remember picking up extra shifts at the post office that summer to save for the deposit. We were so young. Apparently it's worth £1.5 million now but to us it's just home. 🏡
26
2
196
58,910
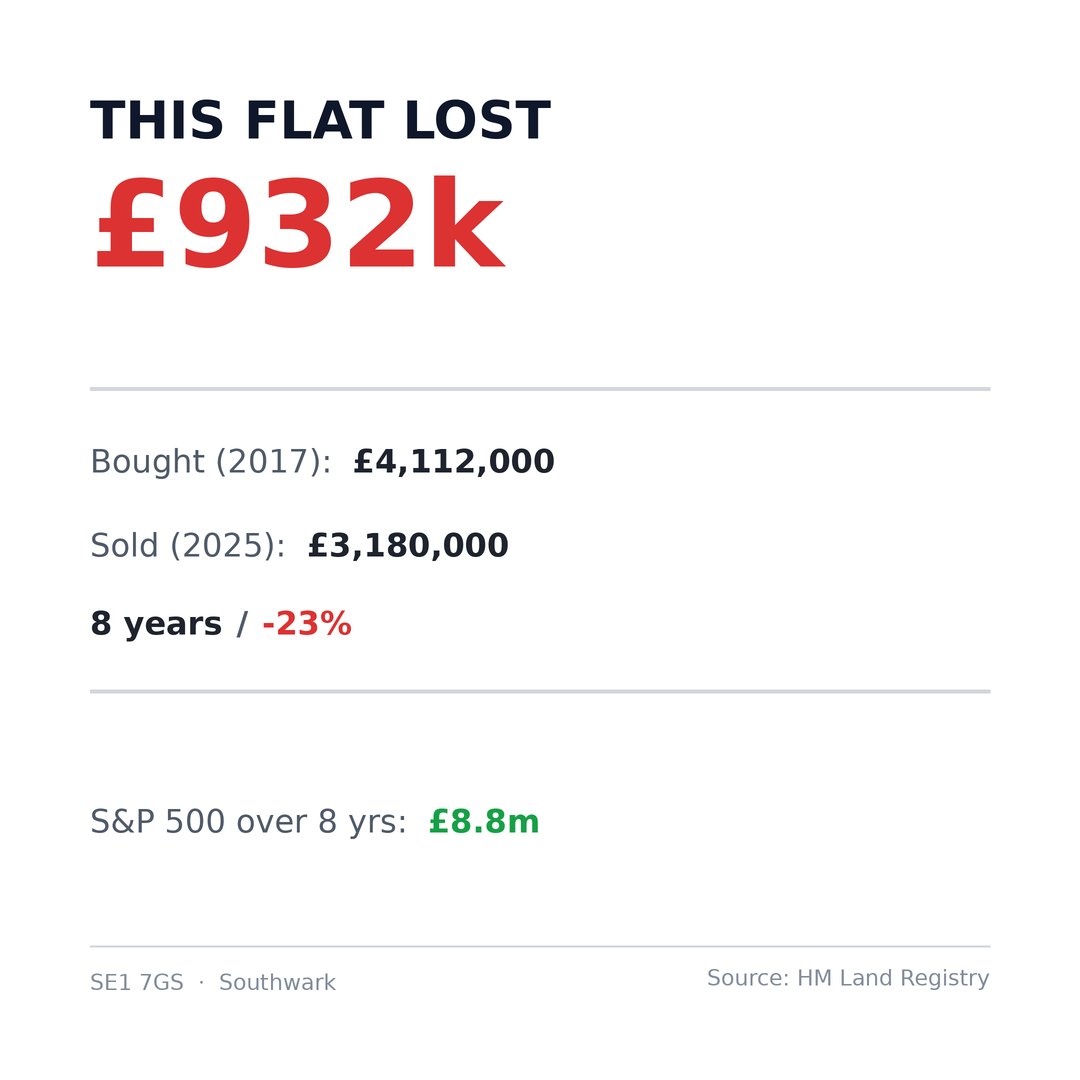
Since 2023, 48,577 properties in England & Wales sold for less than their previous purchase price, wiping out a combined £2 billion.
Over the same period, 765,211 properties sold for a profit. They gained a combined £111 billion.
Source: HM Land Registry
5
2
42
5,934
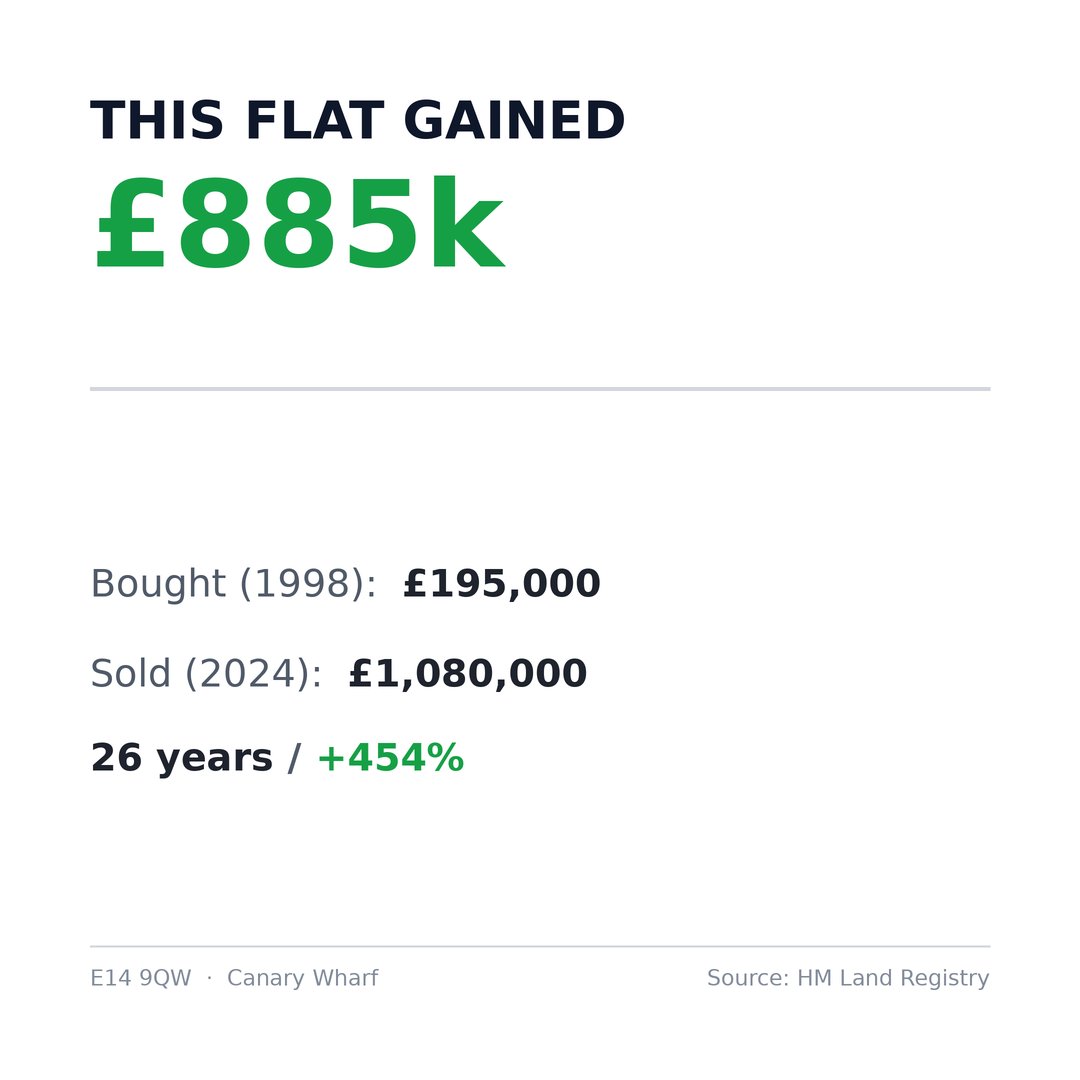
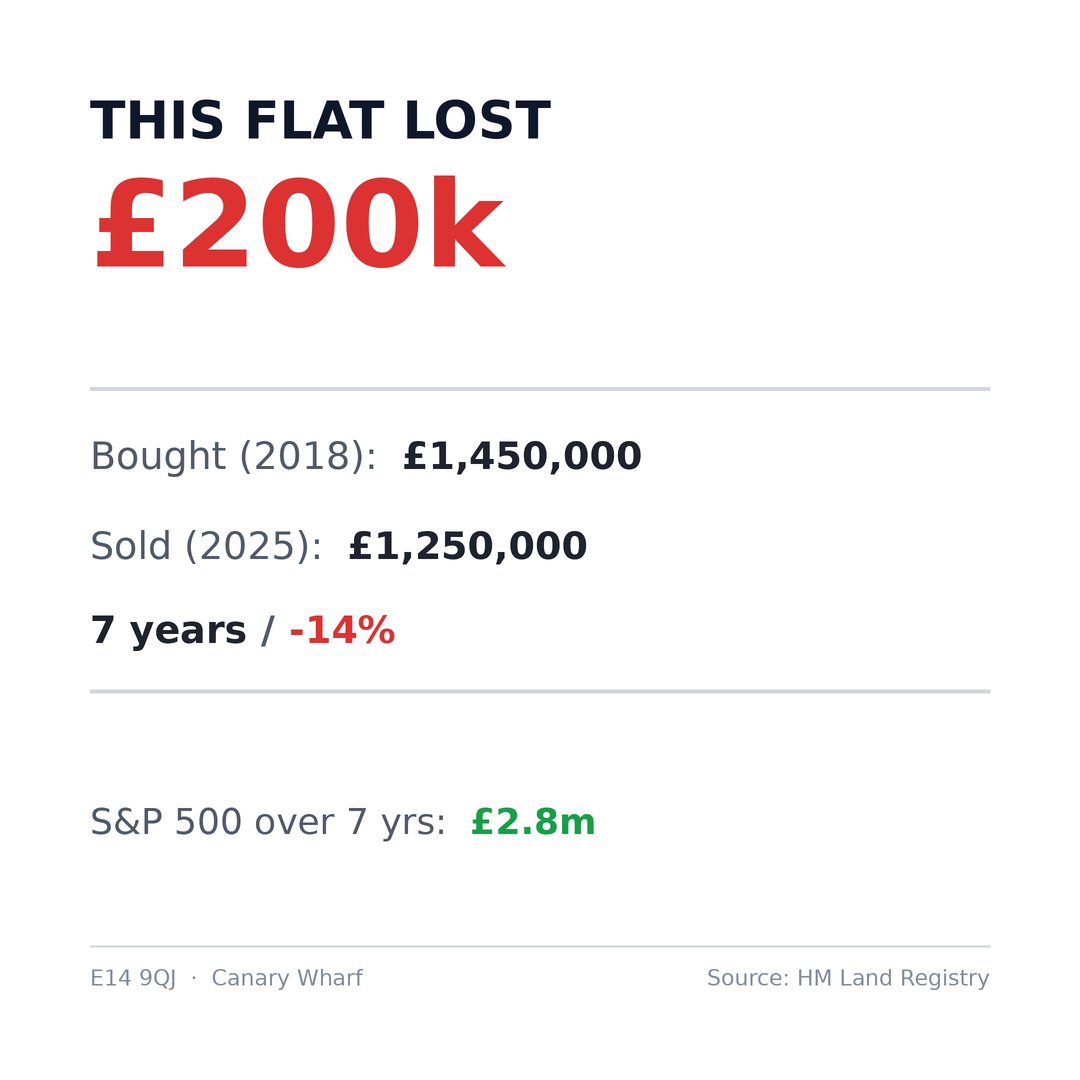
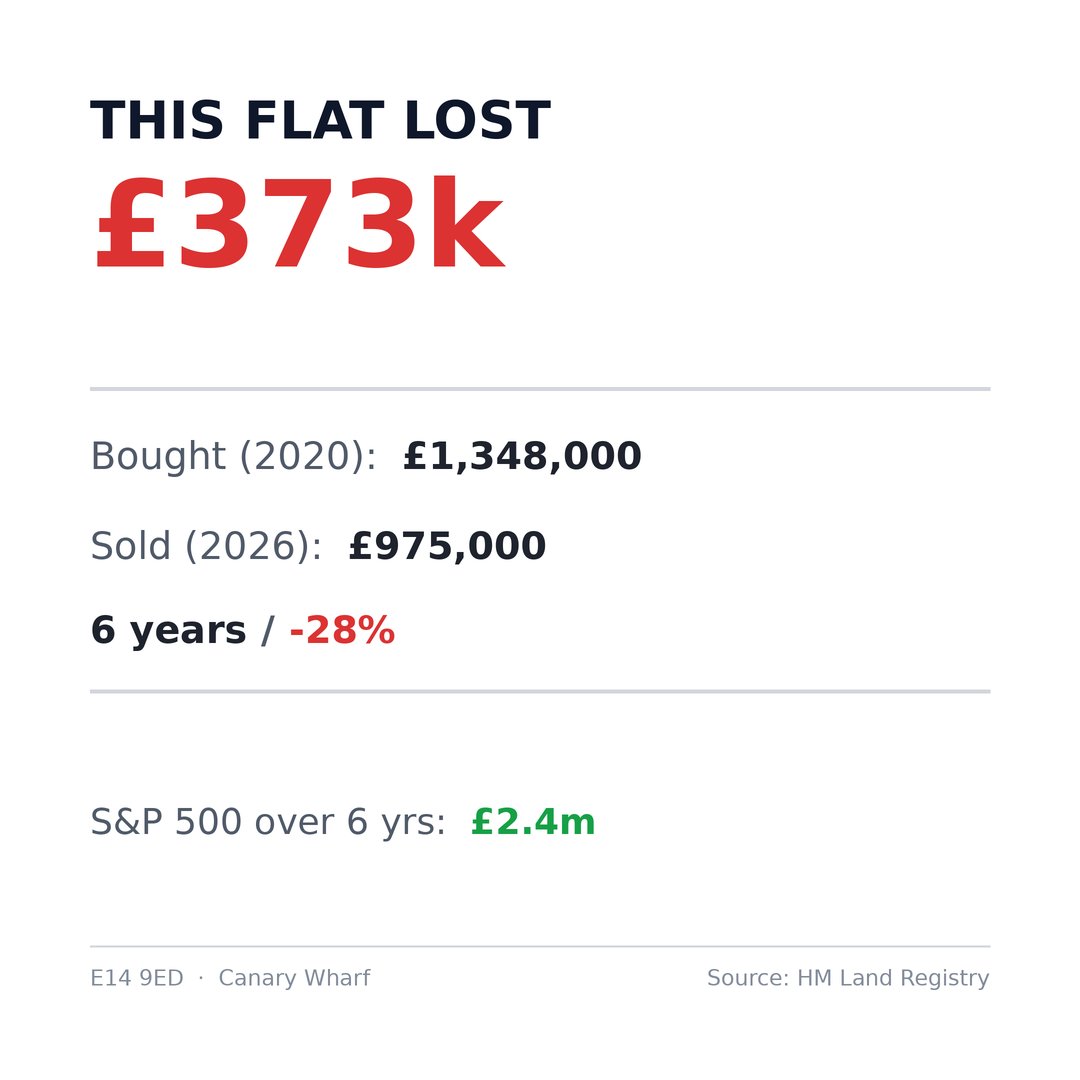
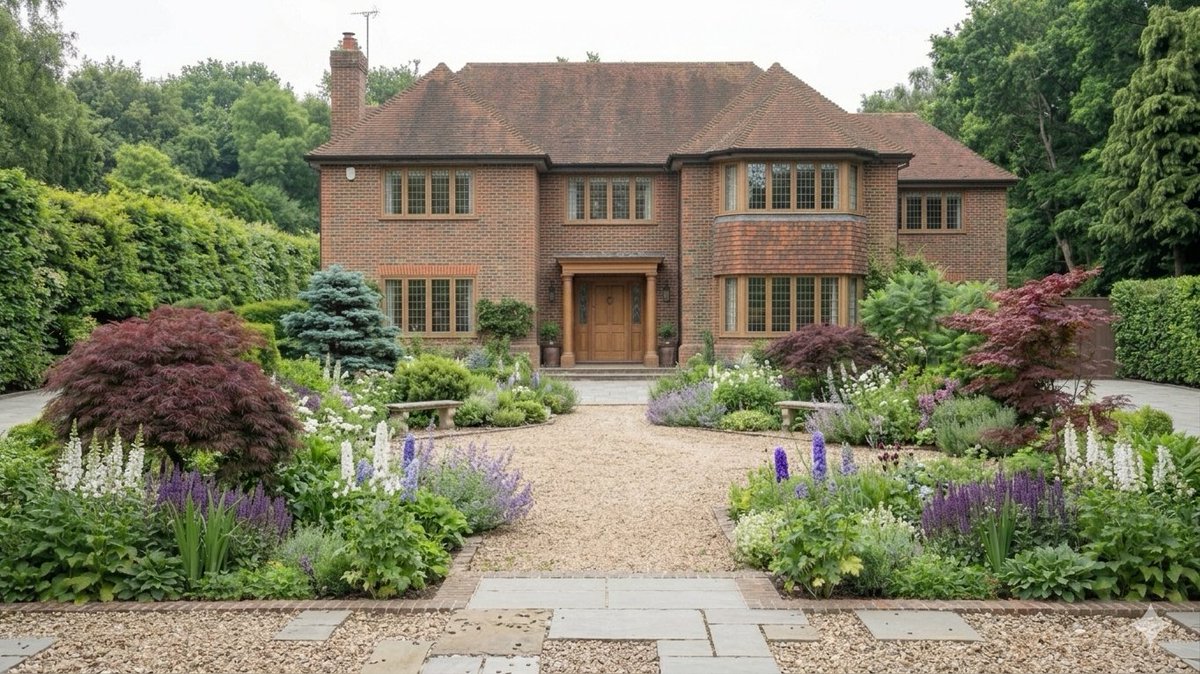
Bridge House Quay, Canary Wharf (E14)
Bought in 1998: £195,000
Sold in 2024: £1,080,000
£885,000 ( 454%) in 26 years. Freehold.
3
2
45
8,855
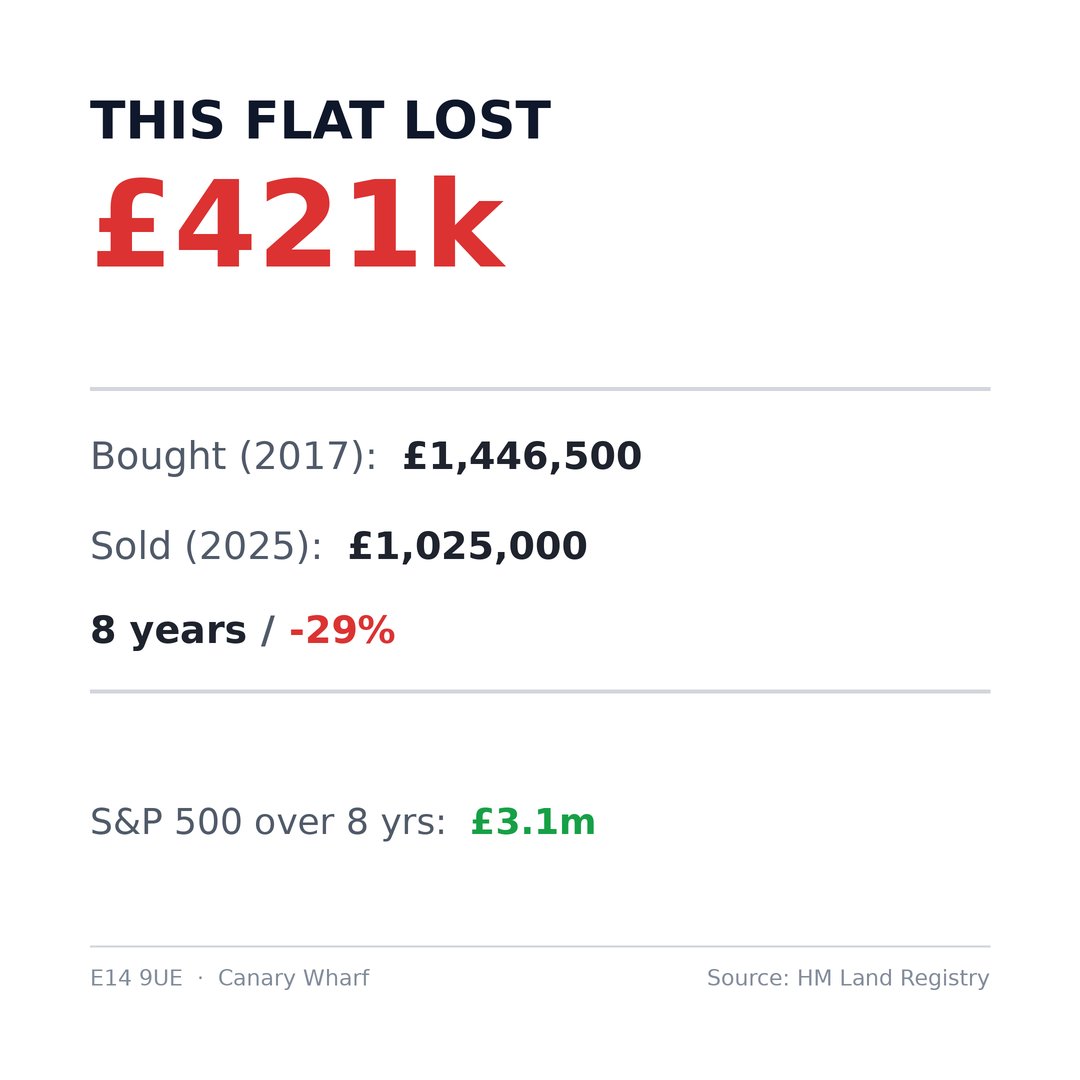
We looked at every London property bought after 2016 and resold between 2024-2026 to find which postcodes had the highest and lowest rates of loss.
Loss rate = the % of total resales where the property sold for less than it was previously bought for.
Highest Loss Rates:
EC1V (Clerkenwell): 57.1%
E14 (Canary Wharf): 55.6%
NW9 (Colindale): 47.9%
E16 (Royal Docks): 43.9%
W8 (Kensington): 41.0%
Lowest Loss Rates:
E20 (Olympic Park): 3.3%
E7 (Forest Gate): 3.6%
SE28 (Thamesmead): 5.4%
E11 (Leytonstone): 5.9%
SE9 (Eltham): 6.2%
Source: HM Land Registry. 37,995 resales analysed.
14
23
253
51,212
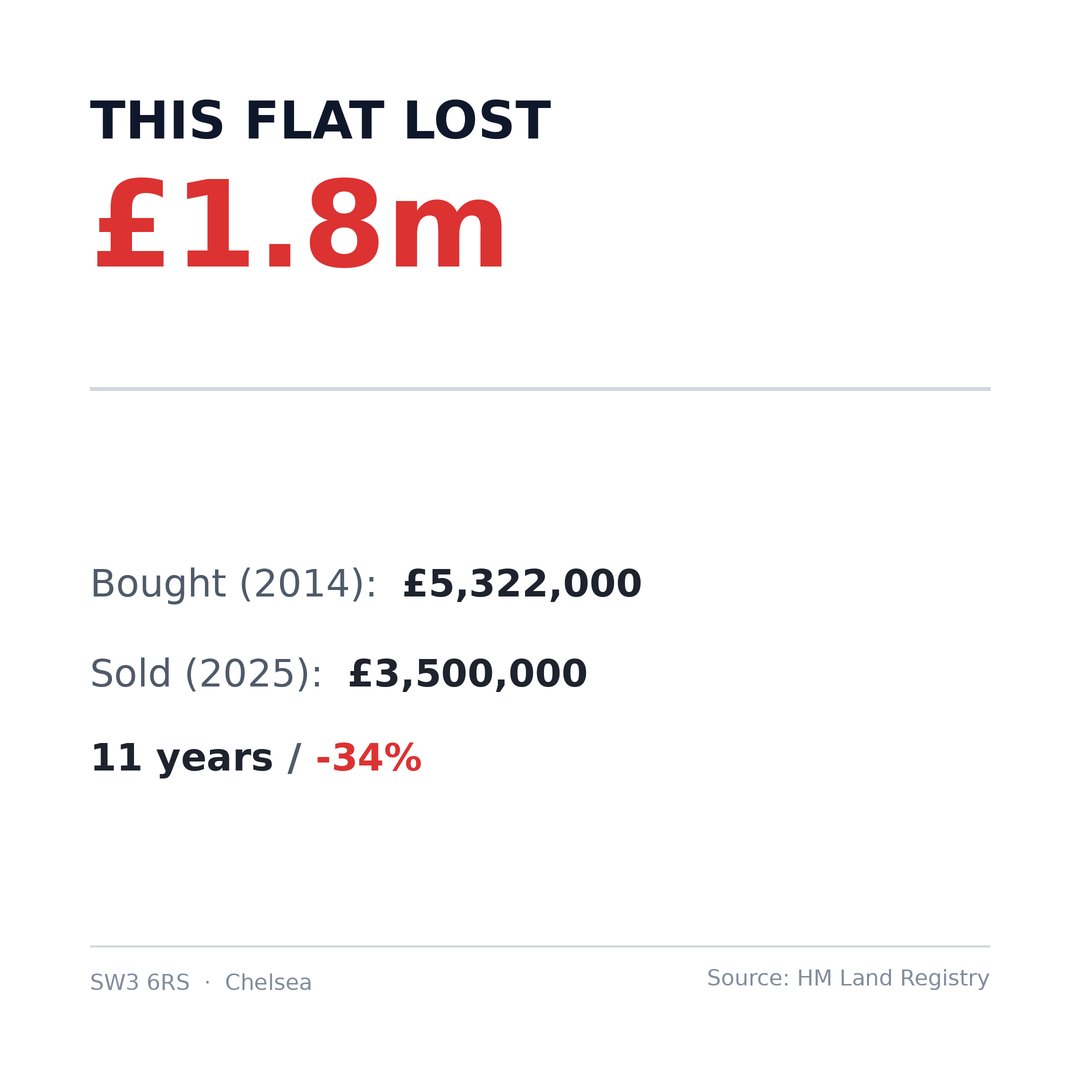
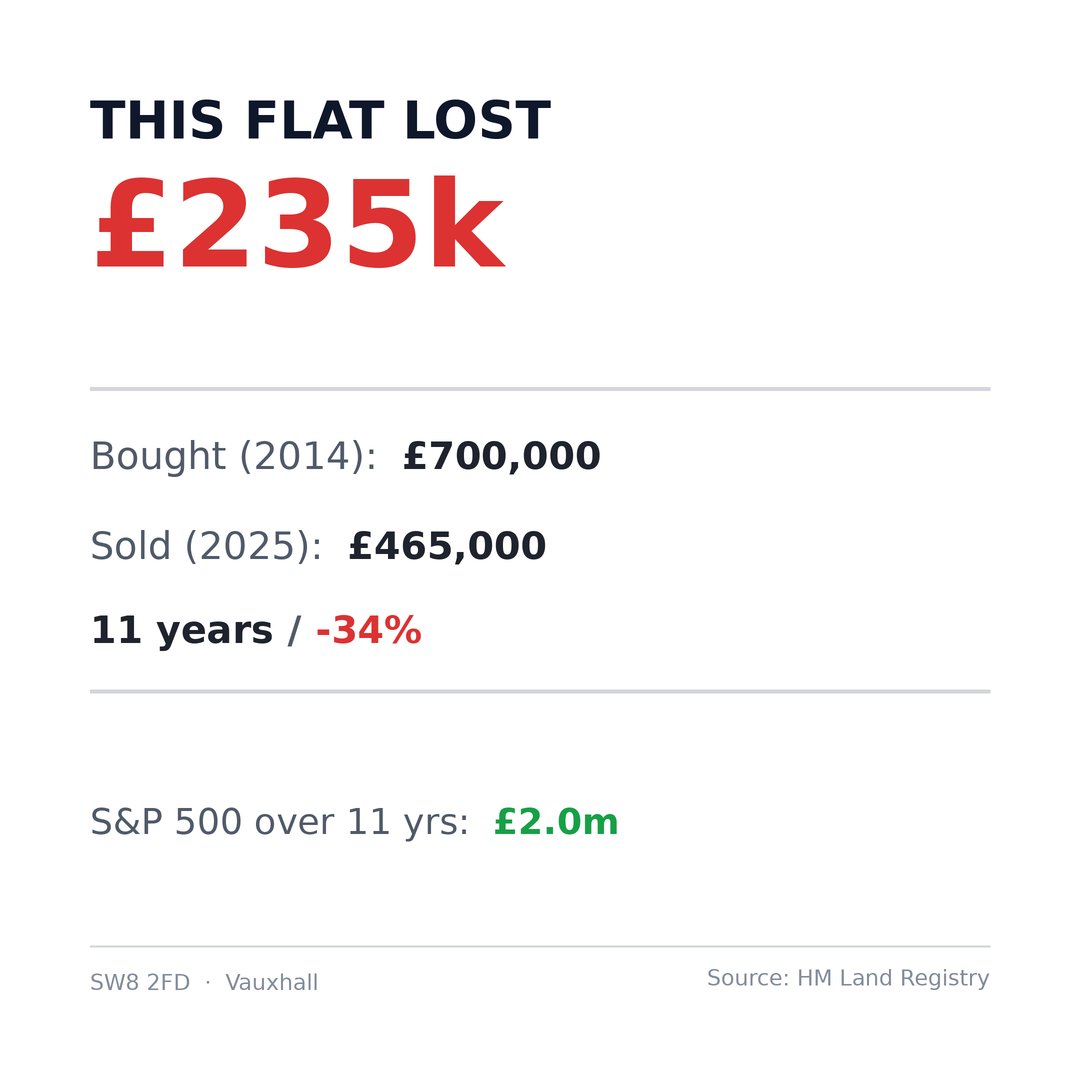
Rose Square, Fulham Road, Chelsea
Bought in 2014: £5,322,000
Sold in 2025: £3,500,000
A luxury flat in a converted Victorian hospital.
-£1.8m (-34%) in 11 years. Leasehold, 900 years remaining.

8
6
124
23,191
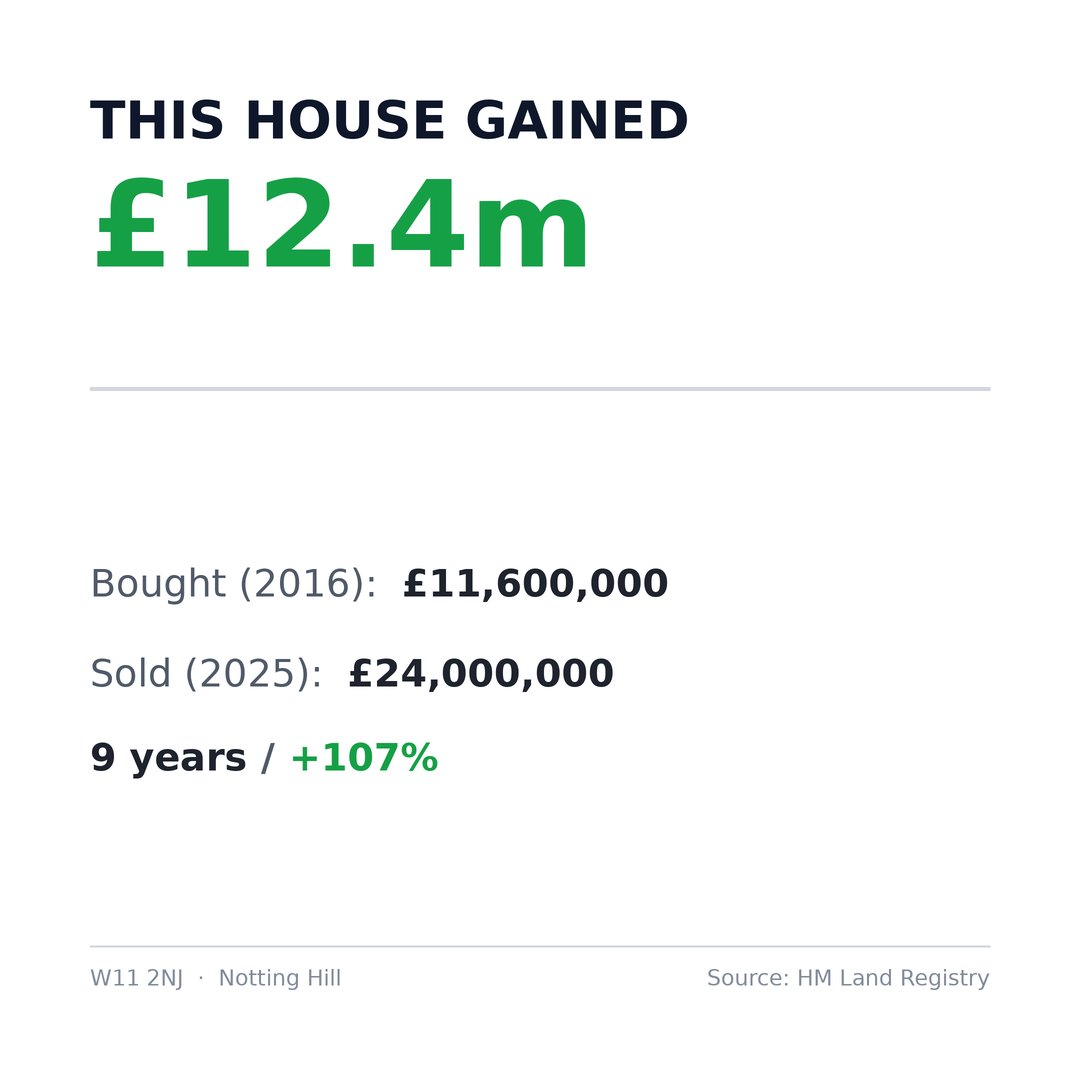
Lansdowne Crescent, Notting Hill (W11)
Bought in 2016: £11,600,000
Sold in 2025: £24,000,000
£12.4m ( 107%) in 9 years. Freehold.
6
1
60
8,483
To address one of the main follow up questions; % of London flats that resold at a loss in 2025, by when they were bought:
Bought 2005–2015: 10.6%
Bought 2016–2023: 28.6%
Over 1 in 4 London flats bought after 2016 resold at a loss last year
Source: HM Land Registry

% of London properties resold at a loss in 2025:
Flats: 17.9%
Terraced: 2.8%
Detached: 3.0%
Semi-detached: 2.2%
Roughly 1 in 5 flats vs 1 in 40 houses.
Source: HM Land Registry, 22,000 London resales analysed
3
8
42
8,024
% of London properties resold at a loss in 2025:
Flats: 17.9%
Terraced: 2.8%
Detached: 3.0%
Semi-detached: 2.2%
Roughly 1 in 5 flats vs 1 in 40 houses.
Source: HM Land Registry, 22,000 London resales analysed
10
34
173
34,314
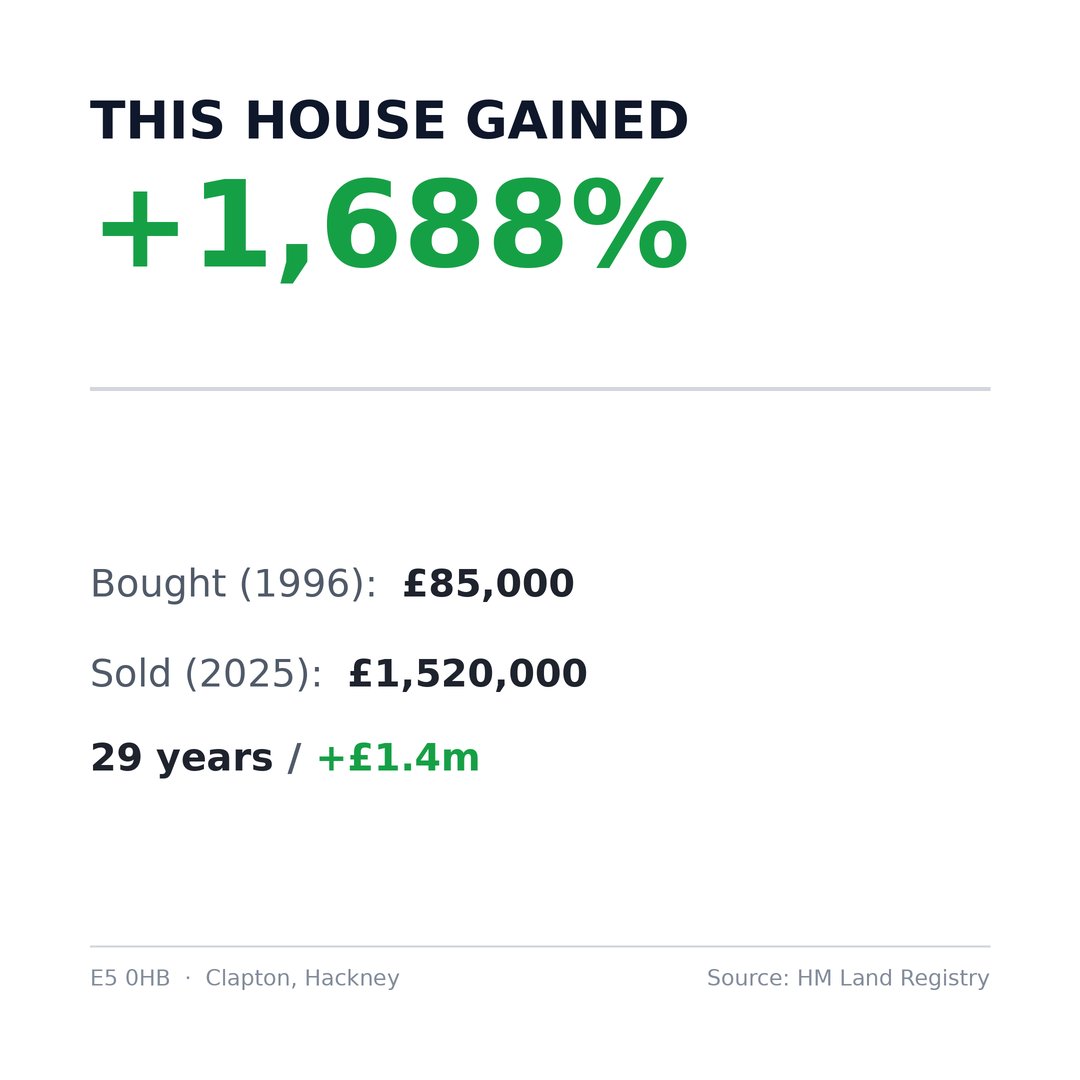
Terraced house in Hackney
Bought in 1996: £85,000
Sold in 2025: £1,520,000
A 1,688% gain over 29 years. Freehold.

11
4
185
28,212
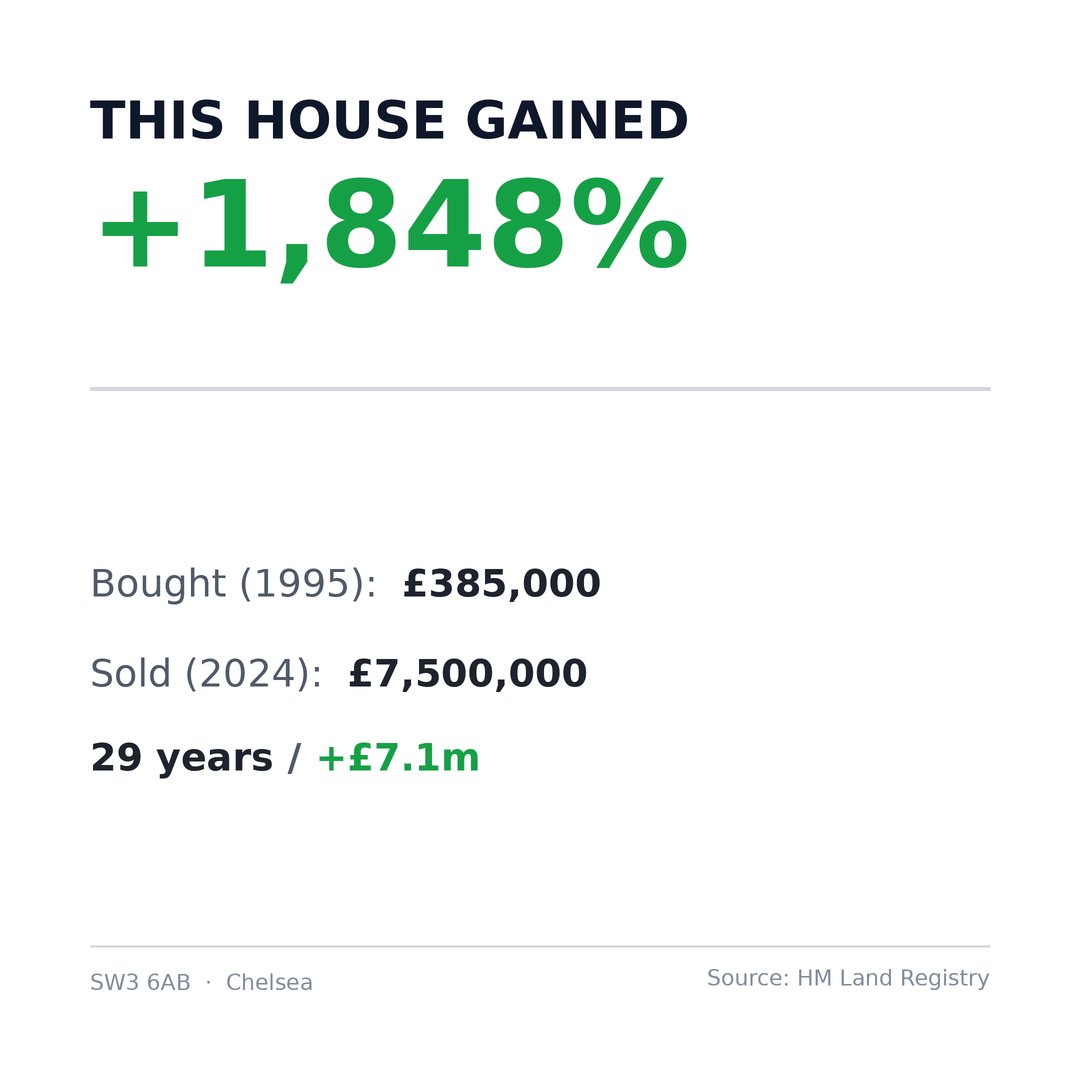
Terraced house in Chelsea Park Gardens
Bought (1995): £385,000
Sold (2024): £7,500,000
£7,115,000. Up 1,848% in 29 years.
7
2
129
20,418
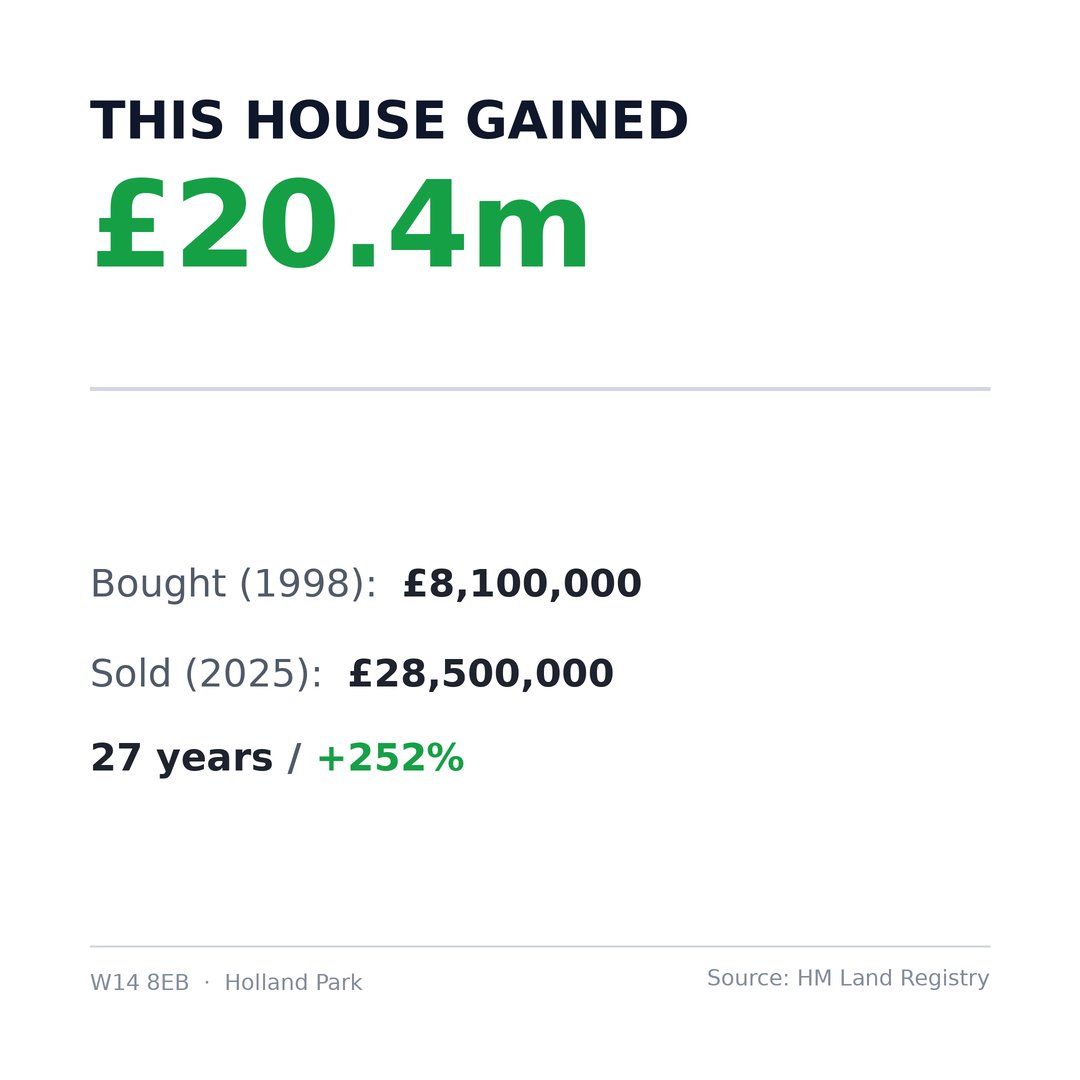
Detached house in Holland Park
One of the biggest property gains in London in 2025.
Bought (1998): £8,100,000
Sold (2025): £28,500,000
£20,400,000. Up 252% in 27 years.

11
4
176
33,992
We analysed every property resale in 2025 across some of Britain's largest cities using HM Land Registry data
Loss rates shown below = % of resales where the property sold for less than it was last purchased for
London: 12.9%
Birmingham: 6.1%
Liverpool: 5.6%
Sheffield: 5.0%
Leicester: 4.8%
Leeds: 4.2%
Cardiff: 4.2%
Nottingham: 3.9%
Manchester: 3.8%
Bristol: 3.8%
5
4
30
8,291