
The Economics of Food, Farming, Natural Resources & Rural America from USDA's Economic Research Service (ERS).
- Tweets 11,491
- Following 96
- Followers 80,189
- Likes 447
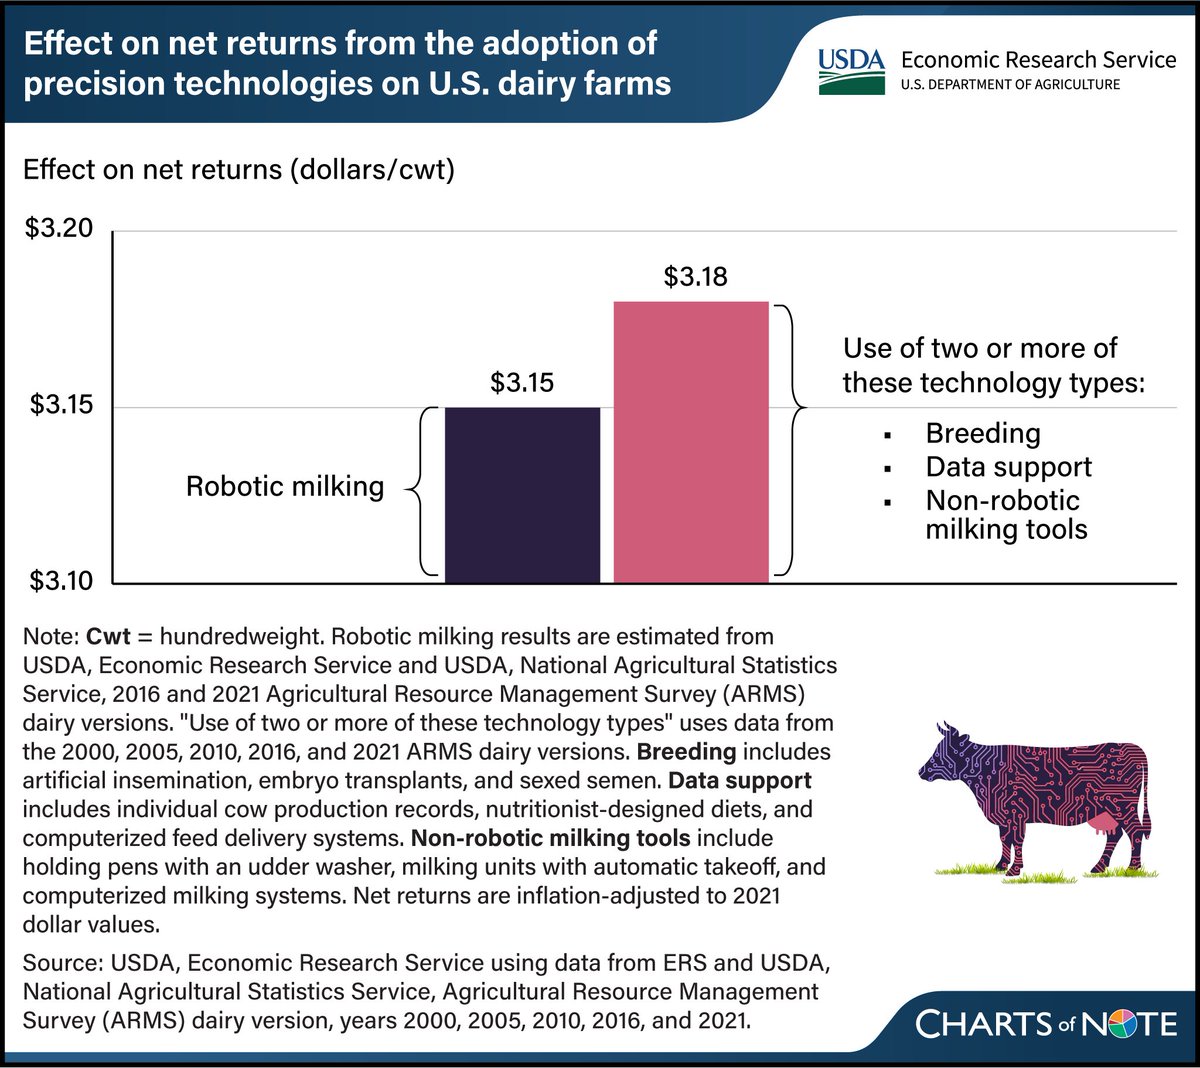


ALT Bar graph showing the effect on net returns (dollars/hundredweight) from the adoption of precision technologies (robotic milking v. use of two or more of breeding, data support, and non-robotic milking tools technology types.
ALT Graphic with the USDA Economic Research Service logo at the top. Large text reads 'Dairy' with smaller text 'By the Numbers.' Faded background image shows dairy cows standing in a field. Three icons appear along the bottom labeled Production, Consumption, and Trade.
ALT Graphic titled 'Dairy Production' with the USDA Economic Research Service logo at the top. Background shows dairy cows in a grassy field under a blue sky. Statistics include: '231.7 billion pounds — Total U.S. milk production in 2025'; '9.5 million — Average number of U.S. milk cows in 2025'; '24,930 pounds — Average milk per cow in 2025.' A box at the bottom lists the top five milk‑producing States in 2025: California, Wisconsin, Idaho, Texas, and New York, noting they produced more than 50% of annual U.S. milk supply.
ALT Graphic titled 'Dairy Production' with the USDA Economic Research Service logo at the top. Background shows dairy cows in a grassy field under a blue sky. Statistics include: '231.7 billion pounds — Total U.S. milk production in 2025'; '9.5 million — Average number of U.S. milk cows in 2025'; '24,390 pounds — Average milk per cow in 2025.' A box at the bottom lists the top five milk‑producing States in 2025: California, Wisconsin, Idaho, Texas, and New York, noting they produced more than 50% of annual U.S. milk supply.

ALT Graphic announcing a USDA Economic Research Service Data Training Webinar titled ‘Resource Requirements of Food Demand.’ The event is scheduled for June 4, 2026, at 1 p.m. Eastern Time. The background features blue gradient tones with a faint image of charts and graphs. The URL www.ers.usda.gov/data-training-webinars appears at the bottom.
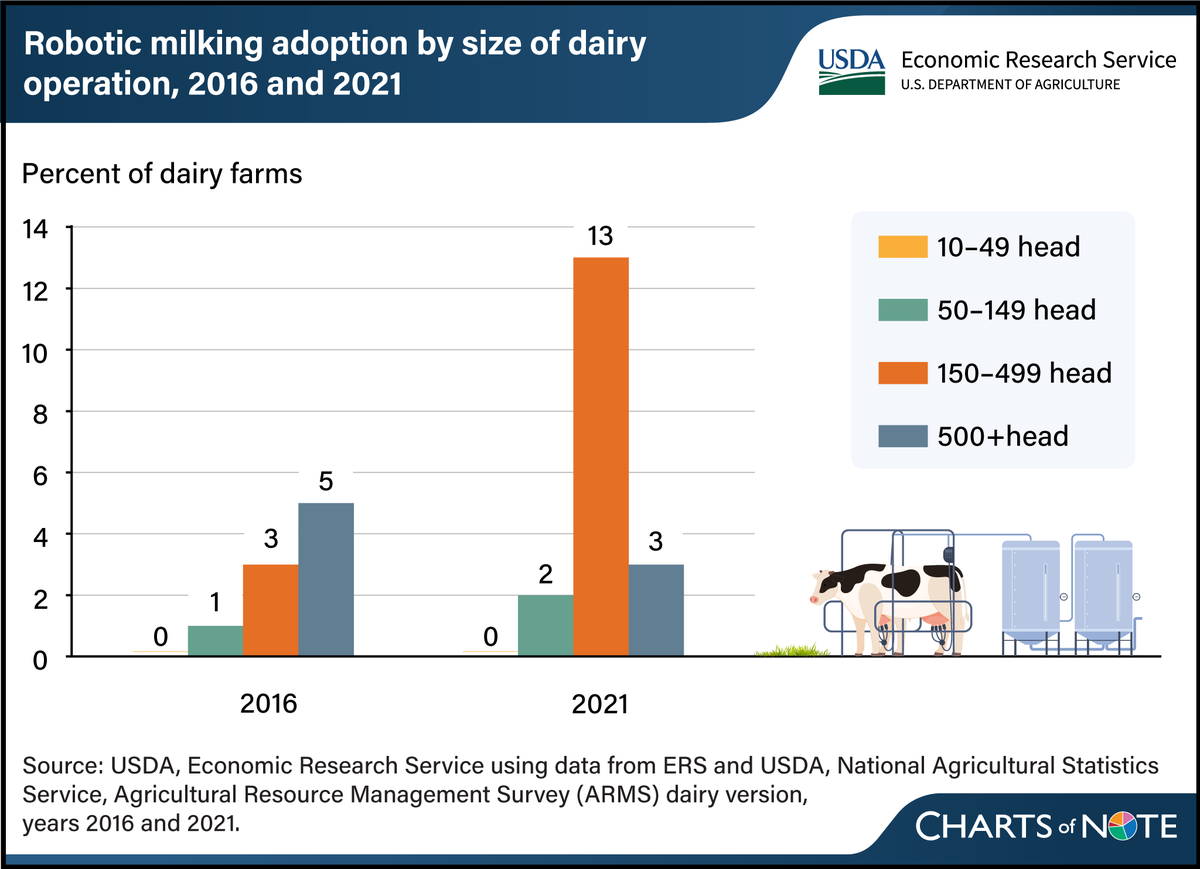
ALT Bar chart showing the adoption of robotic milking by size of dairy operation, comparing 2016 and 2021.
ALT Graphic announcing a USDA Economic Research Service Data Training Webinar titled ‘Resource Requirements of Food Demand.’ The event is scheduled for June 4, 2026, at 1 p.m. Eastern Time. The background features blue gradient tones with a faint image of charts and graphs. The URL www.ers.usda.gov/data-training-webinars appears at the bottom.

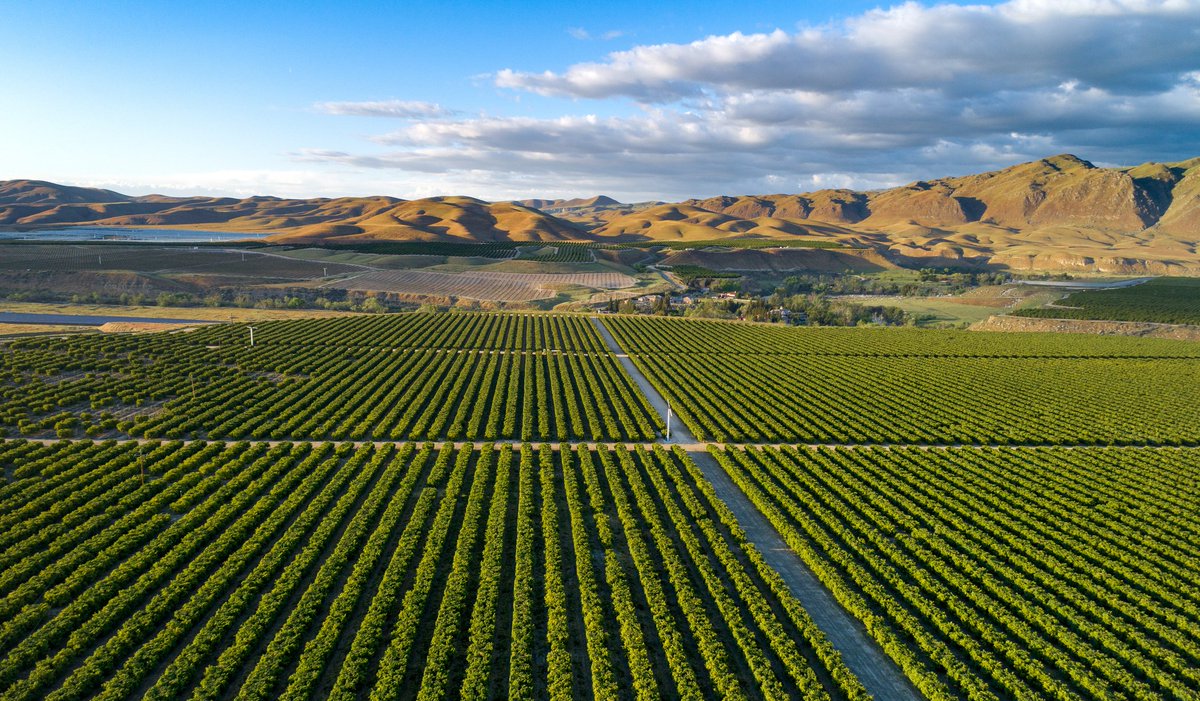
ALT An Olive plantation in Bakersfield, CA.


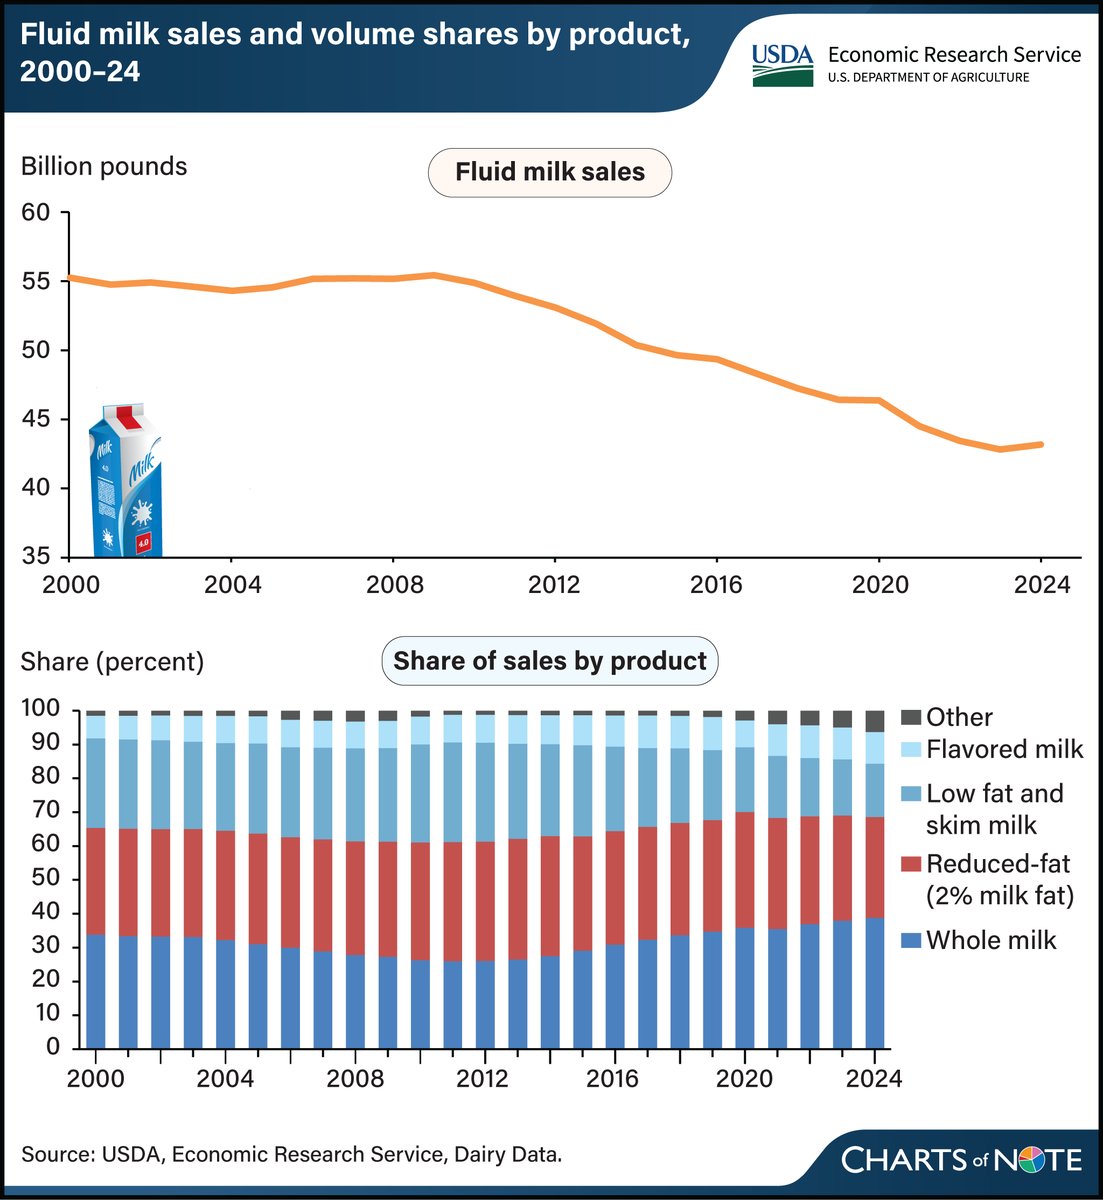
ALT A line graph showing fluid milk sales from 2000 to 2024, followed by a stacked bar chart showing share of sales volume by fluid milk products from 2000 to 2024.
ALT Cover of the USDA Economic Research Service report titled ‘Exploring USDA Rural Development Programs.’ The top half shows the title and authors Anil Rupasingha, James Davis, and Robert Dinterman. The lower half features nine illustrated panels representing Rural Development program areas: housing, infrastructure, business development, energy, community facilities, broadband, water and waste systems, and agriculture.