
"Don't let one cloud obliterate the whole sky" Follow the ones i am following. They know better. 🪙 Crypto Enthusiast 💡 Sharing insight Meme and Art lover
Joined March 2024
- Tweets 6,468
- Following 61
- Followers 103
- Likes 5,990
61 Photos and videos


GDV✨ retweeted

Jun 4
It took 3 months for the main idea mentioned in the video to play out.
As you can see, the inflection point we had identified between the high $70Ks and low $80Ks led to a redistribution phase that took very little time to unfold.
This is largely in line with what we had been saying all along, as well as with the idea that at least the $60K range would be the minimum downside target.
It’s always very complicated from a mental perspective to stay “loyal” to your plan as long as it’s being respected, especially during retracements to the upside that seem to scream “this time is different”.
However, the macro targets remain the ones I mentioned in the video linked on my account.
When I intend to start accumulating BTC again, I will say so publicly, but in my opinion, it is not the right time yet.
1
8
49
3,602
GDV✨ retweeted
May 26
🉐 Announcement: Product Enrolling ( limited offer) 🉐
As you know, we’re just 3 weeks away from the release of our proprietary app and I want to showcase all the features and future plans we have in mind.
This wi be massive and game changer for many. (read till the end)
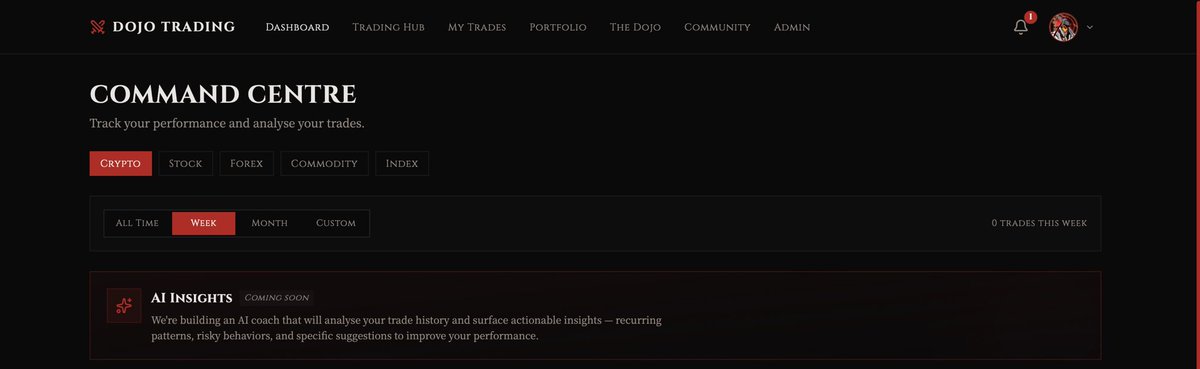
🉐 Dashboard
In here you’ll be able to monitor your active and passive portfolios, manage futures, spot, stocks, commodities, and crypto from one professional workspace.
🉐 Trading Hub
Probably one of the most interesting features.
Members will be able to plan their setups (see here -> x.com/iamzeroika/status/2057…)
and share them in the hub, if they want.
In this way, people will interact with each others about trading setups creating a collaborative environment.
🉐 MyTrades(aveanced trade management)
As shown in the video, members will be able to organize setups by strategy, risk management, and key trading parameters to track and improve performance.
🉐 Sensei AI
We will also integrate the Sensei AI that will analyze your trades to identify strengths, weaknesses, recurring mistakes, so you will grow step by step.
🉐 Smart Portfolio
Members will be able to track assets and receive Sensei AI-driven insights on risk exposure, diversification, and portfolio optimization.
🉐 The Dojo (Next-Gen Education)
How many PDF pages does Notion have?
More than 2.000, an educational trading book, but it’s time to level up.
It will be a fully redesigned educational experience integrating all learning materials into one modern platform and the goal is to integrate guided learning paths, simulations, quizzes, and progress tracking tailored to every trader level.
🉐 Future plans:
1️⃣ Integrate AI market scanner to discover real-time trading opportunities based on your trading style and preferred strategies.
2️⃣ Integrated live sessions
The final goal is to detach from Discord and being able to follow the live sessions directly inside the platform.
3️⃣ Custom Workspace
Personalize your environment with modular dashboards, watchlists, and custom layouts.
4️⃣ Integrated Economic Calendar seasonality
Over time, I want to give access to a built-in macroeconomic calendar with AI-enhanced market context and filtering tools seasonality charts for trading specific commodities.
5️⃣ Ranking & Reputation System
Why not building credibility within the community through quality analysis, setups, and contributions? Why not give them rewards for this? This is something I also have in mind.
6️⃣ Multi-Broker & Multi-Exchange Sync
And what if we can allow people to connect brokers and exchanges to automatically sync portfolios, trades, and performance?
Another thing I have in mind.
As you can see, the goal is to build more than a trading platform, but a complete ecosystem combining education, trading, technology, and collaboration.
This is my long-term plan.
⚡❗Limited offer⚡❗
At the moment, the price continues to remain $9.99, but considering all the work done during these 3 years and this integration, it will increase to $20.00/month starting from the 10th of June.
You got time to lock in your sub lifetime at the original price till that date.
Don't sleep on it, quality already speaks and will speak louder in the coming months.
May 21

More or less, 3 weeks to the release of our proprietary app.
Gonna be a game changer for many.
Dojo V3 taking over.
38
32
225
19,719
GDV✨ retweeted
May 21
More or less, 3 weeks to the release of our proprietary app.
Gonna be a game changer for many.
Dojo V3 taking over.
28
14
171
8,883
GDV✨ retweeted
May 14
✍️ AMT rules I use for my trades:
• Acceptance above VAL/below VAH price will likely migrate toward the opposite boundary of volume (VAH/VAL) using the POC as “reload” area for continuation
• Acceptance above VAH usually signals repricing and continuation, rejection above VAH usually leads back into value because the auction failed to establish higher prices as fair value
• Failed auctions at distribution extremes often lead to aggressive rotations back through the profile (with high statistical probability) -> the bigger the extremes, the higher the probability
• Rejection from low volume areas usually brings price back toward high volume and fair value because low volume zones represent price levels where the market previously found little acceptance
• If the market cannot build acceptance above a level, the breakout is often just trapped inventory created by late buyers entering into poor auction locations
• A POC that keeps attracting price during trend usually confirms the “true business” and accumulation rather than exhaustion
• The longer the market balances inside value, the more meaningful the eventual expansion becomes once acceptance is established outside the range
• Consecutive higher value areas and higher POCs often reveal institutional acceptance of higher prices before trend continuation becomes obvious on the chart
• Alignment with COT makes the AMT trade/setup more reliable giving it a 1
8
31
214
14,739
GDV✨ retweeted
May 11
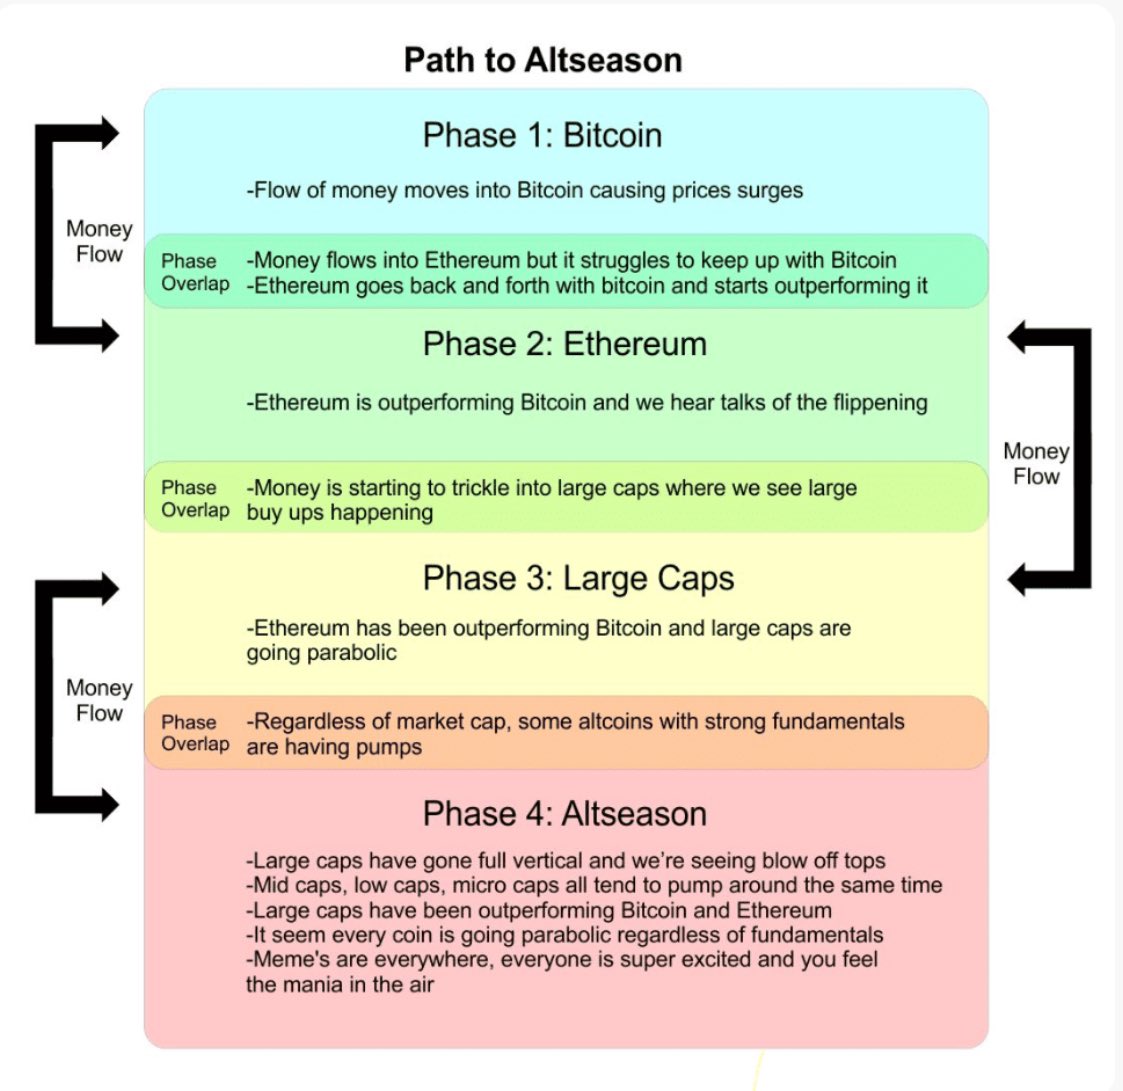
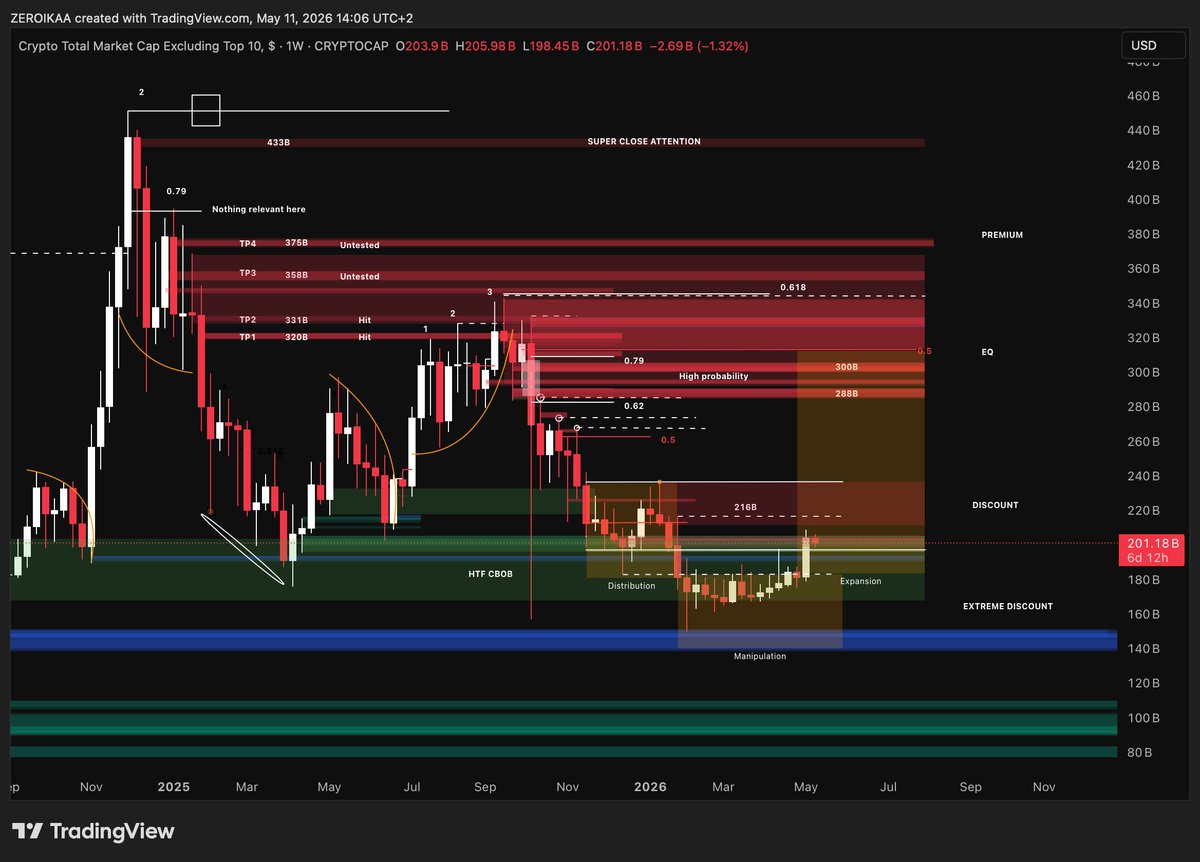
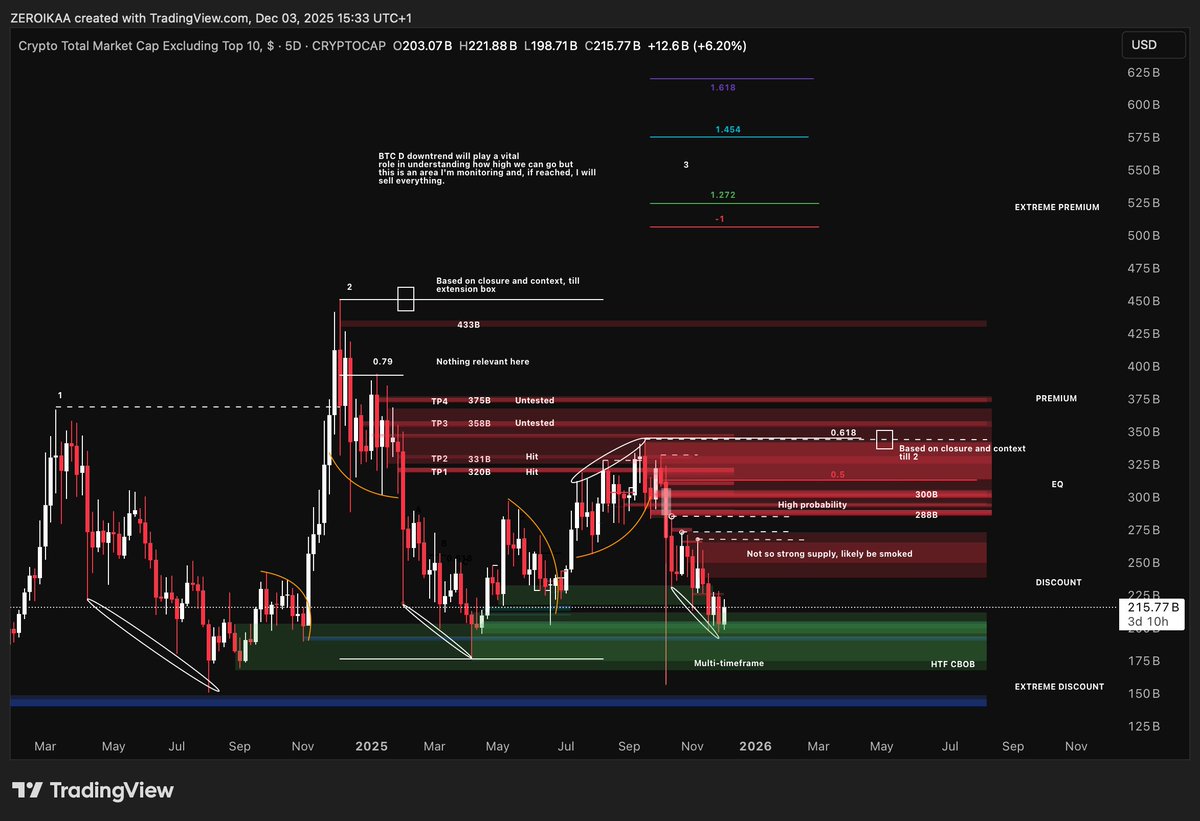
Alright guys, here I am with my analysis on the altcoins.
Please read everything carefully because every step is very important.
So, as you can see from the chart mentioned, at the end of 2025 I had given some targets for the altcoins.
I had also highlighted my main areas of interest: the HTF CBOB, the green zone, and the blue zone, which is a BB just below that area, around 140 to 150 billion more or less.
Now, I’m not claiming I was completely right, because if I’m being honest, I really wasn’t.
I was expecting more of a grind around the green zone, with an accumulation phase and an outperformance from altcoins before this period.
So, I can say I more or less identified the right areas, but I definitely got the timing wrong, because I started accumulating a bit too early.
Fortunately, thanks to solid risk management, I’m fairly comfortable with the situation, but still, I could have handled it better, and that has to be acknowledged in the interest of full transparency.
Anyway, as you can see, the blue zone has been partially mitigated, and between February and May we’ve seen what could effectively be a timeframe PO3, with a distribution phase, a manipulation phase, and now a potential expansion.
Now, within this potential expansion zone, we have the 2WBB 200B, which for now is slowing price action down a bit.
That’s why, in a PO3 context, what I would like to see is a solid retest of 196B or 182B, so that we can confirm acceptance back into the range.
At the moment, it looks like this scenario may actually be unfolding, and if confirmed, the technical target would be 236B, which is the range high for the PO3, and potentially the high-probability zone I identified between 288 and 300B.
If we don't get our confirmations, altcoins will likely take their lows that have been formed on the grind up fully mitigating the 140B BB and potentially lower to 100B where we have the most important demand zone.
Now, what’s important to weigh in this situation, though, is Bitcoin’s condition, because its weekly trend still hasn’t changed and it remains in a bear market context, since no major highs have been reclaimed yet.
So how could altcoins potentially outperform?
Well, in my opinion, the best-case scenario is that Bitcoin moves into the area of interest, which could be around $83K, $84K, or even $90K approximately, forms a ranging or potential distribution pattern, and that this then allows altcoins to move higher.
Why do I say this?
Because right now we’re already seeing some relatively “random” pumps.
We’ve seen SUI and we’ve seen TAO for example and in short, some altcoins are still performing well some of them are already showing trend reversals. (focus on trend shifts, enter on PBs)
My framework is that investors looking to exit one sector could use altcoins as a liquidity proxy before eventually redistributing back into Bitcoin.
That would be the ideal scenario for me, and it’s what I want to keep monitoring closely.
If I see a bearish divergence between the price of Bitcoin and the big caps through intermarket analysis (big caps LHs while BTC ranging) I can take it as a 1 for the distribution thesis.
At the moment, as stated slightly above, I will put my focus on the coins that have produced MSS observing the situation step by step.
One day the 288/300B area will be filled, but we cannot predict when.
13
23
257
18,996
GDV✨ retweeted
May 4
The most sensible area as per the video has been touched, definitely one of the most important in terms of market structure for $BTC.
We’ve fully filled the January 31 HTF LVN, as well as the CME gap around $81,000.
From my perspective, this marks a key inflection point in terms of market structure, so I’ll be watching closely over the next few hours to see how price reacts.
If we start to see acceptance below $80,000-$79,300, then continuation to the downside becomes likely, with one of the most important structural areas sitting around $74,000–$73,700.
That’s the framework currently supporting price.
If that breaks, then a rotation toward the mid-$60,000s becomes a realistic scenario, but at this stage it’s still a bit premature.
So for now, I’d focus on these conditions when assessing the downside.
On the other hand, if price shows further bullish aggression, I would pay very close attention to the $83,000–$84,000 zone, where the previous HTF demand has been flipped into supply.
1
6
49
3,115
GDV✨ retweeted
Apr 27
👁️ Important announcement 👁️
Dear guys, this is probably one of the most important announcements I’ve made on X, so please take a moment to read it because it really matters to me.
Over the years, I believe I’ve done a very significant amount of work.
I’ve grown a lot, studied extensively, and never stopped improving myself.
Those who have been in the dojo since the beginning know this well, they’ve seen the evolution of the content, an incredible volume of work between live sessions, videos, and guides.
There’s really been something substantial.
Most of all, they’ve seen my personal evolution, especially in terms of market understanding and refining my style and now I have a style that I truly feel calm and confident with.
I’ve never wanted to appear as something I’m not.
For this reason, I’ve never allowed myself to start a 1-on-1 coaching program, despite over 8.5 years of study.
However, I continue to receive a huge number of requests and that only makes me happy, because it means people truly value my work and that brings me a lot of satisfaction, because I put a great deal of effort into it.
For this reason, starting in 2027, I plan to launch a 1-on-1 coaching program.
It won’t be something standard, you know me, especially my personality and since I put in maximum effort, it won’t be anything superficial.
It will be a personalized program for each individual, because we all have different risks, goals, and lives.
It will be an intensive process, covering everything from psychology to analysis, execution, and the development of an efficient trading structure.
Above all, it’s designed for those who, like me, are not primarily focused on short-term trading, but prefer a calm, sustainable approach that emphasize a good balance between life/trading and allows for steady capital growth over time.
Thanks for reading till here, hope this may be of your interest.
32
12
400
12,738
GDV✨ retweeted
Apr 25
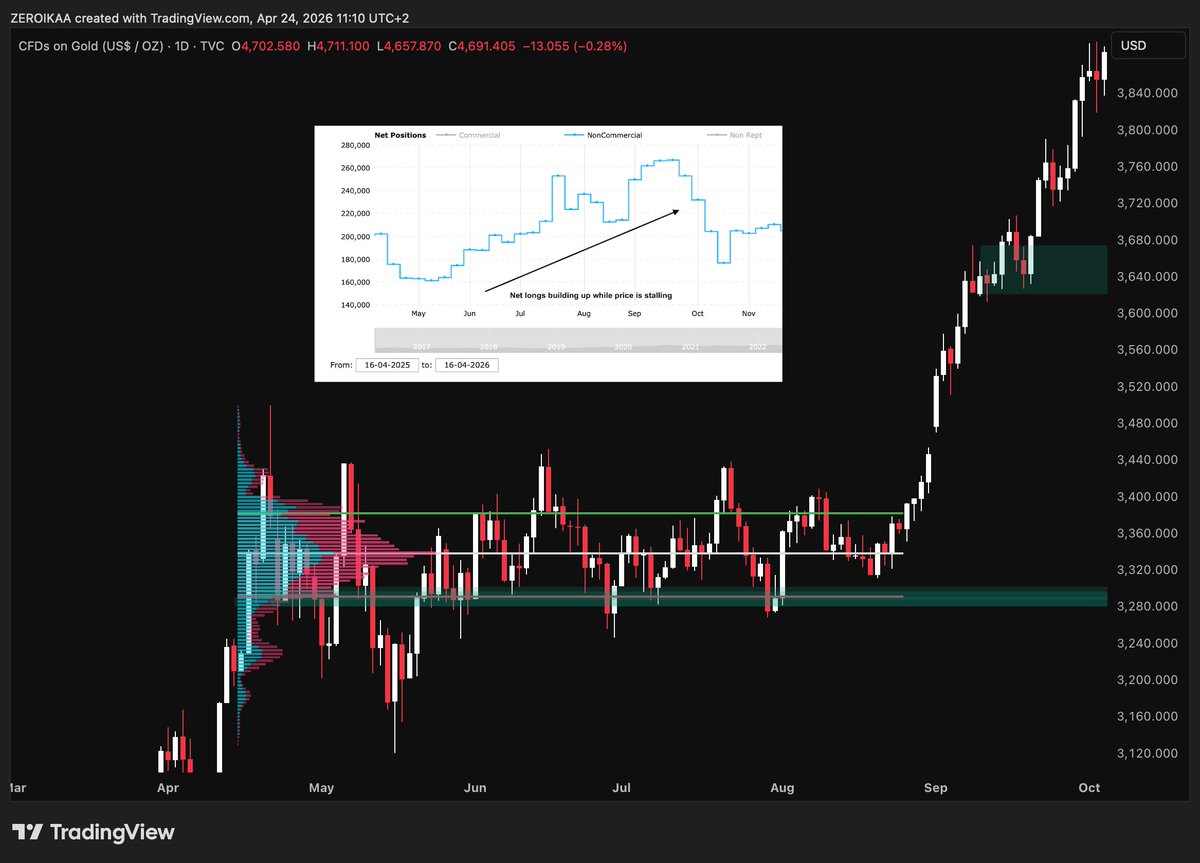
⭕️Market tip: (to study carefully as it can help you to improve your profitability)
When you’re trying to understand very HTF accumulation or distribution and price action alone isn’t giving you enough clarity, one of the most useful external "lenses" I look into is what smart money are doing.
How to? Through the COT report.
The idea behind using it is straightforward: instead of guessing intent from price alone, I look at how different classes of market participants are actually positioned, and from that you infer who is building exposure, who is hedging, and who might be vulnerable.
Within the report, the key distinction is between commercials and non-commercials:
- Commercials are typically hedgers, so entities with underlying exposure to the asset and their positioning is often driven by inventory management rather than directional conviction.
- Non-commercials, on the other hand, are large speculators such as hedge funds, for example.
They are the ones that give "the fuel" to the price and because of their size, their behavior can materially influence trends.
However, it’s important to understand that they are not “smart money” in a simplistic sense, they tend to perform best in established trends and are often late to accumulation phases.
The real value of the COT data emerges when the market is in a prolonged range and directional clarity is low.
In these conditions, price can appear stagnant while significant positions are taking place underneath.
If, during this kind of extended consolidation, you observe non-commercials steadily increasing their net long exposure, you are effectively seeing capital being committed despite the absence of upward price expansion.
This creates a divergence between positioning and price, and that divergence is often where opportunity lies.
It can suggest that supply is being absorbed and that larger participants are positioning in anticipation of a future expansion higher.
That said, this signal only has meaning when interpreted in context.
1⃣If non-commercials are adding longs from relatively low or neutral positioning levels, it can indicate early accumulation and a potential buildup phase but if they are already heavily long from a historical levels and continue adding, the situation changes entirely.
In that case, the trade may already be crowded, and instead of signaling opportunity, it increases the risk of a squeeze in the opposite direction.
2⃣Also, you got to check how PA is moving in correlation with positionment (positions up but price stalling? absorption)
3⃣Take also not there is also a structural limitation you need to account for: the COT report is a delayed, weekly snapshot.
It reflects positions as of Tuesday and is released on Friday, which means it is inherently lagging.
Because of this, it should never be used as a timing tool but its role is to shape an HTF bias and not to dictate entries as execution still needs to come from price action.
When used correctly however, the edge comes from identifying imbalances.
The most valuable situations are not simply when one group is buying or selling, but when there is a mismatch between positioning and outcome: when large participants are heavily committed but price is not behaving as expected.
A wise man said: "Contracts are anticipatory. News is sequential".
6
19
163
10,562
GDV✨ retweeted
Mar 11
❗️Educational video explaining: ❗️
- Value migration theory
- Using value for understanding market's behavior and placing trades
- Exploiting value areas as dynamic protection levels
This video will help you to comprehend market dynamics on a deeper yet simple level.
Watch, implement and share if you think it can be valuable.
10
24
238
14,745
GDV✨ retweeted
Feb 25
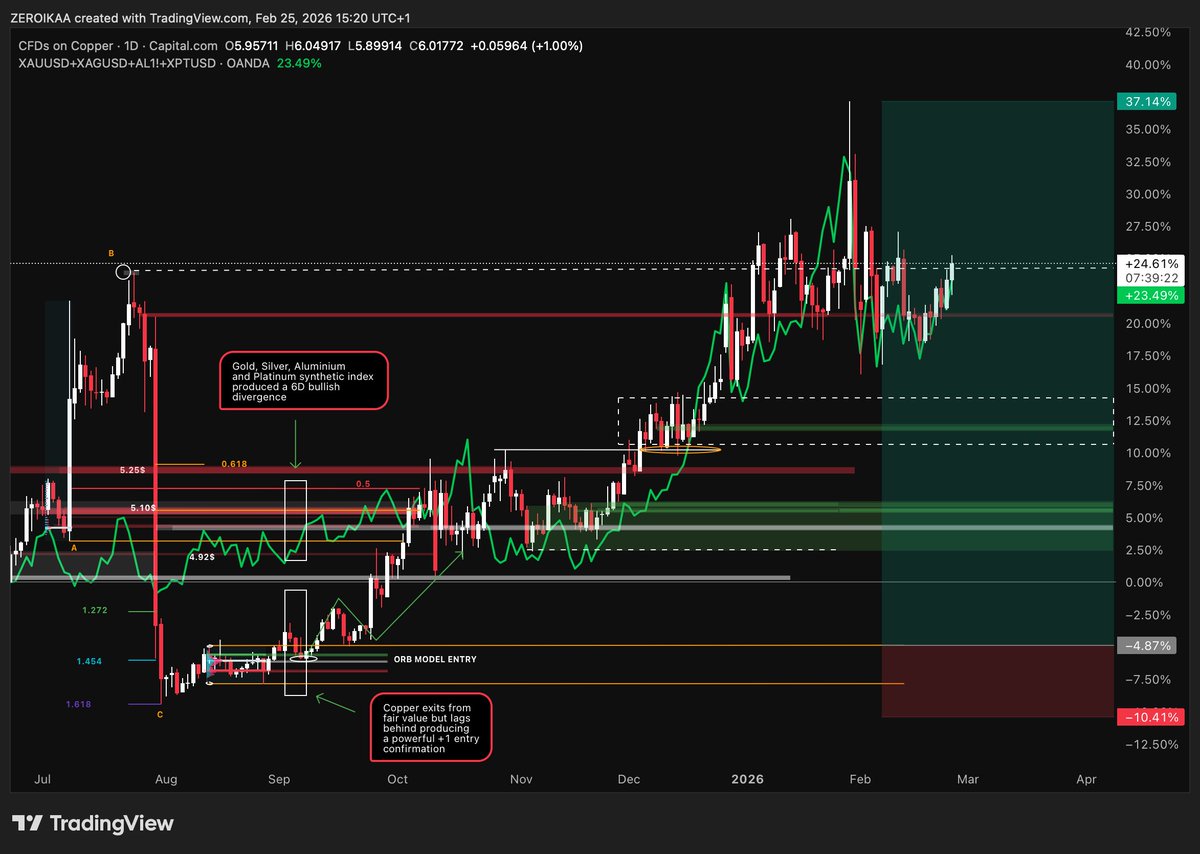
- Educational content: intermarket analysis -
Pay attention because I'm gonna show you something really interesting that might help you to boost your profitability.
One of the most valuable ways to spot undervalued assets is through intermarket relationships, so understanding how capital flows between asset classes and how relative performance reveals mispricing.
As you know, markets do not move in isolation.
Stocks, bonds, commodities, and currencies are interconnected through liquidity, growth expectations, interest rates and, therefore, capital rotation.
When one market diverges from its typical relationship, it may signal a nice opportunity about to flourish.
Intermarket analysis helps you to answer key questions:
- "Is this asset cheap relative to macro conditions?"
- "Is this move confirmed or isolated?"
- "Is capital flowing into or out of this sector?"
- "Is the trend supported by the broader environment?"
"Can you make an example, mate?"
If equities are falling while bond yields are also falling, liquidity is probably improving and equities may thus be temporarily undervalued.
If the USD weakens while commodities are lagging, commodities may be underpriced relative to currency conditions.
But let's see a clean one on charts.
I discussed a few times about the entry on copper from a technical standpoint -> x.com/IamZeroIka/status/2009… but I also want to show you the counterpart on intermarket analysis.
At that time, several metals were performing well and I created a synthetic index by picking the most important ones: XAU, XPT, AL1! and XAG in order to have a reference for capital rotation.
As you can see, they were creating a strong bullish divergence in a 6D time window against copper
- Metals were rising
- Copper was lagging behind
There was misalignment with the rest of the sector meaning that the probabilities for seeing it catching up were quite high.
Price of copper in that divergence period exited from the fair value creating a clean ORB model and, after a clean test of the entry area, caught up "filling" the divergence.
This is exactly how intermarket analysis and structure execution complement each other.
Copper was not simply bought because price moved but because it was cheap relative to its sector.
So, for the future, build a simple composite of related assets:
- Metals → XAU XAG XPT AL
- Tech → NQ SOX XLK
- Energy → Oil XLE NatGas
- Rates → Bonds Gold
- Crypto -> BTC Large caps
----------------------------------
Overlay target asset vs sector composite looking for:
- Sector ↑ while asset <-->
- Sector ↑ while asset ↓
- Sector breaks first
---------------------------------
Find the divergence, you bias and your entry model -> execute
In practice, intermarket analysis helps you to relative misalignment, moments when one market has not yet adjusted to the signal coming from another.
These are often the highest-quality HTF opportunities.
Jan 10
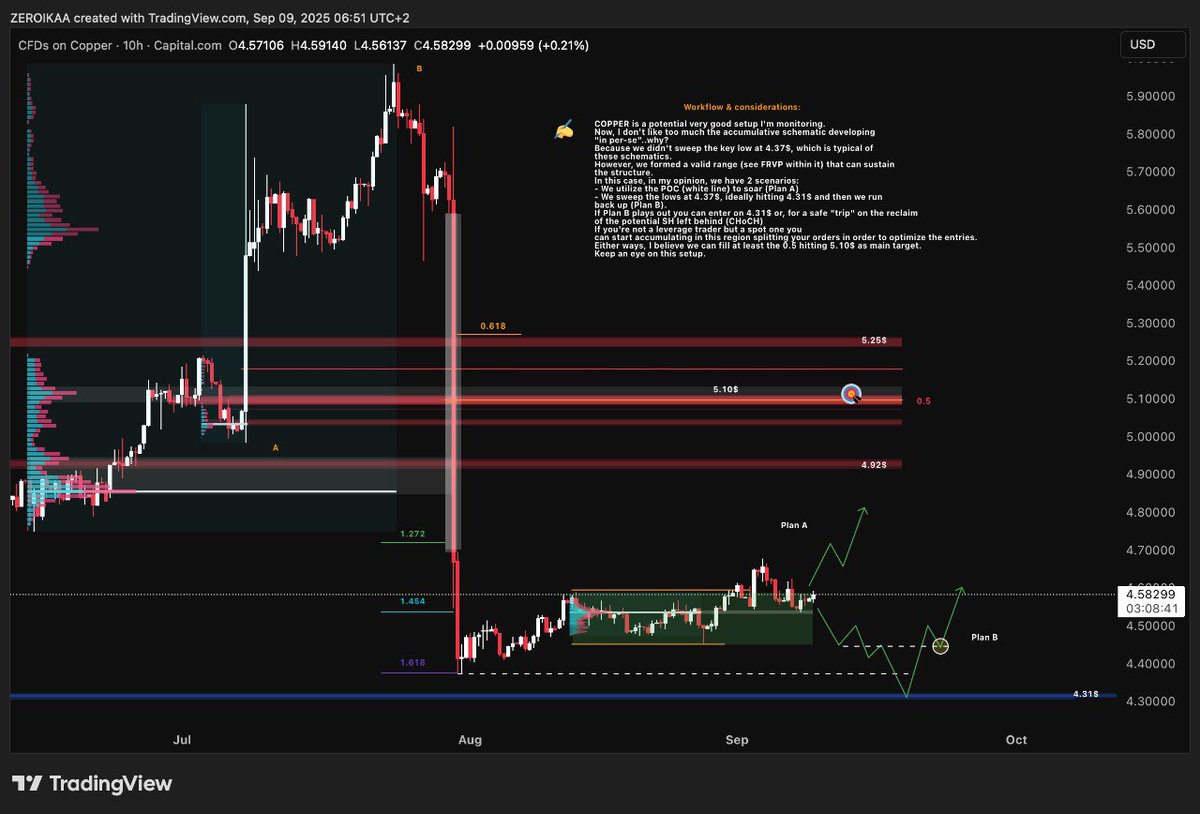
This is an example that I highly suggest you to study because it will improve your overall trading comprehension (and profitability).
At the beginning of September I was tracking the chart of COPPER and noticed something extremely interesting.
The price experienced a very aggressive selloff.
From an AMT perspective, this was a liquidation event and not a bearish auction because there was no real price discovery taking place, only forced selling and stop-driven participation.
Because value cannot be established during imbalance, I had no interest in chasing that move lower.
Instead, I focused on where the auction would eventually find excess on the downside.
Once price stopped extending lower, I began to see signs of strong buying as the selloff lost momentum and continuation to the downside failed.
That told me the selling auction was complete.
From there, the most important phase began.
Price started to build a range.
This is where most people lose patience, but from an AMT standpoint this is where the real information is produced and what we can call "Fair Value building".
Why?
Because time was spent, which is a key factor in order to build value as both buyers and sellers transacted in that area.
That told me the auction was now in balance, and balance is what allows me to build directional scenarios with defined risk.
Inside this range, I paid close attention to the POC and fair value.
These references tell me where the market agrees on price and where participation is fair.
Once those areas are established, the edges of the range become actionable, not because I am predicting direction, but because I understand how auctions behave around value.
At this point, two scenarios became very clear to me.
- If price were to accept above the range, that would signal initiative buying and a shift in value. In that case, I would expect price to seek higher prices and fill the inefficiencies left behind by the liquidation, with area in the 5$ acting as natural target.
- On the other hand, if price failed to accept above value, that would indicate the auction still needed more work.
In that scenario, continuation of balance or a deeper test of lower levels would have been completely natural, aka not bearish but simply what we can call unfinished business.
Price instead exited from the 1st fair value zone seeking for another area where 60 days were spent and another fair value was established before expanding more.
Result? Massive impulse that gave me an overall 30%
This entire sequence is a textbook example of how markets actually move:
imbalance → excess → balance → acceptance.
If you train your eye to recognize these phases instead of reacting to each candle, your trading stops being reactive and starts becoming context-driven.
Which I believe is the key for obtaining consistent results.
5
18
204
10,652
GDV✨ retweeted

Feb 17
@IamZeroIka and I went live yesterday (Q&A style).
I clipped 2 minutes from the stream where I break down:
• The LTF BTC 3H short we took live with members
• The MTF BTC long that followed
Both executed live with the group.
Zero also answered a question about the COPPER trade from last year (breakdown on execution and thesis.)
These streams are not theory.
They’re real trades.
We had a lot of fun doing this, so we’ll be doing more of these 🙏
If you want to see how we actually think through trades live, you know where to be.
11
6
141
10,536
GDV✨ retweeted
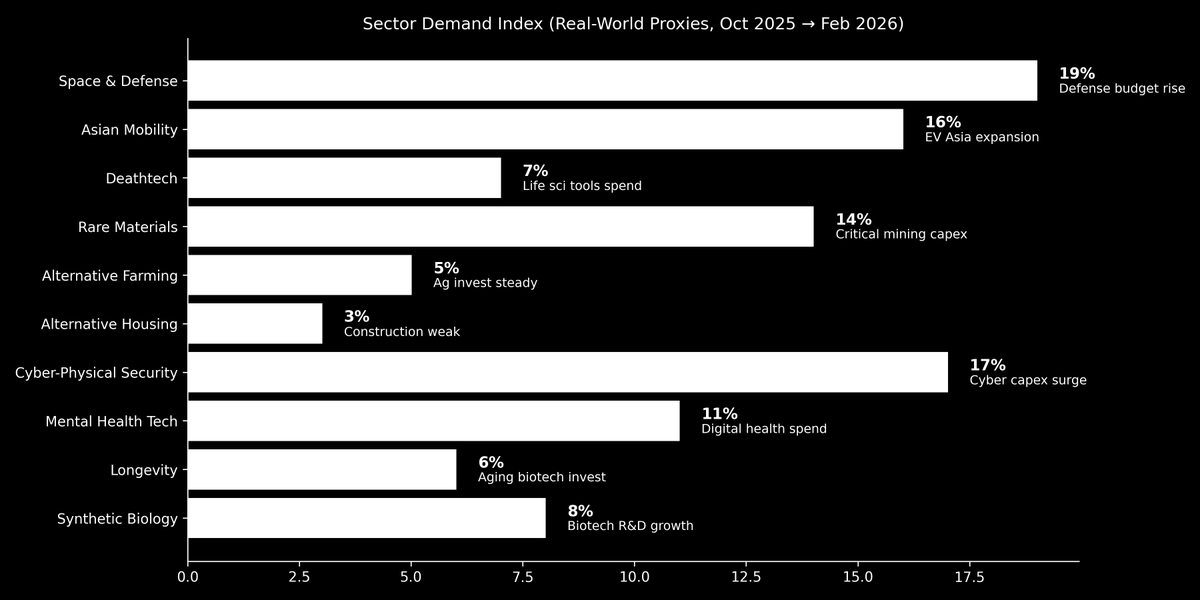
Feb 22
I would suggest you to pay close attention here.
This chart shows a comparative index of global sectoral demand between October 2025 and February 2026, covering the themes I began tracking last year.
The percentages you see indicate the relative intensity of economic demand growth across sectors, estimated by combining indicators of spending, investment, and technological adoption.
Now, why is this important you may be asking?
Because it shows where global economic demand is actually growing across the key technological and industrial themes I began discussing last year, based on where the tangible resources are increasing, such as public spending, industrial investment, and technological adoption.
Growth in real demand historically tends to precede revenues, investment, and eventually market performance, so a map like this also helps you to understand where the next trajectories of economic and financial development may concentrate.
Yes, if you make a quick scan into individual names you'll probably notice that a lot of them already soared consistently.
"Am I late, mate?"
No, because what you are seeing in prices is only the early market response to what I believe is a deeper shift in real economic demand.
Remember that structural demand cycles tend to unfold over years, not a few months.
Don't sleep on this, opportunities are endless and are unfolding day by day.


6
20
269
19,110
GDV✨ retweeted
Feb 19
One of the most subtle and destructive mistakes I’ve seen in trading isn’t losing money, but failing to keep what I’ve already made.
I’ve experienced the pattern of generating profits quickly, even multiplying an account in short periods and then, over time, giving a meaningful portion back.
I came to realize this wasn’t about trading skill, but about how my mind perceived those profits.
When money arrives fast and without tangible effort, my brain doesn’t register it as something that cost life time.
There’s no memory of effort, no sense of sacrifice, it remains just a number on a screen and what I don’t internalize as real stays psychologically light.
Risking it again doesn’t feel the same as risking weeks of conventional work.
That’s why profits are so easily given back, not because they weren’t earned, but because I hadn’t fully recognized them as mine.
So I introduced a practice that changed everything for me.
Each time I realize a profit, I stop and translate it into life time.
I ask myself how many hours of normal work it would have taken to earn the same amount.
That simple conversion immediately changes the psychological weight of the money.
It stops being abstract performance and becomes lived time..mornings, days, weeks of my life.
Something already experienced, and therefore something I’m far less willing to put back at risk.
As soon as profit becomes life already gained, my internal state shifts: urgency drops, the need to keep trading fades, and a sense of sufficiency appears.
This is what allows me to stay still sometimes for days, weeks, or months.
Inactivity in trading it’s the natural result of feeling that I’ve already secured something meaningful.
When profit is only a number, I keep seeking, pushing, exposing.
When it becomes life time, it gains weight and with that weight comes my ability to protect it.
8
22
243
10,072
GDV✨ retweeted
Feb 11
Bear market targets full commentary.
In this video you'll find all my thoughts, reasoning process, analysis and what to look for.
I invite you to watch it till the end because there are some important nuances that should be not skipped.
Of course, with my classic 🇮🇹 accent that adds some funny sauce.
Hope you'll appreciate it and, as always, thanks to the ones who support my work.
60
73
638
81,085
GDV✨ retweeted
Feb 8
✍️Market dynamics/price action 101 tips:
When the price explodes in one direction, the least likely outcome is an immediate V-shaped reversal.
Could it happen? Yes, but for that to occur, the opposing side would need enough capital and conviction to absorb all aggressive order flow and instantly it, which is extremely rare in my experience.
After a violent expansion, the dominant side still holds a lot of inventory.
Meanwhile, early counter-trend traders often get squeezed before any meaningful rotation develops.
So:
• Pullbacks are typically continuation setups
• Trapped traders look for relief, adding supply on rallies in selloffs and demand on dips in rallies
Traders who missed the impulse wait for retracements to enter and thise caught on the wrong side wait for bounces to exit.
“So what I should you look for, mate?”
A range formation.
In a range, buyers and sellers start negotiating again, building new fair value.
Trapped traders can exit slowly and new positions can be added without impacting the price too much.
At the same time, structure forms.
SHs and SLs become clear reference points and when the price eventually breaks from that range, the move tends to be cleaner and more sustainable because inventory has reset and weaker hands have been cleared.
👉 Violent expansion → Don’t fade early → Range forms → Structure builds, mark levels → Break occurs, trade expansion
What’s required?
Patience, something rare I would say.
5
18
253
10,155
GDV✨ retweeted
Feb 8
As a human, I often feel the desire to search for happiness elsewhere.
Then I realize that I have the privilege to live in such a mind-blowing place.
Grateful beyond words.

24
2
401
11,345
GDV✨ retweeted
Feb 4
- Notion 2.0, 2026 plans -
Alright guys, here’s a sneak peek at what the educational material inside Notion has become and what the plans are for this year.
Over the past 2 years, I’ve written extensively.
The result? A complete trading course, structured and accessible even if you’re starting from zero.
We’re now talking about 1,700 pages of PDFs covering everything from basic to advanced concepts.
From market structure to Wyckoff, from AMT to SMC not just through written material, but also supported by in-depth video content.
It’s truly a comprehensive learning path.
And this year, it’s going to be expanded even further with new content across multiple areas:
- Technical: time cycles, execution models, deeper operational frameworks.
- Fundamental: with a strong focus on traditional finance.
- Psychological: new practical guides and tools designed to help you stay calm, build discipline, and develop the right mindset.
On top of that, there will also be live training sessions to make the experience even more interactive and dynamic.
If you combine all of this with weekly and bi-weekly market analysis, video updates, and a tight-knit, growth-oriented community… what you get is not just a course, but a high-level learning experience.
A special thank you to @studentoffew of course not only for expanding the Notion with his educational videos, but for actively contributing with updates and analysis that are bringing real value to all members.
If you’re looking for a structured growth path, one designed to guide you step by step, even if you’re starting from scratch.. this is exactly what you need.
35
37
295
29,119
GDV✨ retweeted
Feb 6
One thing is sure.
If you mock those who are struggling, may your own arrogance dig the grave you stand in.
15
20
395
9,168
GDV✨ retweeted
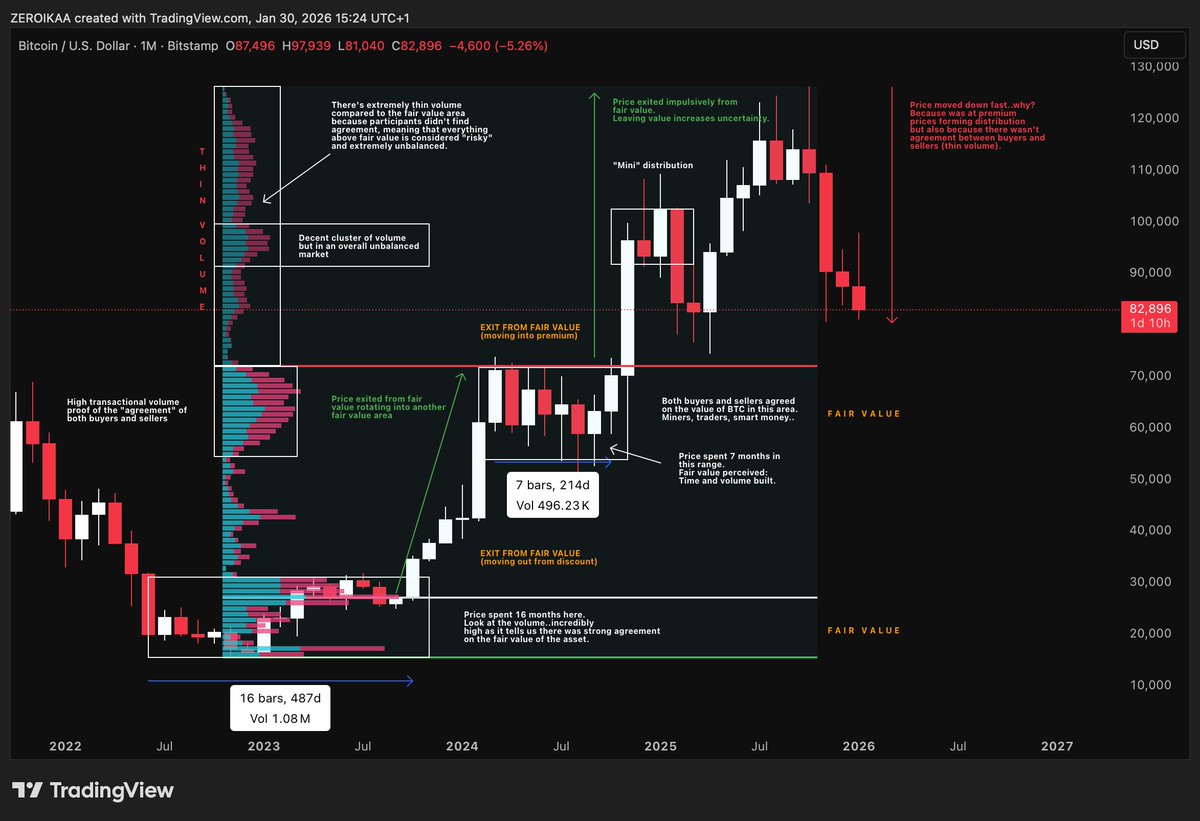
Jan 30
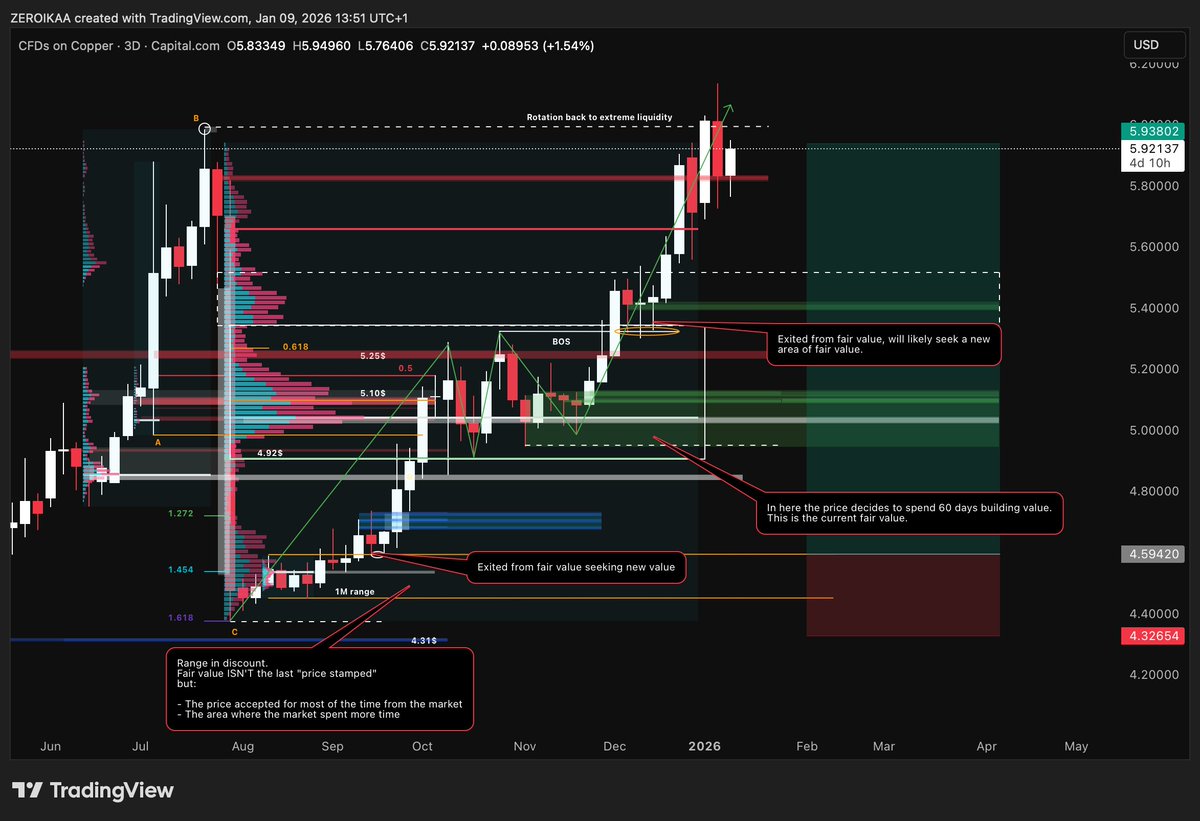
- Macro BTC considerations (⌛️time & fair value explanation/educational content -> note down for the future, it will help you ) -
Time to write the 3rd version and the follow up of the post made on December with another technical concept, so it can provide you with a better long-term picture.
We already discussed quite a lot about the HTF distribution ongoing on BTC in August -> x.com/IamZeroIka/status/1959… but it's also important to understand
how value is actually built.
This is a 1M chart with a visible RVP applied across the entire structure.
The key here is not the candles alone, but where time and volume concentrated.
⌛️Time 📊volume = value.
Anything else is imbalance.
------------------------------------------------------
Starting from the 2022–2023 base, price spent roughly 16 monthly candles rotating in a tight range.
The volume profile shows a thick high-volume node in that lower region which is a strong sign of two-sided agreement.
Buyers and sellers transacted heavily there, therefore the area became fair value.
When a market spends that much time transacting at a price, it is effectively saying: this is acceptable value.
The breakout from that zone was value migration.
"Value migration?"
Essentially, price left discount, accepted higher prices, and began building a new area of agreement.
Notice how after the initial expansion, BTC spent around 7 months rotating in the mid-range zone.
What do you see?
Again, volume clustered.
Again, time was spent.
That created a new fair value region around that red horizontal boundary.
This is where auction theory becomes critical.
Markets rotate from balance to imbalance and back to balance -> The mid-range consolidation was balance, the impulsive move above it was imbalance.
👁️Now, eyes open: 👁️
When price exited that 2nd fair value area, it moved into a low-volume region on the profile.
Look at the upper section of the volume profile: It’s thin.
That means very little historical agreement occurred there.
The move was vertical, aggressive, and built on limited 2-sided trade.
In auction terms, it's price discovery without acceptance.
Acceptance requires time and volume and we did not get that at the highs.
Instead, what formed was a distribution structure.
Upper wicks, overlapping monthly candles, and failure to hold above the prior balance high.
Translation? Supply entering the market.
👉When strong hands distribute, they do it in premium territory, above fair value, not inside it.
Now connect this to the selloff.
Why did price move down fast?
Because once the market rejected premium, it was sitting inside a liquidity vacuum.
There was no high-volume node to provide structural support above.
When imbalance resolves inside a low-volume area, price accelerates toward the nearest high-volume node.
Markets are attracted back to fair value.
1. -> First fair value built in the 2022–2023 base.
2. -> Second fair value built during the 2024 consolidation.
3. -> Impulsive expansion into premium without building new value.
4. -> Distribution at highs.
5. -> Rejection back toward agreement.
Navigating financial markets with this concept becomes easier and you'll inclined to make better decisions.
15 Dec 2025
- Macro BTC considerations -
I think it's now time to write the second version and the follow up of this post made on October in order to see how the price action is developing.
During the last time we were dicussing about the clean distributive scenario taking place suggesting that the last SFP generated would have likely provided an impulse to the upside and potentially a new ATH only if the price would have found acceptance above the 116K key high.
That was our inflection point and, as you can see, the price has been hardly rejected producing a -30% into the HTF demand located at 80K and from where we saw a 17% into the shelf bottom retest (aka a corrective bounce untill proven otherwise).
Now the HTF demand is our PoR and the first most important level to protect if we want to see continuation to the upside ($80.500 low/internal lows to protect too but this an HTF view) otherwise, if violated, the risk for seeing the 70Ks will increase substantially.
Protection doesn't only mean no acceptance below the lows, but also means seeing a sutainable move above $94.600 but most importantly $107.465 where we can have our confirmation of a new high in play. (the last one if it happens)
It is important to stress that a sweep into the 70Ks would not automatically be bearish from an HTF perspective.
On the contrary, such a move would likely complete the corrective leg of the cycle by forcing capitulation, clearing remaining excess leverage, and establishing a more robust liquidity base.
This would allow the market to rebalance and potentially transition from distribution into accumulation, providing the structural conditions needed for a more sustainable upside expansion.
That is the only area I'm interested for building HTF longs.
Naturally (but this is something I already stated several times) this is still not the moment to buy BTC for the long term (despite the 70s) and, if you have patience, you will likely have a big opportunity during the next year, in my opinion.

12
23
254
20,766