
12 Photos and videos
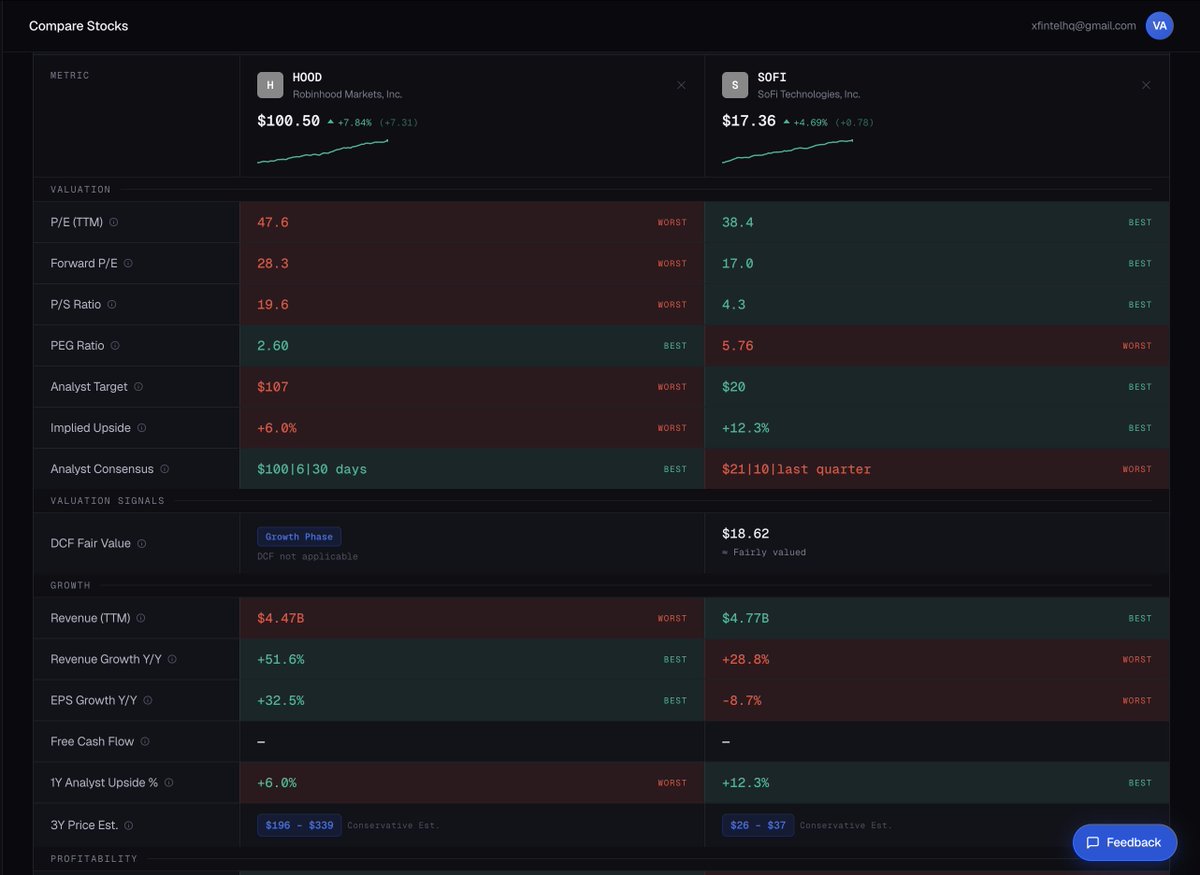


$HOOD vs $SOFI who has better fundamentals.
Here's the data.
𝗛𝗢𝗢𝗗
▪️ Revenue Growth: 51.6%
▪️ EPS Growth: 32.5%
▪️ Operating Margin: 46.3%
▪️ Net Margin: 41.1%
▪️ Institutional Ownership: 86.7%
𝗦𝗢𝗙𝗜
▪️ Revenue Growth: 28.8%
▪️ EPS Growth: -8.7%
▪️ Operating Margin: 12.6%
▪️ Forward P/E: 17x (cheaper)
One has the margins. One has the valuation.
74
Today, versys is completely free for all beta users and includes:
1️⃣ Stock Lookup
• 30 financial metrics
• DCF fair value & valuation signals
• AI Summary of strengths & weaknesses
• 5Y Bull/Base/Bear price projections
• Insider & congressional trading
• Institutional ownership
• Earnings history & upcoming catalysts
2️⃣ Compare Stocks
• Compare up to 4 stocks side by side
• Best/Worst metric highlighting
• Save, share & export as PNG/PDF
3️⃣ Interactive Charts
• Compare up to 3 companies
• Revenue, EPS, margins, FCF & more
• AI insights, CAGR & multiple chart types
• Export-ready for social media
4️⃣ Mobile PWA
• Install on iPhone & Android
• No App Store required
• Native app-like experience
5️⃣ Saved Comparisons
• Save your research
• Reload anytime
• Sync across devices
What feature would make you use it every day?
1
1
3
217
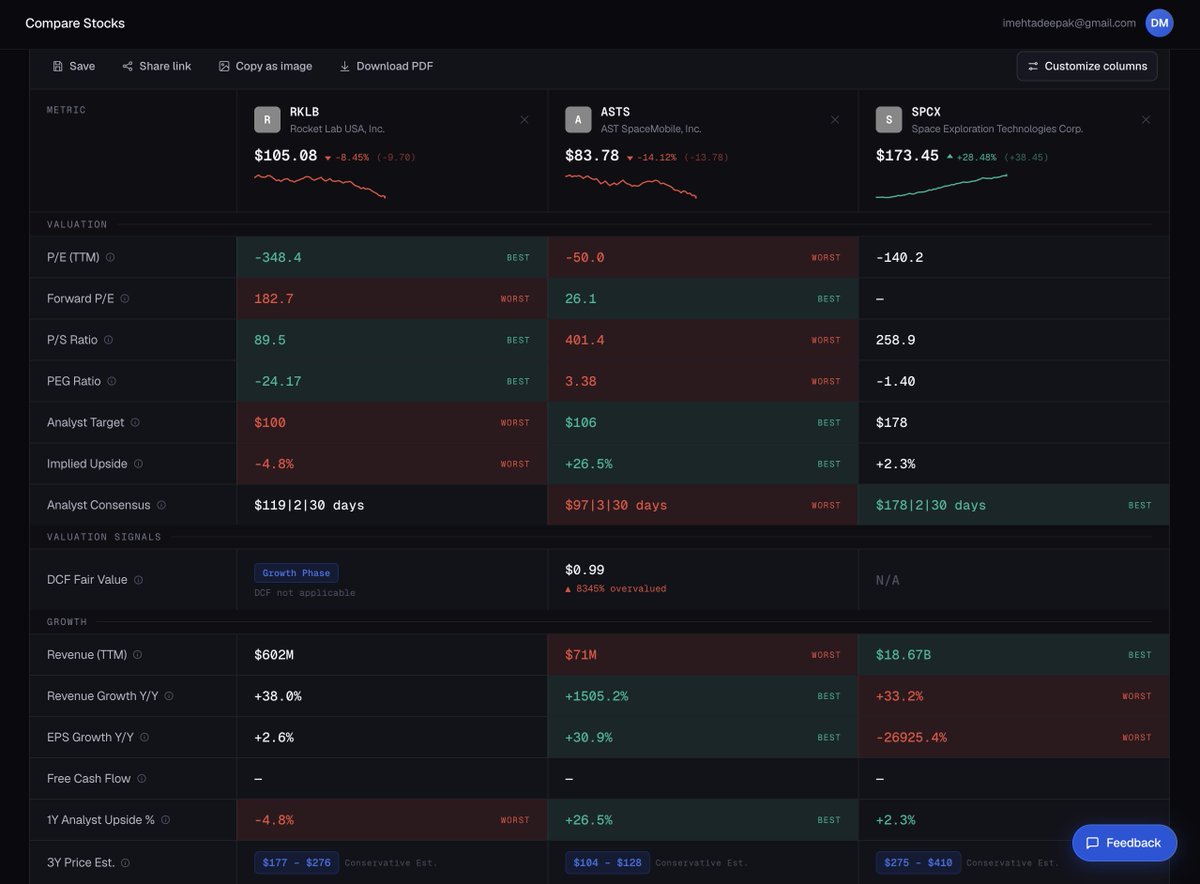
$SPCX is up 26% today while $RKLB and $ASTS are bleeding. Coincidence? The data says no.
The gap is wider than you think.
$RKLB
• $602M revenue | 36.6% gross margin
• Already launching rockets, already generating real revenue
• But trading ABOVE analyst target upside may be priced in
$ASTS
• 1505% revenue growth fastest in the group by a mile
• P/S at 401x market is pricing in a massive future, not the present
• Analysts still see 26.5% upside with a 3Y target of $104–$128
• Not a valuation play. A change the world or bust bet.
$SPCX
• $18.67B revenue dwarfs the other two combined
• Best gross margin at 50.3%
• 4.4% analyst upside still on the table after today's run
Winner on fundamentals? $SPCX and the market figured it out today.
Best growth story? $ASTS if you can stomach the risk.
Most balanced? $RKLB real business, real launches, real future.
Data via versys ai | Not financial advice .
2
456
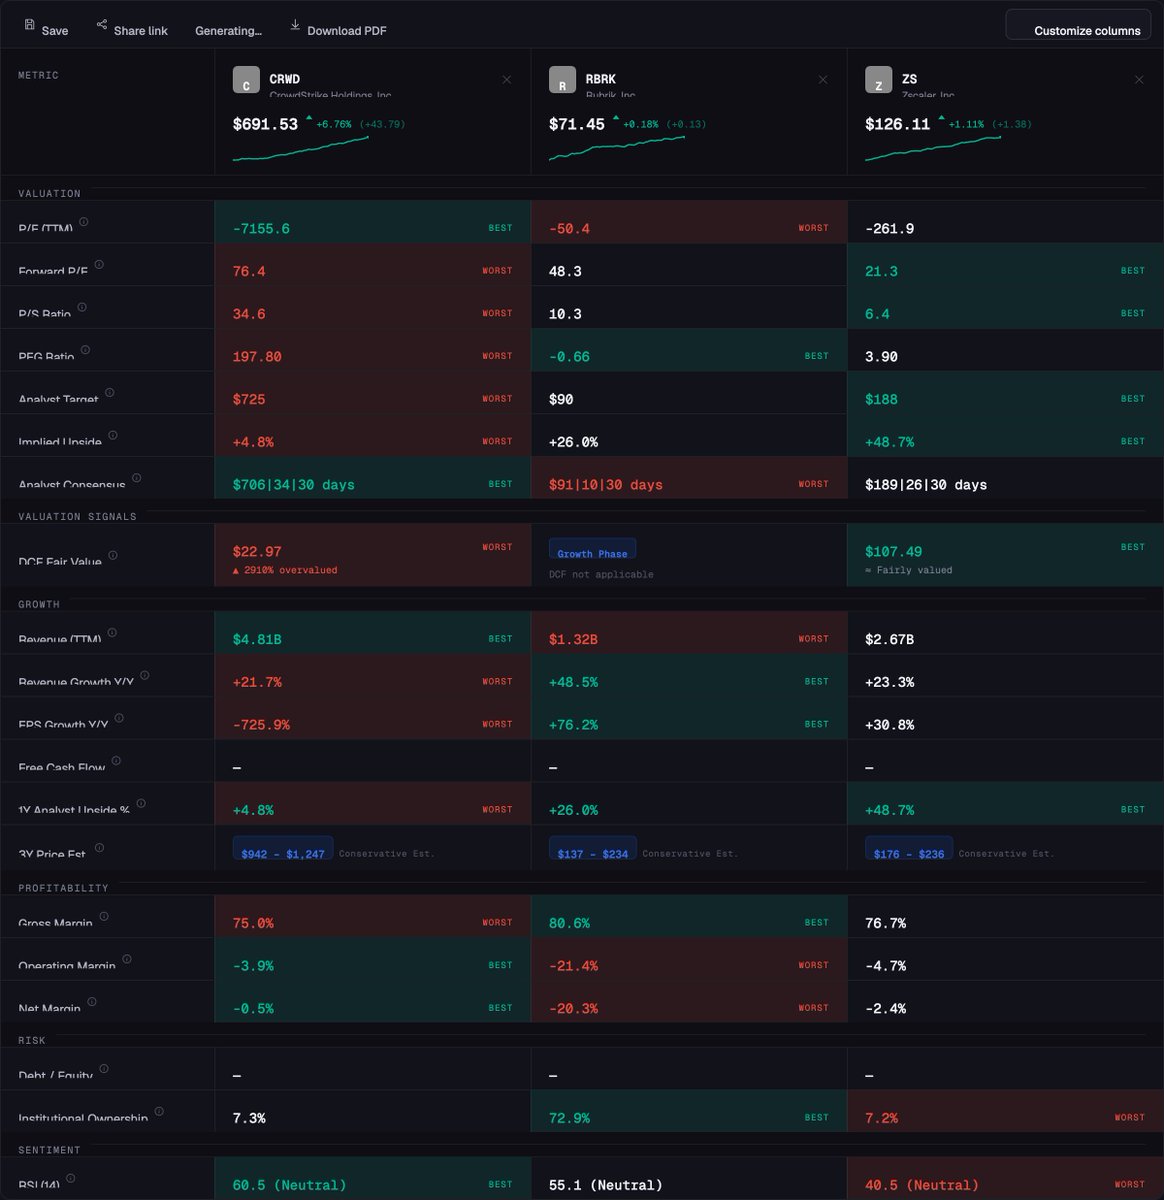
Comparing $CRWD, $RBRK and $ZS side by side, which one is the best ?
Everyone talks about the winner in cybersecurity, but the numbers tell a more nuanced story.
$CRWD
• Largest revenue base at $4.8B
• Premium valuation: 34.6x P/S, 76.4x Forward P/E
• Just ~5% analyst upside
• You're paying top dollar for the market leader.
$RBRK
• Fastest revenue growth: 48.5% YoY
• Highest gross margin: 80.6%
• Trades at 10.3x P/S, far below CRWD
• ~26% implied upside with strong growth.
$ZS
• Cheapest valuation of the three
• 6.4x P/S and 21.3x Forward P/E
• Highest analyst upside at ~49%
• Could be the value pick if execution improves.
takeaway:
If you want the safest leader → $CRWD
If you want growth at a reasonable price → $RBRK
If you want value with the biggest upside potential → $ZS
There’s no obvious winner. It depends on whether you’re buying quality, growth, or value.
4
431