
I analyze financial markets through psychology, behavior, price action, and fundamental developments to understand how perceptions shape market reality.
Joined May 2026
- Tweets 96
- Following 19
- Followers 7
- Likes 17
5 Photos and videos


Pinned Tweet

Jun 4
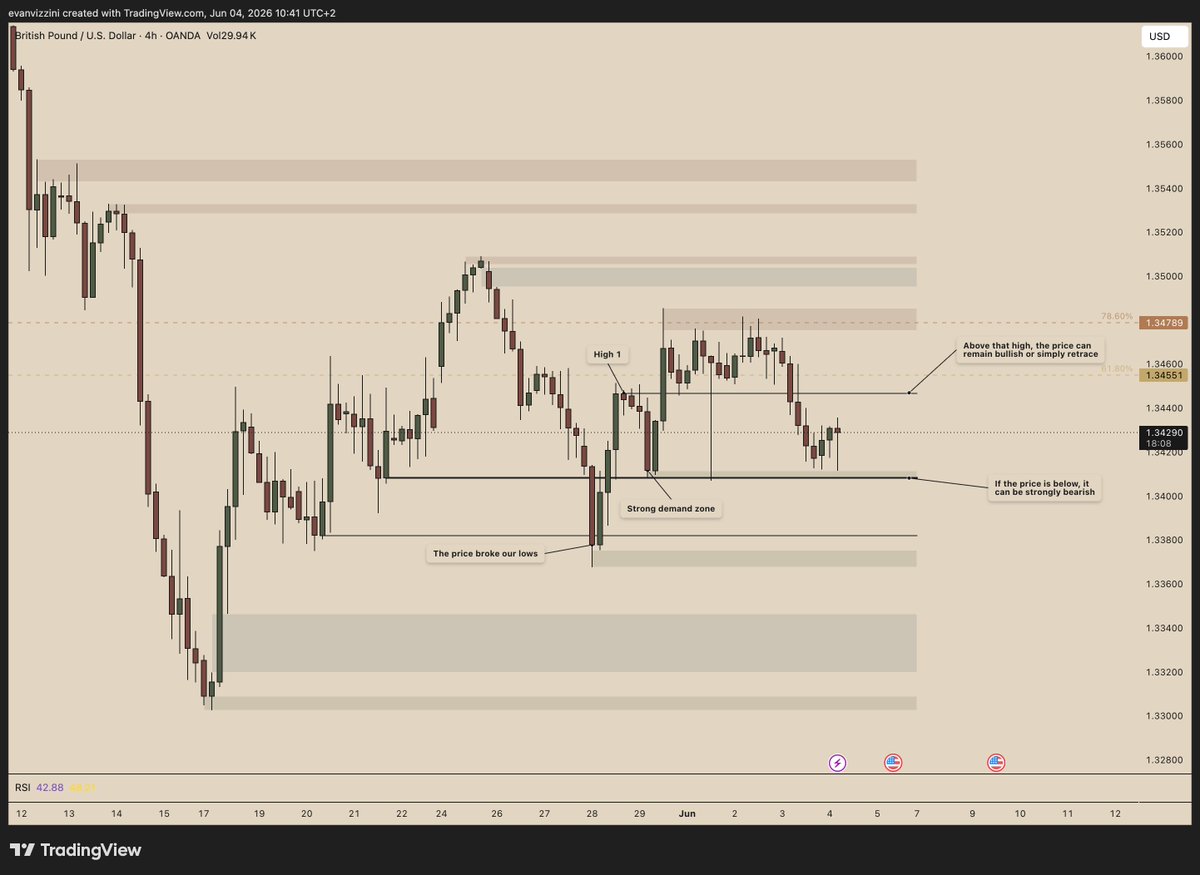
GBP/USD
According to a coherent and simple reading of the price action, several scenarios are emerging. First, a notable high formed on May 28, 2026 during the New York session (noted “High 1”) has been identified. If the price manages to move above this high, an uptrend could set in, insofar as this level has already been broken before, followed by a bullish range above it prior to a correction below. In that case, the price could advance toward the identified fair value gap and the gap located in the blue zone, potentially aiming for new highs. Furthermore, on June 3 (yesterday) between 7 p.m. and 11 p.m., the price closed above a significant lower low where strong buyers are present. This line constitutes a key boundary: below it, the price could drop sharply, while above it, it supports a bullish move. The darker black line represents a critical level — a former lower low that was cleanly broken and retested. Having reached the 78.60% and 61.80% Fibonacci retracement of the major trend we can identify (from the high of May 25 to the low of May 28), the price could resume its descent and target the substantial fair value gap located much lower, which appears particularly important.
Additionally, we can also identify that on May 28 at 3 a.m., the price — that is, the big, very violent candle — broke our two previous lows. So below the big dark black line, as I said before, the price will tend to be really bearish, and below the other line a bit lower, the price will also tend to be bearish, as I mentioned, to target the Fair Value Gap (blue zone), or why not even a new lower low.
This represents my personal vision and perception of the market. It is by no means trading signals or financial advice. It is solely a technical analysis based on my own perception and understanding of market dynamics. This is simply the sharing of my thoughts and perspective, which I hope may prove helpful to some of you.
tradingview.com/chart/GBPUSD…
54
10h
Oil is capitulating — and this may be the moment to pay attention
WTI has lost more than $14 in just a few days, falling from $91.62 last Thursday to $77.26 today. The immediate cause is the prospect of a peace agreement and the reopening of the Strait of Hormuz. But the author of this analysis points out an anomaly: before the war, oil was at $65. The conflict removed 10 to 12 million barrels per day from the market for approximately 100 days — more than a billion barrels that need to be rebuilt. The speed and magnitude of the current decline seem disconnected from this physical reality.
The signal is not fundamental — it is behavioral. The author identifies a classic capitulation pattern: short sellers celebrating their victory, bulls moving from denial to anger and then to abandonment. This type of dynamic, observable in the flow of comments and the speed of the drop, has historically been associated with market lows. Jeff Currie, former head of commodities at Goldman Sachs, adds a physical argument: flows through Hormuz will not normalize before the end of the year, and industrial buyers — such as German fuel importers — have deliberately emptied their stocks in anticipation of lower prices without yet restocking.
If the capitulation thesis is correct, the asymmetric risk on oil is starting to tilt upward. The market has already priced in a rapid reopening and normalization of supply — but neither is secured at this pace. The 60 million barrels that will come out of Hormuz upon reopening will create an initial flow, but the return of ships for new loadings will take time. For energy-related assets, a rebound in oil from these levels would quickly change the inflation calculation — partially invalidating the disinflationary narrative that bond markets have begun to integrate. The Fed tomorrow will view oil at $77 as an ally. It may not see it that low for very long.
The dynamic described here is one of the most reliable in behavioral market analysis: the moment when losers capitulate and winners parade is precisely when the move exhausts itself. Sellers at these levels are no longer speculators looking for a trade — they are longs being forced out. The selling pressure is emotional, not strategic. And when selling becomes emotional, it creates price levels that fundamentals do not justify — which then attracts opportunistic buyers. The dominant narrative “oil will continue to fall because peace is coming” may already be too consensual to remain profitable.
Source: Adam Button — Investing Live.
32
10h
Tariffs are hitting the cash register — and this is just the beginning
US import prices rose 1.9% in May, against 1.0% expected — double the estimate. Year-over-year, they are up 6.7%. The fuel component exploded by 47% over three months, the strongest since the post-Covid rebound in 2020. But the most worrying detail lies elsewhere: import prices excluding fuel are also accelerating, at 3.7% year-over-year — their fastest pace since August 2022. Consumer goods excluding automobiles jumped 0.5% for the month, a record since January 2024.
This report is the cleanest thermometer of the transmission of tariffs to the real economy. It measures prices at the border, before distribution margins and retail blur the signal. What it says is unambiguous: foreign exporters are no longer able to absorb the cost of tariffs alone — they are passing it on to American buyers. The double acceleration, both fuel and non-fuel, is a sign that imported inflationary pressure is becoming systemic rather than cyclical. The important caveat: WTI has fallen to $77.64, its lowest since March 10. If this level holds, the next monthly publications should mechanically decline on the energy component.
For the Fed, which meets tomorrow, this report comes at the worst possible time: it confirms that imported inflation remains aggressive precisely when the market hopes for a pivot signal. Bond yields could rise if the hawkish reading dominates — but the drop in oil offers a sufficiently credible disinflationary counter-narrative to limit the move. The dollar remains stable ahead of the decision, reflecting real indecision. For stocks, the combination of weak housing data and high import prices paints a discreet stagflationary environment: slowing activity, rising prices — exactly the scenario the Fed fears most.
Investors are caught between two incompatible readings published on the same day. Housing starts say: the economy is slowing, the Fed can breathe. Import prices say: inflation is not easing, the Fed cannot cut. This type of contradictory signal produces collective decision paralysis — no strong buying, no strong selling, just waiting. The Fed tomorrow will not resolve this contradiction: it will have to choose which data it highlights in its communication, and that rhetorical choice will be more important than the decision itself.
Source: Bureau of Labor Statistics — US Import and Export Price Index.
35
10h
US Construction Collapses — and the Market Listens
US housing starts fell well below expectations in May: 1.177 million annualized units versus 1.430 million expected, a 15.4% drop for the month. The bulk of the decline comes from the multifamily segment, which collapsed from 529,000 to 284,000 units — nearly halved. Single-family construction held up better, with only a slight decline. Building permits remained nearly stable, suggesting that builders’ intentions are still present even as actual activity slows markedly. Completions also fell 8.1% for the month and 14.2% year-over-year.
The gap between the actual figure and the estimate is the signal: -15.4% when the market expected -8.5% is a significant negative surprise. The relative resilience of single-family permits indicates that single-family home builders are not giving up — but multifamily developers are slamming the brakes hard. This segment is more sensitive to high financing rates and restrictive credit conditions. It is a leading indicator of the real transmission of monetary tightening into the economy: high rates are now concretely biting into construction activity.
The immediate reaction is clear: the Nasdaq flips into negative territory in pre-market, the S&P edges modestly lower, and bond yields dip slightly — the 10-year loses 2.7 basis points to 4.441%. This move reflects classic reasoning: weak economic data reduce the probability of further rate hikes and reinforce expectations of a more accommodative Fed down the line. For the real estate and construction sectors, the pressure is direct. For bonds, it provides modest technical support. Tomorrow’s FOMC will absorb these figures into its assessment — they do not force a pivot, but they add weight to the caution camp.
Investors are reading these data through two simultaneous and contradictory lenses. The first: the economy is slowing, which validates the idea that the Fed has tightened enough and can consider cuts. The second: a collapse in construction signals real fragility in demand and credit, which is not good news in itself. The drop in yields suggests that the first lens is currently dominating — buying bonds because you are selling growth. But this reading can reverse quickly if other data confirm a deeper-than-expected slowdown.
Source: US Census Bureau.
23
10h
Trump is selling peace, but hiding the contract
Donald Trump spoke about the ongoing agreement with Iran, confirming that a memorandum of understanding exists and that it will be formally presented in the coming days. The central message: Iran will never have a nuclear weapon. But the text of the agreement has not yet been made public. In parallel, Trump mentions the possibility of letting the exemptions on Russian oil expire and intensifying sanctions against Moscow — a distinct but connected geopolitical signal.
The absence of the text is the signal. Trump announces a historic agreement but refuses to disclose its content immediately, promising a press conference “in a few days.” JD Vance states that no American dollars will go to Iran, but a figure of $300 billion is circulating without official confirmation. This opacity creates an immediate gap between the political narrative — “total victory” — and the verifiable reality — unknown. For markets, which have already priced in de-escalation, this is a zone of vulnerability: if the text reveals a less solid agreement than announced, the reversal could be swift.
Oil remains the direct barometer. A credible and signed agreement on Friday maintains downward pressure toward $70. A disappointing text release or a collapse in negotiations would trigger a violent rebound in the geopolitical risk premium. The mention of Russian sanctions and the expiration of waivers on Russian oil introduces an additional variable: if Moscow loses its waivers, global supply contracts at the very moment the market anticipates a return of Iranian oil — two forces that could partially offset each other. For the dollar, de-escalation in the Middle East combined with pressure on Russia strengthens the narrative of American power, which technically supports the greenback in the short term.
Trump has long mastered the art of selling the announcement before the content. Markets know this, and that is precisely why they remain in suspense rather than openly celebrating. There is an installed cognitive distrust: every time the administration announces a “historic” agreement without showing the terms, experienced investors wait for the written version before repositioning. The $300 billion figure circulating — neither confirmed nor denied — fuels exactly the kind of rumor that keeps traders on edge. The optimism is real, but it is conditional and nervous.
Source: Donald Trump’s remarks transcribed — via Investing Live relayed by Adam Button
39
12h
SpaceX enters the global top 5 — and buys the AI that codes
SpaceX, Elon Musk’s rocket and satellite company, went public on Friday on the Nasdaq at $135 per share. In three sessions, the stock has risen more than 50%, bringing the company’s valuation to approximately $2,800 billion in pre-market trading on Tuesday — which would place it ahead of Amazon in fifth place worldwide. At the same time, SpaceX announces the acquisition of Anysphere, the developer of the AI-assisted coding application Cursor, for $60 billion in stock. Elon Musk, who holds more than 40% of the company, becomes the first trillionaire in history.
Two distinct signals of different natures. The first is market-related: the post-IPO momentum is exceptional in both scale and speed, amplified by SpaceX’s accelerated inclusion in the Nasdaq, FTSE, and MSCI indices — which forces passive funds to buy mechanically in the coming weeks, creating real but artificial structural demand. The second is strategic: the acquisition of Cursor positions SpaceX no longer as a diversified aerospace company in AI, but as an integrated player in artificial intelligence infrastructure — from orbital satellites to software development tools. This is a major narrative recomposition.
SpaceX’s entry into the global top 5 by market capitalization redistributes the weights of major indices and creates forced buying flows for passive funds — a mechanical effect that can prolong the rally regardless of fundamentals. The all-stock acquisition of Anysphere dilutes existing shareholders but avoids any cash outflow for a company that is still unprofitable. For the tech sector as a whole, the deal sends an aggressive valuation signal on AI assets — Cursor being implicitly valued at a level that will fuel comparables for other transactions. The trajectory of Anthropic and OpenAI toward their own IPOs this year is narratively strengthened: SpaceX has just demonstrated that a deep and hungry market exists.
What is happening around SpaceX is not fundamental analysis — it is structured euphoria. A loss-making company whose ambitions include a Martian colony of one million inhabitants is worth $2,800 billion after three days of trading. The market is not buying cash flows: it is buying a narrative, that of the iconic technological genius redefining multiple industries simultaneously. The Musk effect is an emotional multiplier that classic valuation models do not capture. Passive fund demand will mechanically prolong this dynamic, creating a dangerous self-validating loop: the rise attracts buyers, the buyers justify the rise. In this context, the moment when psychology shifts — if it shifts — will be brutal.
Source: Financial Times — Tim Bradshaw.
1
1
39
14h
Oil is searching for peace
The price of WTI crude continues its decline and is approaching a key support zone around $78 per barrel. The trigger is last week’s unexpected diplomatic breakthrough between the United States and Iran, which led traders to unwind their geopolitical risk-hedging positions. If the peace agreement is signed on Friday as expected and the Strait of Hormuz reopens to normal traffic, the natural reference price would be the pre-war level, around $70.
The signal is twofold. First, the speed of the reversal: the oil market had priced in a substantial war premium, and its abrupt unwinding exposes the scale of the repositioning required. Second, the immediate catalyst: tomorrow’s Fed decision. A falling oil market in a context of geopolitical de-escalation offers the Fed a welcome window of disinflation — but also a new parameter to integrate into an already complex equation. The residual risk is clear: if the US-Iran negotiations collapse before Friday, the oil rebound would be as brutal as the decline.
A normalization toward $70 per barrel represents a significant disinflationary shock for the entire global economy. For the Fed, it is a partial relief: pressure at the pump decreases, which mechanically reduces a highly visible component of inflation felt by households. For bonds, falling oil supports disinflation expectations and weighs on long-term yields. For currencies of exporting countries — ruble, Brazilian real, Norwegian krone — downward pressure intensifies. Oil companies and the energy sector of equity indices are absorbing a direct valuation shock. Gold, which had partially benefited from the geopolitical premium, could also correct marginally if the risk sentiment normalizes outright.
Oil traders have spent the past few months under a fear premium — that of a closed Hormuz, a global supply disruption, an uncontrollable escalation. The diplomatic resolution creates a collective relief effect that immediately translates into selling: unwinding hedges, taking protection profits, and repositioning for a less dangerous world. But this relief is fragile. The market knows that Friday’s signing is not yet secured, and that diplomatic history with Iran is full of reversals. The dominant psychology is one of conditional optimism — selling the fear, but keeping an eye on the exit door.
Source: Fundamental analysis on WTI by Giuseppe Dellamotta.
45
15h
Italy is burning oil, not its heart
Italian inflation accelerated in May to 3.2% year-over-year, from 2.7% in April. The confirmation of the preliminary figures by Istat holds no surprises. The increase is almost entirely driven by energy: unregulated energy products jumped 12.5% year-over-year, while regulated products rose 5.6%. Underlying inflation — which excludes energy and food — only increased modestly, from 1.6% to 1.7%.
The distinction is essential: it is not demand-driven inflation that is surging in Italy, but imported inflation from energy prices. The 0.5 point acceleration in one month is real, but its composition makes it less concerning for the ECB than an equivalent figure driven by wages or services. However, the slight rise in services inflation — from 2.4% to 2.8% — deserves to be monitored: this is where the structural inflationary persistence lies, the kind that monetary policy actually fights.
For the ECB, these Italian figures fit into a European picture where energy is doing the inflationary work in place of domestic components. This does not materially change the market’s anticipated rate cut calendar, but it complicates the narrative: cutting rates while the headline exceeds 3% in the eurozone’s third-largest economy requires a pedagogy that Frankfurt does not always appreciate. Italian sovereign spreads remain under passive surveillance — no immediate tension, but an Italian economy exposed to energy shocks is structurally more vulnerable to prolonged tightening of financial conditions.
A confirmed figure without surprises generates little reaction — that is the very essence of “already priced in.” But the underlying psychology is more subtle: every release showing headline inflation above 3% in Europe fuels a diffuse doubt about the ECB’s ability to cut without appearing premature. Markets are not panicking, but they are accumulating data that make the “disinflation underway” narrative increasingly difficult to maintain with conviction. The rise in services, even modest, is the line that hawkish investors are watching — it is their reserve argument if the ECB has to justify a pause.
Source: Istat - Italian National Institute of Statistics, relayed by Justine Low.
15
16h
Gold is coming home
Central banks around the world are repatriating their gold. They are withdrawing it from vaults in London and New York to store it on their own soil or in alternative locations such as Singapore and Hong Kong. France removed 129 tonnes from the New York Fed between July 2025 and January 2026 — realizing a €11 billion profit in the process thanks to a premium on gold in the United States linked to tariffs. India has reduced the share of its gold stored abroad from 55% to 22% in three years. According to the World Gold Council, 19% of central banks surveyed increased their domestic storage or diversified their storage locations over the past twelve months, compared to 7% the previous year.
Gold has already surpassed US Treasuries to become the world’s largest reserve asset. This massive repatriation is the next phase of that shift: central banks no longer just want to hold gold, they want to physically control it. The central signal is not technical — it is political. Distrust of the United States as a reliable custodian of foreign reserves has materialized enough to push even cautious institutions like the Banque de France or the RBI to act concretely. This is no longer an abstract geopolitical posture. It is a physical, measurable, irreversible reallocation.
Structural demand for gold remains supported, no longer just by purchases but now also by the logistical flows of repatriation, which create localized tensions on physical supply. The premium observed on gold in the United States — which the Banque de France exploited to its advantage — illustrates how geopolitical frictions translate into real price distortions. London retains its dominant liquidity with more than $200 billion in daily transactions, but its market share as a storage location is declining. Singapore and Hong Kong are emerging as credible alternatives, which could gradually fragment the geography of the gold market. For the dollar, this movement prolongs a slow erosion of its status as the ultimate reserve of confidence — not a collapse, but a documented, ongoing attrition.
What is happening here goes beyond portfolio management. Repatriating one’s gold is voting with one’s vaults. It is an act of institutional defiance — discreet, legal, but readable by all. The dominant psychology among these central banks is one of existential precaution: they do not necessarily believe in an immediate catastrophe scenario, but they refuse to depend on a jurisdiction whose political reliability has become uncertain. For private investors observing this movement, the validation effect is powerful: if the world’s most conservative institutions are physically moving their gold, the signal of systemic distrust is hard to ignore. It fuels a narrative of progressive dedollarization which, even if it remains slow, gains credibility every time a central bank acts in this direction.
Source: Financial Times — Leslie Hook (London) and Krishn Kaushik (Mumbai).
41
17h
The calculated silence of Bullock
Reserve Bank of Australia Governor Michele Bullock spoke at the press conference in a deliberately ambiguous tone. Inflation remains too high in her own words, but the flow of data is in line with the bank’s expectations. She does not close the door to further rate hikes if necessary, but does not announce them either. The institution chooses to observe before acting. News of a potential peace agreement in the Middle East is welcomed positively, as a easing in oil prices would relieve some of the inflationary pressure.
The real signal is the absence of a strong signal — and that is a strategic choice. The RBA is stepping back, into observation mode. Bullock acknowledges that the inflationary problem predated the Middle East conflict, which is a way of saying that the bank cannot count on geopolitics to do its job for it. Underlying inflation is exactly where the RBA expected it — neither a good nor a bad surprise. The market is currently pricing in about 13 basis points of hikes by the end of the year, and shifting toward 1 basis point of cuts as early as next August — a positioning that reflects almost zero conviction in either direction.
The Australian dollar should remain under moderate pressure in this wait-and-see environment. Without a clear hawkish signal, the rate differential with other currencies does not argue for a strong AUD. Australian bonds benefit from a context in which further hikes seem unlikely in the short term, which supports prices. For local stocks, an RBA on pause is technically favorable, but the explicit mention of an expected economic slowdown — assumed and desired by the bank — tempers any optimism. Bullock warned: the slowdown must come for inflation to ease. This is not an accident, it is policy.
Markets do not like ambiguity, but they know how to tolerate it when it is presented with authority. Bullock managed to say nothing new while maintaining her credibility. The key phrase — “people should not be surprised to see a slowdown” — is a rare form of painful transparency that few central bankers dare to express so directly. Psychologically, this anchors a narrative of consented sacrifice: the bank knows it is causing pain, it says so, and it continues. For investors, this type of discourse creates a state of passive vigilance — one does not position, one waits. Market pricing, almost flat on both hikes and cuts, perfectly illustrates this state of collective suspension.
Source: Remarks by Michele Bullock, Governor of the Reserve Bank of Australia, transcribed during a press conference.
37
17h
The Japan rally. But how far will it go?
The Bank of Japan has just raised its policy rate to 1%, a level not seen since 1995. This is a 25 basis point hike, widely anticipated by markets. It fits into the progressive normalization cycle started in 2024, after decades of negative or zero rates. The BoJ also confirmed that it will stop reducing its purchases of Japanese government bonds from April 2027, stabilizing these purchases at around 2,000 billion yen per month. The yen remained stable around 160.2 against the dollar after the announcement.
The signal is not the hike itself — it was expected — but the texture of the vote and the context in which it takes place. The decision was adopted by 7 votes to 1, with an explicit dissent linked to geopolitical risks in the Middle East and the war in Iran. This internal rebalancing within the monetary policy committee indicates that the BoJ is no longer as uniformly hawkish as it once was. At the same time, Governor Ueda was absent for health reasons, which introduces an unusual institutional variable. The real signal: the BoJ continues to normalize, but with less homogeneous conviction, in an external environment that is becoming more complicated.
The yen reacted little, confirming that the hike was fully priced in. For a significant move in the currency to occur, there would need to be either a rhetorical surprise during Uchida’s press conference or a signal on the timing of the next hike — October is mentioned by some economists. JGBs (Japanese government bonds) remain under surveillance: the decision to maintain purchases at 2,000 billion yen per month from 2027 constitutes an implicit floor that limits upward pressure on long-term yields. Japanese stocks, sensitive to the yen level and the cost of credit, are digesting a higher but not yet restrictive rate environment. Internationally, a structurally stronger yen in the longer term would weigh on the carry trade and could induce return flows to Japan — a dynamic to watch for emerging markets and yen-funded risky assets.
Markets absorbed this decision with an almost calculated indifference — not out of disinterest, but because anticipation had already done the work. This is the nature of predictable central banks: they move markets before they act, not when they act. The real psychological tension lies elsewhere. The 7-1 vote, the geopolitical dissent, the governor’s absence: three signals which, taken together, feed a discreet doubt about the solidity of the normalization cycle. Investors are not panicking, but they are listening to Uchida this afternoon with particular attention — looking less for confirmation than for an indication of fragility. The dominant narrative remains that of a Japan “returning to normal,” but this normality is now framed by a regional war, expensive oil, and a hospitalized governor. The market is not questioning the trajectory, but it is beginning to question its pace.
Source: Financial Times — Leo Lewis and David Keohane, Tokyo — published and updated June 16, 2026.
42
Jun 15
SpaceX is not telling a space story, but a story of euphoria
SpaceX’s IPO has triggered strong enthusiasm from retail investors, with a 16% rise in the first trades and a valuation now reaching nearly $2,000 billion. The move is driven by Elon Musk’s notoriety, a low float of shares available for trading, and the rapid inclusion of the stock in several indices. Despite questions about the business model and the real prospects of certain highlighted activities, investor demand remains extremely strong.
For equity markets, this IPO is a favorable short-term signal. It shows that demand for new issues remains strong and could facilitate the arrival of other major companies on the markets. It also confirms that capital continues to flow toward themes linked to technology, artificial intelligence, and projects perceived as transformative. On the other hand, this dynamic can also increase market concentration around a limited number of popular narratives, heightening the sensitivity of valuations to any shift in sentiment.
Investors do not seem to be buying SpaceX for what it is today, but for what they imagine it could become tomorrow. This is a fundamental difference. The more ambitious the story, the more room it leaves for projection. Elon Musk has long benefited from this ability to turn future hypotheses into narratives powerful enough to attract capital. In this type of market, the credibility of the story sometimes becomes more important than the visibility of results. The euphoria is therefore not based solely on SpaceX, but on the collective conviction that major technological stories will continue to create value.
Source: Market commentary published after SpaceX’s IPO, relayed by Adam Button
49
Jun 15
A market rise that inspires more relief than conviction
US markets closed sharply higher, with the Nasdaq up more than 3% and the S&P 500 gaining more than 1.5%. At first glance, the session looks like a massive return of risk appetite after the recent geopolitical tensions. Yet several elements beneath the surface tell a more nuanced story. US small caps closed far from their intraday highs, travel-related stocks erased part of their gains, and oil rebounded into the close after falling sharply earlier.
This session is positive for short-term market sentiment, but it does not yet validate a lasting regime change. The tech rebound shows that flows continue to concentrate on the structural winners of the current cycle. On the other hand, the behavior of oil, the dollar, the yen, and the euro suggests that markets are not fully convinced that geopolitical or energy risks have disappeared. If oil remains resilient despite hopes of de-escalation, inflation expectations and rate cut outlooks could remain more complex than some investors hope.
Markets love simple narratives. After several weeks of tensions, the ideal narrative was a quick return to normal: less geopolitical risk, lower oil, a stronger consumer, and a more resilient economy. Yet the reaction of the assets most sensitive to this scenario remains hesitant. This suggests that investors are participating in the rebound without fully believing in it. When conviction is strong, flows spread widely across the market. When conviction is weaker, money flows back to the already dominant themes. This is precisely what seems to have happened today.
Source: Market close commentary relayed by Adam Button
13
Jun 15
Copper is sending a message that the market is not yet fully listening to
Scotiabank has raised all of its copper forecasts and estimates that the market is entering a phase of structural deficit larger than most investors anticipate. According to its analysts, demand growth continues to outpace supply growth, while major producers are struggling to increase output. The bank even mentions the possibility of short-term tightness that could push copper toward $7 per pound, compared to a little over $6 currently.
The real signal is not the increase in price forecasts. The signal is that the copper market appears to be shifting from a cyclical imbalance to a structural one. For years, investors have assumed that high prices would naturally attract enough new projects to resolve shortages. Scotiabank argues that this mechanism is now working much more slowly. Mine development timelines, declining grades at existing deposits, and reduced investment are creating a situation where supply struggles to meet demand that continues to grow. The problem is therefore no longer just the lack of copper today, but the difficulty in producing more tomorrow.
If this reading is correct, copper could become one of the most strategic commodities in the coming years. This would support not only the metal’s price but also the valuations of producers exposed to this theme. Beyond the mining sector, the message also concerns electrical infrastructure, data centers, defense, and more broadly the electrification of the global economy. For markets, this means that an essential commodity could remain durably scarce even as demand linked to energy, artificial intelligence, and industrialization continues to advance. The main risk to this scenario would remain an economic slowdown strong enough to break global demand growth.
Investors have often been conditioned by decades of overcapacity in commodities. When a price rises, the reflex is to think that supply will eventually arrive. The market still seems to be looking at copper through this lens. Yet the narrative may be changing. The question is no longer just how much copper the world consumes today, but how much it will be able to produce in five or ten years. When markets realize that a problem is structural and not cyclical, valuations can be reassessed far more strongly than expected.
Source: Scotiabank analysis conducted by the metals team led by Orest Wowkodaw
1
49
Jun 15
The agreement holds — but its seams are already cracking
Less than 24 hours after the announcement of the US-Iranian agreement, an Israeli drone strike in southern Lebanon kills a driver. At the same time, a US military advisor indicates that ships should not attempt to cross the strait before the official signing on June 19 — directly contradicting Trump, who claimed on Truth Social that oil-laden ships were already beginning to cross via a secured 'southern highway.' US demining will only begin after the signing. WTI falls $4.77 to $80.11 despite these uncertainties.
Three simultaneous contradictions in less than an hour: Israel strikes Lebanon while the ink on the agreement is barely dry. A US military advisor contradicts Trump on the real state of the strait. And demining — a prerequisite for any real commercial reopening — has not yet begun. This is not normal implementation friction. It is a real-time illustration of the structural fragility identified in our previous analyses: an agreement that holds on paper but where every component remains contested on the ground.
The Trump / military advisor contradiction is particularly revealing. It suggests either disorganized communication within the US administration or Trump’s deliberate willingness to manage the narrative independently of operational reality — both options being problematic for the agreement’s credibility.
The market is quickly discovering what the Vizzini analysis identified as soon as the agreement was announced: the gap between 'signed agreement' and 'effective peace' is considerable. Israel did not sign this text. Netanyahu has shown no sign of wanting to comply with it. And Trump, who needs the agreement for his midterms, is managing the communication as a victory already won — while his own military advisors are recommending caution to shipowners.
This dissonance between political narrative and operational reality is precisely what creates the most brutal market reversals: when reality catches up with the narrative, the correction is proportional to the accumulated gap.
Source: Reuters / Investing Live, relayed by Adam Button.
49
Jun 15
The Monday rally: real, rational, and already partially priced in
Global markets advanced strongly on Monday at the start of the week, driven by the US-Iranian agreement on the Strait of Hormuz. S&P 500 1.3%, Nasdaq 2.2%, Stoxx 600 at a new all-time high, Nikkei 5%, Kospi 5.2%. Brent falls 4.8% to $83.15. Bond yields retreat — 10-year Treasuries at 4.45%, Bunds at 2.95%. The euro climbs back above 1.16 dollars. In parallel, SpaceX, which went public on Friday with a 19% jump, adds another 6.8% on Monday, amplifying the positive sentiment on tech.
Three distinct dynamics overlap in this rally, and confusing them would be an analytical error.
The first is geopolitical and energy-related: the Hormuz agreement reduces the risk of persistent inflation, pushes back central bank rate hike expectations, and improves growth prospects for oil-importing economies — Europe and Asia in the lead. This is rational, measurable, and already partially priced in.
The second is monetary: markets are pushing back their rate hike expectations. The Fed is no longer fully priced for a hike before March 2027, versus January expected last Friday. The BoE is pushing back its next hike from November to December. Lower oil mechanically eases the inflationary constraint on central banks — and bond markets have immediately incorporated it.
The third is structural and independent of Iran: the tech rally in Asia, particularly in Japan, reflects a rotation of flows toward AI and semiconductor stocks that predated the agreement. The Nikkei’s all-time high owes as much to Murata Manufacturing ( 18%) and SoftBank ( 10%) as to the drop in oil. Goldman Sachs explicitly identifies the overflow of flows from Korea and Taiwan toward Japan as the main driver — the agreement provided the pretext, not the cause.
For stocks, the rally is as sectoral as it is directional. European cyclicals and industrials ( 2%) directly benefit from improved growth prospects. Energy falls 3% — a mechanical corollary of the drop in oil. In Asia, aviation and transport soar on the prospect of normalizing jet fuel after months of disruptions. For the dollar, the combination of renewed risk appetite and pushed-back Fed rate expectations penalizes it. The euro above 1.16 reflects this dual effect. For gold, the geopolitical risk premium compresses, but real yields retreat simultaneously with falling bond yields — two opposing forces that explain a more moderate gold reaction than pure geopolitical logic would have suggested.
This rally is authentic in its direction, but its speed already incorporates a scenario of complete success of the agreement — demining, commercial reopening, maritime insurance restored, successful nuclear negotiations. Yet as previously analyzed, the agreement holds for 60 days, Israel did not sign, and demining takes at least 30 days. The market is buying the happy ending before seeing the full movie.
The SpaceX case perfectly illustrates the dominant mindset: a spectacular tech IPO in an improving geopolitical context creates a window of euphoria where investors maximize risk exposure simultaneously on multiple fronts. This is institutional FOMO in its purest form — and historically, these windows are shorter than they appear in the moment.
Source: Financial Times, Ian Smith and Ramsay Hodgson (London), Leo Lewis (Tokyo). Published and updated June 15, 2026.
103
Jun 15
Empire Fed: May's rebound evaporates, prices refuse to let go
The Empire Fed index for June stands at 5.7, far below the 14.0 expected and a sharp drop from May’s 19.6. New orders collapse from 22.7 to 3.5. Shipments retreat from 18.9 to 8.6. Activity remains in expansion — 29% of companies report improvement versus 23% reporting deterioration — but May’s rebound was clearly exaggerated. As the first regional indicator of the cycle, the Empire Fed is a leading signal for the national ISM Manufacturing.
Four simultaneous trends tell contradictory stories. Orders and shipments are falling sharply — demand is not collapsing, but momentum is disappearing. Employment is rising for the fifth consecutive month — the manufacturing labor market is holding up. Supply availability falls to its lowest since June 2022 — supply chains are tightening again, possibly due to the precautionary stockpiling identified in previous ISM and PMI reports. And prices paid remain anchored at 61.0 while prices received stagnate at 31.4 — a margin squeeze that has lasted for months. Even more significant: the index of future selling prices jumps to its highest since 2022. Manufacturers are signaling their intention to pass on tariff and war-related costs to customers over the next six months.
For the Fed and Wednesday’s FOMC, this report adds another layer of ambiguity. Slowing demand would argue for caution. Surging future prices argue for hawkish patience. Holding employment argues against any urgency to act. Warsh inherits a picture in which every indicator contradicts the next — exactly the context that justifies a neutral bias rather than a strong directional signal.
May’s spectacular rebound had fueled a narrative of manufacturing resilience. This reversal to 5.7 is a reminder that the rebound was itself likely distorted by precautionary stockpiling — exactly as we had identified in the British and US PMIs. Markets that had extrapolated May’s momentum will need to recalibrate.
The signal on future prices is the one the market will have the hardest time integrating correctly: in an environment where the Hormuz agreement creates hope for energy disinflation, US manufacturers are simultaneously signaling that they will raise their selling prices at the strongest pace since 2022. These two narratives cannot coexist indefinitely — one of them will have to give way.
Source: Federal Reserve Bank of New York, Empire State Manufacturing Survey — June 2026.
35
Jun 15
US Industrial Production: stagnation on the surface, mixed signal in depth
US industrial production rose 0.1% in May, below the 0.2% expected. The April figure was revised upward, from 0.7% to 0.9% — which improves the reading retrospectively. Manufacturing production was flat at 0.0%. The mining sector surprised to the upside ( 1.3%), while utilities declined (-0.4%). The capacity utilization rate stood at 76.2%, in line with expectations.
Three distinct dynamics lie beneath the headline. Manufacturing is stagnating — the tariff effect on autos and supply chain disruptions are weighing. The mining sector is outperforming, likely supported by higher oil prices and petrochemical demand linked to tensions over Hormuz — a war-related effect that will gradually dissipate if the agreement holds. Utilities are declining after an exceptional April — simple normalization. The upward revision to April is the real positive point: the starting point is better than announced, which changes the reading of the trajectory.
For the Fed, this report is neither strong enough to justify further tightening nor weak enough to reopen the debate on rate cuts. It confirms an industrial economy advancing at a reduced speed — consistent with the patience scenario that Warsh should establish on Wednesday at the FOMC. For industrial stocks, the stagnation in manufacturing amid persistent tariff pressures maintains pressure on margins. Autos remain depressed. Petrochemicals could normalize if oil declines with the reopening of Hormuz — which would paradoxically ease costs for part of the industrial sector. For the dollar, a report in line with revised expectations brings no strong directional catalyst.
This report will quickly be overshadowed by Wednesday’s FOMC and the week’s retail data. In a context where the Hormuz agreement monopolizes attention and Warsh is about to make his debut, industrial production at 0.1% is background noise — enough to confirm resilience, insufficient to change the narrative.
Source: US Federal Reserve, May 2026 industrial production. Relayed by Adam Button.
15
Jun 15
Central Banks Week: five meetings, one deal, and a Fed under new leadership
The week of June 15 is the densest of the year in terms of monetary policy: the BoJ, RBA, FOMC, SNB, and BoE all announce within a 72-hour window. In the background, the US-Iranian agreement signed on Friday reshuffles the cards on energy and global inflation. And at the center of it all: Kevin Warsh’s first FOMC meeting as the new Fed Chair.
Five central banks, but only one event that really matters: Wednesday’s FOMC. Not for the decision — no rate cut is expected — but for what Warsh will signal about the future direction. The market expects the removal of the accommodative bias from the statement, replaced by neutral language. The 2026 dot plot should eliminate the previously implied rate cuts. It is a tightening in tone without a tightening in rates — and in an environment where the Hormuz agreement could quickly ease inflationary pressures, the timing is deliberately cautious.
FOMC (Wednesday): The removal of the accommodative bias is the central signal of the week. But the irony is real: if the Hormuz agreement causes oil to sustainably decline, the Fed could find itself in a position to cut rates sooner than its new dot plot suggests. Warsh will need to communicate precisely so as not to lock the bank into a hawkish posture that the data could quickly invalidate. The dot plot and press conference will be scrutinized line by line.
BoJ (Tuesday): A 25 bps hike is expected, taking rates to 1.00%. The yen should not react strongly — global factors dominate. But the normalization trajectory remains intact, and a structurally stronger yen in the medium term remains the base case.
RBA (Tuesday): Status quo at 4.35%. The pause is justified by an April CPI slightly below expectations, but Westpac anticipates further tightening in the second half if the pass-through of costs to consumer prices is confirmed.
SNB (Thursday): Status quo at 0.00% — the SNB does not want to return to negative territory. The strong Swiss franc remains under surveillance, with particular attention to potential signals of FX intervention.
BoE (Thursday): Status quo expected, but the vote counts. The base case is 7-2 in favor of maintaining rates. If Megan Greene joins Huw Pill in the hawkish camp — or even other members — it would signal rising internal pressure for tightening, in a context where Wednesday’s inflation data and Thursday’s labor market figures will arrive just hours before the decision.
For currencies, the week is structured around the dollar: a hawkish Warsh strengthens the greenback, a more nuanced tone weakens it. The euro and the pound will be sensitive to their own inflation data. The yen will react to the BoJ but remain anchored to global dynamics.
The market is entering this week with two simultaneous and contradictory emotions: relief over the Hormuz agreement and anticipation of a rhetorical tightening by the Fed. These two forces pull in opposite directions on the same assets — bonds, dollar, gold. The risk is that investors overreact to each individual signal without integrating the overall coherence. Warsh’s first meeting is also an identity-positioning moment for the new Fed. Markets will decode every word to understand whether the new chair is more hawkish than Powell, more political, or more independent. This uncertainty about communication style adds a volatility premium beyond the factual content of the decision.
Source: Weekly market analysis for the week of June 15–19, 2026. Analytical contributions from Wells Fargo, Westpac, and ING.
103
Jun 15
The strait opens — the market breathes, but the real test begins
The United States and Iran have reached an agreement to reopen the Strait of Hormuz and extend the ceasefire for 60 days. Signing on Friday in Switzerland. Progressive reopening over 30 days, the time needed to clear the waters of mines. The United States is lifting its naval blockade. Iran reaffirms its renunciation of nuclear weapons and accepts discussions on its enriched uranium stockpile under IAEA supervision. In return, Washington grants Tehran the right to sell oil during the memorandum period. Immediate reaction: Brent -4.4% at $83.51, Nikkei 5%, US and European futures up.
This is the major geopolitical event of the year for energy markets. But three critical nuances temper the signal. First: the reopening will take at least 30 days — oil will not flow on Friday. Second: the agreement holds for 60 days, not indefinitely — the nuclear negotiations that follow are the real test, with 9,000 kg of enriched uranium including 440 kg at near-weapons grade. Third: Israel remains an uncontrolled variable — the strike on Beirut on Sunday nearly derailed everything at the last minute, and Netanyahu did not sign this text.
For oil, the direction is bearish in the medium term — but the pace will depend on effective demining, the resumption of maritime insurance, and the return of commercial shipowners. The initial 4-5% drop is justified; full normalization will take weeks. For the Fed, this is potentially the most significant development in months. Structurally lower oil eases inflation, unparalyzes the central bank, and reopens the window for rate cuts. If Brent stabilizes below $80, the stagflationary scenario fades — rate cut expectations will be recalibrated higher.
For gold, the geopolitical risk premium decreases but does not disappear — the agreement remains fragile over 60 days and the Fed remains under short-term inflationary constraint. Recalibration, not collapse. For stocks, the rally is logical and may continue: lower energy prices, improved margins, reduced transport costs. Direct beneficiaries: transport, aviation, chemicals, discretionary consumption. For the dollar, the effect is ambiguous: return of risk appetite and Fed cut expectations both work against the greenback.
The market is reacting today to a narrative, not yet to an operational reality. The agreement exists on paper — the signing has not taken place, demining has not begun, maritime insurance has not resumed. Monday’s rally is one of anticipation and relief, not normalization. What distinguishes it from previous false alarms: simultaneous confirmation by Pakistan, Qatar, Iran, and the United States. The credibility of the signal is qualitatively different from the Trump posts that were quickly denied in previous weeks — and the market feels it. Immediate behavioral risk: FOMO. Under-exposed investors will want to catch up quickly, creating a dynamic that can exceed what the fundamentals justify in the short term.
Source: Financial Times, Andrew England (London) and Najmeh Bozorgmehr (Tehran). Published June 14, 2026, updated June 15, 2026.
16
Jun 11
Hormuz closed: the market moves from a theoretical risk to a real disruption
Iran now asserts that the Strait of Hormuz is closed to all vessels until further notice and threatens to target any ship attempting to cross it. According to Iranian authorities, two vessels have already been struck after trying to pass. Even before this announcement, traffic was already sharply reduced due to military risks and the lack of insurance coverage for many ships. The new development is that Tehran is no longer just threatening: it now claims to be concretely implementing its closure policy.
Oil is naturally the first asset affected. A sustained closure of Hormuz directly threatens a key portion of global energy flows and maintains a significant risk premium on crude prices. Maritime transport and insurance costs could also continue to rise, even in the event of a future reopening, as insurers’ and shipowners’ confidence does not generally recover instantly. This situation may also revive global inflationary fears, complicate central banks’ outlooks, and weigh on risky assets. Conversely, safe-haven assets could see renewed demand if tensions continue to worsen.
The market is entering a new psychological phase. Until now, many investors viewed the closure of Hormuz as a threat intended to strengthen Iran’s negotiating position. Now, this threat appears to be turning into an operational reality. This shift is important because markets react more to regime changes than to events themselves. A theoretical threat can be ignored. Concrete action forces a recalculation of probabilities. The central question then becomes less about energy and more behavioral: how long are investors willing to believe that this crisis will remain contained?
Source: Article by Justine Low regarding Iran’s closure of the Strait of Hormuz, statements from the Iranian military command, claimed strikes against two vessels, and the potential implications for global energy flows, maritime transport, and negotiations between the United States and Iran.
33