
2,032 Photos and videos


I've said this MANY TIMES ,and I'LL SAY IT AGAIN.
Sell EVERYTHING when:
- Coinbase hits #1 on the App Store
- Taxi drivers brag about their bags
- Minecraft YouTubers launch tokens
- Your friend who never believed suddenly buys Ethereum
- Family members ask you for advice
- Everyone is making money
I’ll tell you when it’s time to sell.
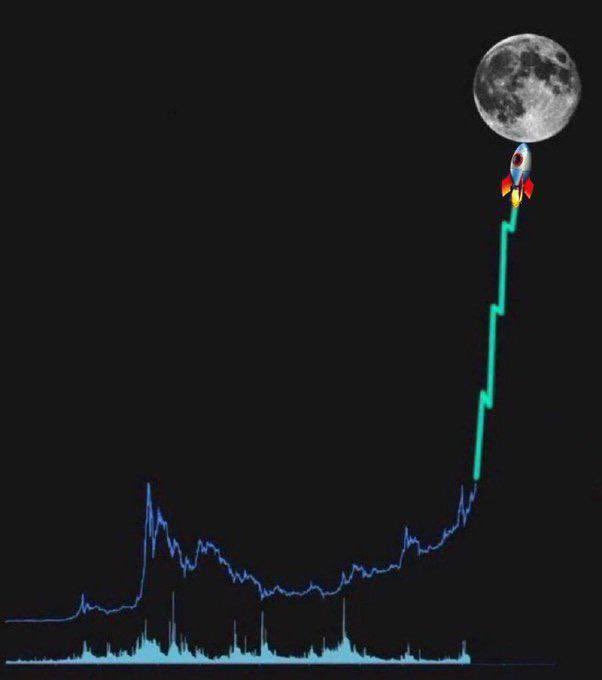
For now, the biggest bull market in history is only just beginning.
7
13
58
6,397
Volt ⚡ retweeted
🚨 THIS NUMBER SHOULD NOT EXIST
The U.S. housing market is now at the most unaffordable level in history.
Worse than the legendary 2006 housing bubble:
The median U.S. home now costs $436,000.
Five years ago? $270,000.
That’s a 61.5% price increase.
Wages over the same period? 29%.
To qualify for a mortgage on a median-priced home today, Americans need a minimum of $127,000 in household income.
The median household earns about $80,000.
That means 75% of homes on the market are unaffordable for the average American family.
3 out of 4.
Mortgage rates are the second punch.
They went from 2.7% to 6.3% in just five years.
Even if prices hadn’t moved, monthly payments would’ve nearly doubled.
And here’s the part nobody wants to say out loud:
On January 29th, Trump told his Cabinet he does not want housing prices to fall.
He wants them higher.
That’s great if you already own.
It’s brutal if you’re trying to buy your first home.
99% of U.S. counties are less affordable than their historical norms.
The country is short roughly 7.1 million homes.
And construction is slowing.
Existing home sales in 2025 are tracking around 4.1 million.
That’s near the lowest level in three decades.
Homeownership has fallen to 65%, down from 69% in 2004.
This is the largest affordability crisis in modern U.S. housing history.
Prices went up. Rates went up. Wages did not.
And politicians do not want prices to fall.
The average American family is not waiting for a better entry.
That is the trap. They are locked out of the market.
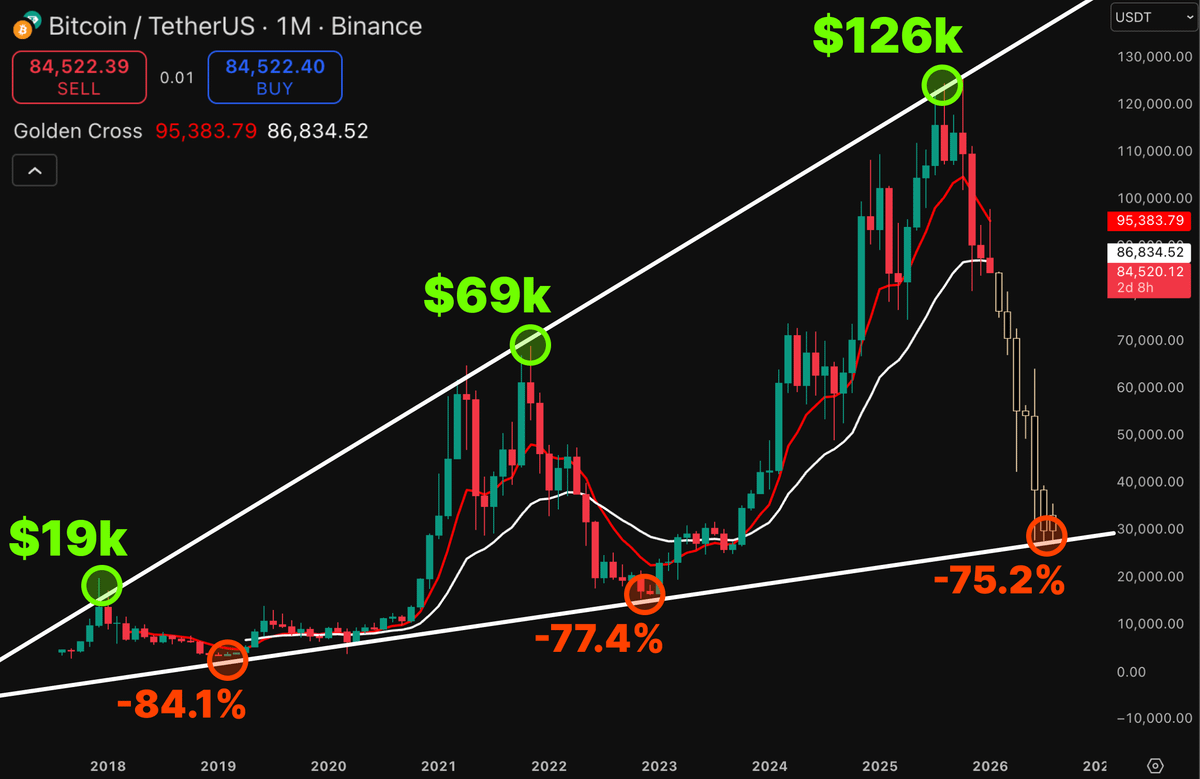
Reminder: I’ve called all the market tops and bottoms for the last 15 years, including the Bitcoin bottom at $16,000 and the top at $126,000.
The next call will be even more important.
When I exit the markets completely, I’ll post it here publicly like I always do.
Turn notifications on. If you’re not following yet, you’ll understand why that was a mistake later.

39
52
227
50,525
Volt ⚡ retweeted

Jun 12
🚨 SPACEX IS ABOUT TO REPEAT TESLA 2010
And nobody is ready for what will happen.
2010:
Tesla goes public.
$1.13 → $2.03
Everyone said the same thing:
“This is the future.”
“Elon is changing the world.”
Then came the part nobody talks about:
Tesla collapsed 50%.
$2.03 → $1.00
In days.
Now look at today:
2026:
– SpaceX just went public
– 30% from the IPO price at launch
– Biggest IPO in market history
– Everyone is calling it “the next Tesla”
But there’s one thing…
Tesla 2010:
- Small valuation
- Post-crash market
- Low expectations
- No trillion-dollar exit
SpaceX 2026:
- $1.75T IPO
- Retail access opened at the last second
- The stock market is at the most overvalued level in history
That is not the same opportunity.
Most people think Tesla 2010 means straight up forever:
Yes, Tesla pumped first.
Then it destroyed everyone who chased it.
That is the part they leave out.
Now SpaceX has the same Elon premium.
The same future narrative. But much worse timing.
So now you have two choices:
Chase the most expensive IPO in history after a 30% launch pump…
Or understand what Tesla 2010 already showed you.
Reminder: I’ve called all the market tops and bottoms for the last 15 years, including the Bitcoin bottom at $16,000 and the top at $126,000.
The next call will be even more important.
When I exit the markets completely, I’ll post it here publicly like I always do.
Turn notifications on. If you’re not following yet, you’ll understand why that was a mistake later.
203
334
1,960
2,131,184
Volt ⚡ retweeted
Jun 11
🚨 SOMETHING VERY STRANGE IS HAPPENING
SpaceX will go public tomorrow at a $1.75T valuation.
The biggest IPO in market history.
And Wall Street just changed the rules right before it happens.
I've been trading for more than 15 years and have never seen them rewrite the rules so urgently:
IPO access now lowered from $500,000 to $2,000 (-99.6% cut).
That means millions of investors can suddenly enter a deal and buy shares tomorrow.
One day before the most expensive IPO in history.
And suddenly...
SpaceX reserved up to 30% of the deal for regular investors.
Three times the normal share.
Why?
Because retail investors need to buy what insiders sell.
And here is the part most people are missing:
SpaceX does not just create demand for SpaceX.
It pulls liquidity out of everything else:
- Retail sells stocks to chase the IPO.
- Funds sell stocks to prepare for forced buying.
- Brokers open access to generate demand.
- Everyone needs cash at the same time.
That is why the market is selling now.
First, insiders create the hype.
Then brokers open the gates.
Then regular investors rush in.
And by the time the crowd realizes what happened, the exit door is already closed.
We’ve seen this before.
2000:
Dotcom IPOs became the symbol of the bubble.
Then Nasdaq collapsed 80%.
2021:
SPACs, Coinbase, Robinhood, Rivian.
Retail thought they were buying the future.
They were buying the exit.
Now the same playbook is back.
Only this time, it is much bigger.
When Wall Street cuts the entry ticket from $500K to $2K right before a $1.75T IPO, they are not giving retail a gift.
They are creating buyers.
Remember:
Insiders need liquidity.
Funds need allocation.
The market needs a dream.
And Wall Street needs someone to hold the bag.
That is what tomorrow is really about.
Reminder: I’ve called all the market tops and bottoms for the last 15 years, including the Bitcoin bottom at $16,000 and the top at $126,000.
The next call will be even more important.
When I exit the markets completely, I’ll post it here publicly like I always do.
Turn notifications on. If you’re not following yet, you’ll understand why that was a mistake later.
400
669
3,565
1,720,395
Volt ⚡ retweeted
Jun 10
I warned you about this dump.
Bitcoin is now following the path to the market cycle bottom:
June → Flat
July → Relief bounce
August → Dump to $50K
September → Fake bounce
October → Dump to $40K
November → Market cycle bottom
All according to plan.
Reminder: I’ve called all the market tops and bottoms for the last 15 years, including the Bitcoin bottom at $16,000 and the top at $126,000.
The next call will be even more important. I’ll post it here publicly like I always do.
Turn notifications on. If you’re not following yet, you’ll understand why that was a mistake later.

🚨 READ THIS CAREFULLY
Bitcoin is entering the most dangerous part of the cycle.
The phase that happens every time in mid-term years:
“Sell in May and go away.”
2014:
May drop → -61%
2018:
May drop → -65%
2022:
May drop → -66%
2026:
Mid-term year. Most traders think the bottom is in during this phase.
It isn’t.
2014: May top → drop
2018: May top → brutal drop
2022: May top → bloody drop
Based on the same mid-term structure:
-60.73% points to ~$47K.
That’s when bottoms form.… Narratives break… Everyone turns bearish…
We’re not there yet.
Yes, I started accumulating in the $60k range already.
Even though the timing window isn’t here yet.
Back in October, around $120k,
I said I’d be a strong buyer near $60k.
People laughed.
“BTC will never go below $100k again.”
Now we’re here.
Remember, I was the only one publicly calling the exact bottom at $16,000 three years ago and the top at $126,000 in October.
If you missed those calls, don’t worry. I’ll call the next one too.
Turn notifications on. If you’re not following yet, you’ll understand why that was a mistake later.
92
147
775
161,552
Volt ⚡ retweeted
This is exactly what I told you would happen.
The S&P 500 dump has started, but the real support level is still far below:
0.5 Fibonacci.
16 out of 17 ATHs ended there.
This time won’t be the exception.
Reminder: I’ve called all the market tops and bottoms for the last 15 years, including the Bitcoin bottom at $16,000 and the top at $126,000.
The next call will be even more important.
When I exit the markets completely, I’ll post it here publicly like I always do.
Turn notifications on. If you’re not following yet, you’ll understand why that was a mistake later.
May 31
🚨 S&P 500 JUST ENTERED A 94.1% TRAP
16 out of the last 17 midterm election years, the S&P 500 fell from May to October.
16 out of 17.
That is a 94.1% hit rate.
Some of the worst drops:
1974: -32%
2002: -30%
1962: -21%
1966: -21%
2022: -19%
May → October. Over and over again.
Now look at 2026:
Rate hikes are back on the table.
Inflation just hit its fastest pace in 3 years.
The 10Y yield is above 4.60%.
Mortgage rates are back above 6.5%.
War with Iran is escalating.
And the S&P 500 just hit a new all-time high.
The market gives you strength at the worst possible time.
Midterm year. Peak uncertainty.
Worst statistical window of the cycle.
And history says May to October is when this trap usually closes.
Reminder: I’ve called all the market tops and bottoms for the last 15 years, including the Bitcoin bottom at $16,000 and the top at $126,000.
The next call will be even more important.
When I exit the markets completely, I’ll post it here publicly like I always do.
Turn notifications on. If you’re not following yet, you’ll understand why that was a mistake later.
64
104
751
293,268
Volt ⚡ retweeted
🚨 IMPORTANT UPDATE
Bitcoin just entered the accumulation zone.
This is where I said I would start buying heavily.
But most people still don’t understand what it means.
Accumulation starts before the bottom.
Days from market cycle top → bottom:
2012: 405 days
2016: 362 days
2020: 376 days
We still haven’t reached the historical timing zone for the final bottom.
Based on cycle timing, the highest-probability window is still:
October–November 2026.
That matters more than any single level on your chart.
Most traders only think in price:
“I’ll buy at X.”
I don’t play that game.
The $60K range is where I start accumulating aggressively.
Autumn is where I expect the final bottom to form.
And this is the part most people get wrong.
They wait for the perfect bottom.
Then when it comes, they are too scared to buy.
Back in October, when Bitcoin was around $120K, I said I’d be a strong buyer near $60K.
People laughed.
Sentiment was euphoric:
“BTC will never go below $100K again.”
Now we’re here. Again.
And I’m doing exactly what I said I would do.
I’m accumulating.
But I’m not calling the final bottom yet.
There’s still one signal missing:
Net Unrealized Profit/Loss.
Every Bitcoin bottom happened when NUPL entered the capitulation zone:
2018. COVID. 2022.
We’re not there yet.
So my plan is simple:
$60K range: accumulate heavily.
Autumn: watch for the final bottom.
NUPL blue zone: full confirmation.
When the final bottom signal appears, I’ll post it here publicly like I always do.
Reminder: I’ve called all the market tops and bottoms for the last 15 years, including the Bitcoin bottom at $16,000 and the top at $126,000.
The next call will be even more important.
Turn notifications on. If you’re not following yet, you’ll understand why that was a mistake later.
May 11
🚨 READ THIS CAREFULLY
Everyone thinks Bitcoin is breaking out.
The chart says something completely different.
Bitcoin is now forming a Wyckoff accumulation pattern.
Most traders see accumulation and think the danger is over.
That’s exactly how they get trapped.
Bitcoin has already completed the first major reaction after the local high near $82.5K.
That is the Relief Rally phase.
And historically, this stage is followed by downside.
But the setup is not that simple:
- Drop toward $60K (finished)
- Secondary Test formation (completed)
- Bounce back above $75K (done)
- Re-sweep of the lows (next)
- Cycle bottom formation (coming)
That’s how accumulation works.
It doesn’t reward people who chase every bounce.
It rewards people who understand the structure.
Most traders only think in one direction:
“BTC is pumping. Bottom is in.”
Wrong.
Real accumulation is messy.
It shakes out early buyers.
It traps breakout traders.
It forces people to sell the bottom twice.
That’s why my main focus is still the same:
A potential <$50K bottom.
Not because Bitcoin is dead.
Because this is where the real accumulation phase can finish.
For the record, I was the only one publicly calling the exact bottom at $16,000 three years ago and the top at $126,000 in October.
If you missed those calls, don’t worry. I’ll call the next one too.
Turn notifications on. If you’re not following yet, you’ll understand why that was a mistake later.
56
67
537
98,276
Volt ⚡ retweeted
Everything is going according to plan.
Bitcoin entered the final stage of the bear market where the cycle bottom forms.
$59K → $61K → $65K → $55K → $47K → $200K
Next stops:
→ Relief to $65K (happening)
→ Dump to $47K (next)
Reminder: I’ve called all the market tops and bottoms for the last 15 years, including the Bitcoin bottom at $16,000 and the top at $126,000.
The next call will be even more important. I’ll post it here publicly like I always do.
Turn notifications on. If you’re not following yet, you’ll understand why that was a mistake later.
May 28
Bitcoin is preparing for the final dump before $200K.
The bear market is 65% done.
Now BTC is following the path I warned about:
$73K → $68K → $62K → $55K → $200K
Next stops:
→ $60K dump
→ Bear market bottom in October
Reminder: I’ve called all the market tops and bottoms for the last 15 years, including the Bitcoin bottom at $16,000 and the top at $126,000.
The next call will be even more important.
When I exit the markets completely, I’ll post it here publicly like I always do.
Turn notifications on. If you’re not following yet, you’ll understand why that was a mistake later.
146
254
1,598
437,888
Volt ⚡ retweeted
This is how I’ll know the exact Bitcoin bottom is in.
The 2022 pattern points to October–December.
And there is only one way to confirm it:
Sentiment.
Wait for the crowd to scream that Bitcoin is finished.
Wait for the loudest bulls to finally break.
And this cycle already has one perfect signal:
Michael Saylor.
The crowd was trained to believe he would never sell.
Strategy would always buy.
Institutions would always save Bitcoin.
That belief is the trap.
Retail always does the same thing:
They follow the loudest bull at the worst possible time.
When that bull breaks, retail breaks with him.
That is when sentiment hits the floor.
That is when we buy.
I’ll make sure you know when it happens.
Reminder: I’ve called all the market tops and bottoms for the last 15 years, including the Bitcoin bottom at $16,000 and the top at $126,000.
The next call will be even more important. I’ll post it here publicly like I always do.
Turn notifications on. If you’re not following yet, you’ll understand why that was a mistake later.
May 19
🚨 READ THIS TWICE
Bitcoin’s next cycle bottom won’t be where you think.
Everyone is focused on price.
Nobody is talking about timing.
Days from cycle top → bottom:
2012: 405 days
2016: 362 days
2020: 376 days
We haven’t entered the historical timing window yet.
The highest-probability zone for the real bottom:
July–November 2026.
That single fact matters more than any level on your chart.
Most traders think like this: “I’ll buy at $40K.”
But the zone that feels safe is exactly where people do nothing.
My rules are simple:
Below $60,000, I’m a buyer.
July–November 2026, I’m a buyer.
Either condition. No hesitation.
Yes, I already started accumulating when we entered the $60K range 3 months ago.
The timing window isn’t here yet. I don’t care. The price was right.
Back in October, when Bitcoin was around $120,000, I said I’d be a strong buyer near $60K.
People laughed. Sentiment was euphoric.
“BTC will never see $100K again.”
Now we’re here.
One more thing almost nobody is watching: NUPL.
Every generational bottom happened when NUPL entered the blue zone: 2018, 2022.
When we get there, you’ll know. I’ll make sure of it.
Remember, I was the only one publicly calling the exact bottom at $16,000 three years ago and the top at $126,000 in October.
If you missed those calls, don’t worry. I’ll call the next one too.
Turn notifications on. If you’re not following yet, you’ll understand why that was a mistake later.
63
43
396
87,708
Volt ⚡ retweeted
🚨 THIS IS NOT NORMAL
In the last 30 minutes:
Silver: -9.10%
Platinum: -5.90%
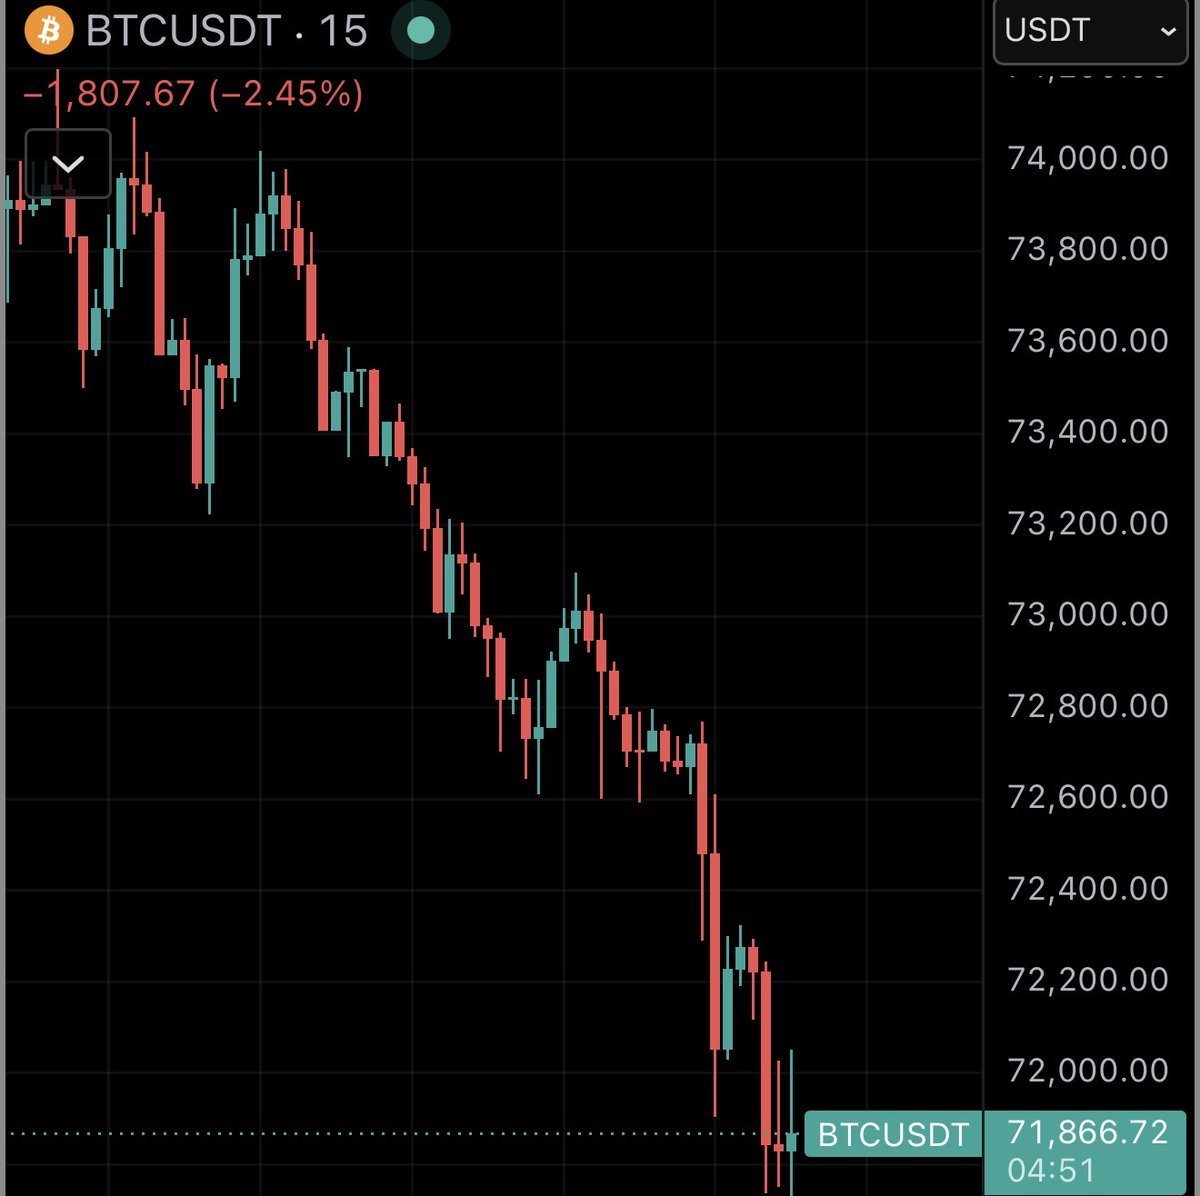
Bitcoin: -5.46%
Palladium: -4.79%
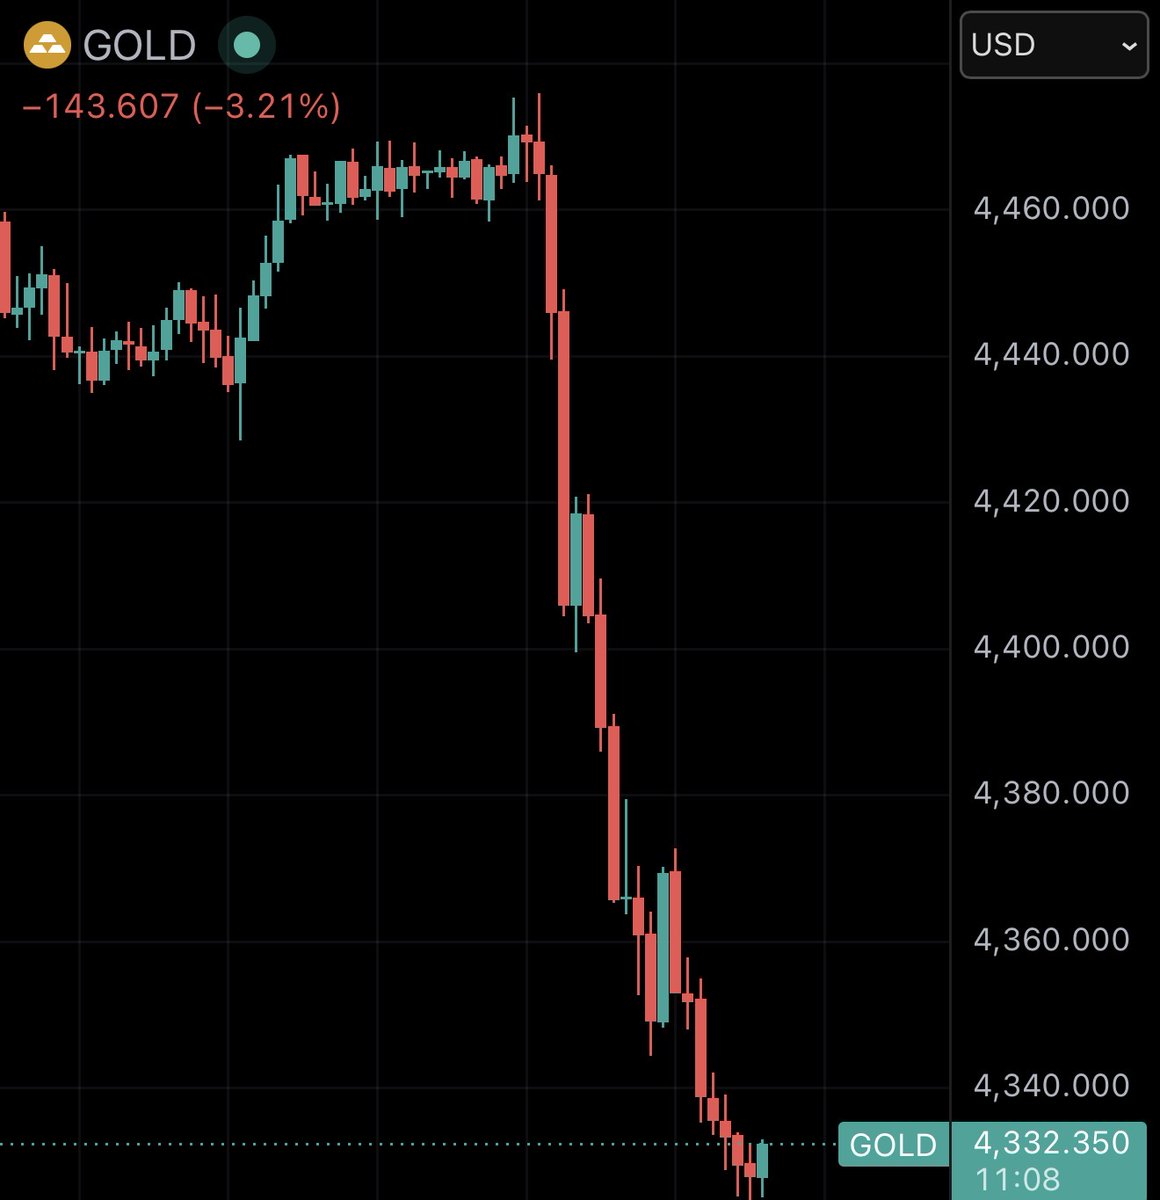
Gold: -3.71%
Trillions just disappeared from the market.
We’re moving into an extreme statistical event.
Something that has NEVER happened in the history of finance.
That’s more than the GDP of 99% of countries erased in minutes.
This is the start of a FORCED LIQUIDATION PHASE.
Liquidity is vanishing.
Funds are getting margin-called.
Positions are being closed.
They’re selling whatever still has value just to stay alive.
Reminder: I’ve called all the market tops and bottoms for the last 15 years, including the Bitcoin bottom at $16,000 and the top at $126,000.
The next call will be even more important.
When I exit the markets completely, I’ll post it here publicly like I always do.
Turn notifications on. If you’re not following yet, you’ll understand why that was a mistake later.

🚨 SILVER IS ABOUT TO REPEAT 2011
And nobody is ready for what will happen.
2011:
Recession → silver explodes.
Silver goes from $18 → $49.
Everyone said the same thing:
“Silver is just getting started.” “A shortage is coming.”
Then came the part nobody talks about:
Silver collapsed.
$49 → $30 in DAYS
Then → $15
Now look at today:
2026:
– Gold already made the move
– Silver accelerated
– “Undervalued vs gold, 1:15 ratio” everywhere
I’ve seen this movie before.
But here’s the trap:
People think silver is early.
That it still needs to “catch up.”
That the real move is ahead.
That’s EXACTLY what they said at $40 in 2011.
Here’s what most people don’t understand:
Silver doesn’t top when gold is falling.
It tops when leverage gets too large for the system to handle.
And silver is the MOST leveraged metal.
Small market.
Thin liquidity.
Explosive moves.
That means one thing:
When it turns…
There is no exit.
BTW, I’ve predicted all the market tops and bottoms for the last 15 years.
When I EXIT the markets completely, I’ll say it here publicly, like I always do.
Many people will wish they had followed me sooner.
167
420
2,212
716,102
Volt ⚡ retweeted
I warned you about this dump.
Bitcoin now follows the path to the market cycle bottom.
All according to the plan.
Reminder: I’ve called all the market tops and bottoms for the last 15 years, including the Bitcoin bottom at $16,000 and the top at $126,000.
The next call will be even more important. I’ll post it here publicly like I always do.
Turn notifications on. If you’re not following yet, you’ll understand why that was a mistake later.
🚨 READ THIS CAREFULLY
Bitcoin is entering the most dangerous part of the cycle.
The phase that happens every time in mid-term years:
“Sell in May and go away.”
2014:
May drop → -61%
2018:
May drop → -65%
2022:
May drop → -66%
2026:
Mid-term year. Most traders think the bottom is in during this phase.
It isn’t.
2014: May top → drop
2018: May top → brutal drop
2022: May top → bloody drop
Based on the same mid-term structure:
-60.73% points to ~$47K.
That’s when bottoms form.… Narratives break… Everyone turns bearish…
We’re not there yet.
Yes, I started accumulating in the $60k range already.
Even though the timing window isn’t here yet.
Back in October, around $120k,
I said I’d be a strong buyer near $60k.
People laughed.
“BTC will never go below $100k again.”
Now we’re here.
Remember, I was the only one publicly calling the exact bottom at $16,000 three years ago and the top at $126,000 in October.
If you missed those calls, don’t worry. I’ll call the next one too.
Turn notifications on. If you’re not following yet, you’ll understand why that was a mistake later.
Community note
No posts found prior to events where author called Bitcoin bottom at $16,000 or top at $126,000; claims began in May 2026. In October 2025, author predicted further upside instead. x.com/AlexMasonCrypt… x.com/AlexMasonCrypt…
204
170
1,942
1,154,158
Volt ⚡ retweeted
This is exactly what I told you would happen.
S&P 500 is at all-time highs, but the real macro support is still far below.
16 out of 17 midterm years proved one thing:
Every pump before the 200 EMA touch ended the same way.
Dump.
Reminder: I’ve called all the market tops and bottoms for the last 15 years, including the Bitcoin bottom at $16,000 and the top at $126,000.
The next call will be even more important.
When I exit the markets completely, I’ll post it here publicly like I always do.
Turn notifications on. If you’re not following yet, you’ll understand why that was a mistake later.
May 31
🚨 S&P 500 JUST ENTERED A 94.1% TRAP
16 out of the last 17 midterm election years, the S&P 500 fell from May to October.
16 out of 17.
That is a 94.1% hit rate.
Some of the worst drops:
1974: -32%
2002: -30%
1962: -21%
1966: -21%
2022: -19%
May → October. Over and over again.
Now look at 2026:
Rate hikes are back on the table.
Inflation just hit its fastest pace in 3 years.
The 10Y yield is above 4.60%.
Mortgage rates are back above 6.5%.
War with Iran is escalating.
And the S&P 500 just hit a new all-time high.
The market gives you strength at the worst possible time.
Midterm year. Peak uncertainty.
Worst statistical window of the cycle.
And history says May to October is when this trap usually closes.
Reminder: I’ve called all the market tops and bottoms for the last 15 years, including the Bitcoin bottom at $16,000 and the top at $126,000.
The next call will be even more important.
When I exit the markets completely, I’ll post it here publicly like I always do.
Turn notifications on. If you’re not following yet, you’ll understand why that was a mistake later.
88
180
1,423
1,060,428
Volt ⚡ retweeted
Everything is going according to the plan.
2018 → 2022 → 2026
Bitcoin cycle bottom will look exactly like this.
Reminder: I’ve called all the market tops and bottoms for the last 15 years, including the Bitcoin bottom at $16,000 and the top at $126,000.
The next call will be even more important. I’ll post it here publicly like I always do.
Turn notifications on. If you’re not following yet, you’ll understand why that was a mistake later.
May 28
Bitcoin is preparing for the final dump before $200K.
The bear market is 65% done.
Now BTC is following the path I warned about:
$73K → $68K → $62K → $55K → $200K
Next stops:
→ $60K dump
→ Bear market bottom in October
Reminder: I’ve called all the market tops and bottoms for the last 15 years, including the Bitcoin bottom at $16,000 and the top at $126,000.
The next call will be even more important.
When I exit the markets completely, I’ll post it here publicly like I always do.
Turn notifications on. If you’re not following yet, you’ll understand why that was a mistake later.
74
110
1,177
603,964
Volt ⚡ retweeted
🚨 I WARNED YOU. RIGHT BEFORE THIS DUMP.
But most people ignored it.
And now the crash is here.
Bitcoin dropped to $70K.
Over $500M in longs wiped out in hours.
Many hope this is just a temporary correction.
But the macro tells a different story:
PPI just jumped to 6%.
The fastest pace since COVID.
That killed any hope of rate cuts.
And to make things worse, Fed Chair Warsh is hawkish:
Higher-for-longer rates and balance sheet shrinkage.
10Y yields above 4.6%. Capital is flowing out of risk assets.
Spot ETF outflows are at historic highs.
The crowd is praying for a quick bounce.
They will be deeply disappointed.
This is just the beginning of the real move down.
Most people will realize it only when it's too late.
For the record: I’ve called all the market tops and bottoms for the last 15 years, including the Bitcoin bottom at $16,000 and the top at $126,000.
If you missed those calls, don’t worry. I’ll call the next one too.
Turn notifications on. If you’re not following yet, you’ll understand why that was a mistake later.
May 11
🚨 READ THIS CAREFULLY
Everyone thinks Bitcoin is breaking out.
The chart says something completely different.
Bitcoin is now forming a Wyckoff accumulation pattern.
Most traders see accumulation and think the danger is over.
That’s exactly how they get trapped.
Bitcoin has already completed the first major reaction after the local high near $82.5K.
That is the Relief Rally phase.
And historically, this stage is followed by downside.
But the setup is not that simple:
- Drop toward $60K (finished)
- Secondary Test formation (completed)
- Bounce back above $75K (done)
- Re-sweep of the lows (next)
- Cycle bottom formation (coming)
That’s how accumulation works.
It doesn’t reward people who chase every bounce.
It rewards people who understand the structure.
Most traders only think in one direction:
“BTC is pumping. Bottom is in.”
Wrong.
Real accumulation is messy.
It shakes out early buyers.
It traps breakout traders.
It forces people to sell the bottom twice.
That’s why my main focus is still the same:
A potential <$50K bottom.
Not because Bitcoin is dead.
Because this is where the real accumulation phase can finish.
For the record, I was the only one publicly calling the exact bottom at $16,000 three years ago and the top at $126,000 in October.
If you missed those calls, don’t worry. I’ll call the next one too.
Turn notifications on. If you’re not following yet, you’ll understand why that was a mistake later.
70
84
708
285,120
Volt ⚡ retweeted
🚨 THIS IS NOT GOOD
Bitcoin just collapsed.
Price dropped over 5% in the last 30 minutes.
Reports say Michael Saylor’s Strategy has started selling Bitcoin.
That kind of intervention changes the market forever.
For years, the market believed Saylor was the ultimate buyer.
Now even that machine needs cash.
Billions of dollars wiped out.
We are approaching an extreme psychological event.
Something most people thought would NEVER happen.
The largest Bitcoin holder on earth just became a seller.
We have officially entered the FORCED LIQUIDATION PHASE.
This is what a real bear market looks like.
Retail is still screaming “institutional adoption.”
But institutions are already selling into them.
Do not hand them your wealth.
Reminder: I’ve called all the market tops and bottoms for the last 15 years, including the Bitcoin bottom at $16,000 and the top at $126,000.
The next call will be even more important.
When I exit the markets completely, I’ll post it here publicly like I always do.
Turn notifications on. If you’re not following yet, you’ll understand why that was a mistake later.

90
49
332
54,883
Volt ⚡ retweeted
May 31
🚨 S&P 500 JUST ENTERED A 94.1% TRAP
16 out of the last 17 midterm election years, the S&P 500 fell from May to October.
16 out of 17.
That is a 94.1% hit rate.
Some of the worst drops:
1974: -32%
2002: -30%
1962: -21%
1966: -21%
2022: -19%
May → October. Over and over again.
Now look at 2026:
Rate hikes are back on the table.
Inflation just hit its fastest pace in 3 years.
The 10Y yield is above 4.60%.
Mortgage rates are back above 6.5%.
War with Iran is escalating.
And the S&P 500 just hit a new all-time high.
The market gives you strength at the worst possible time.
Midterm year. Peak uncertainty.
Worst statistical window of the cycle.
And history says May to October is when this trap usually closes.
Reminder: I’ve called all the market tops and bottoms for the last 15 years, including the Bitcoin bottom at $16,000 and the top at $126,000.
The next call will be even more important.
When I exit the markets completely, I’ll post it here publicly like I always do.
Turn notifications on. If you’re not following yet, you’ll understand why that was a mistake later.
Apr 28
🚨 S&P 500 IS BEING MANIPULATED, AND I HAVE PROOF
Everyone is watching the price.
Almost nobody is watching the volume.
Price is going up. Volume is not.
That’s not organic demand.
That’s price being pushed on low liquidity.
We’ve seen this exact setup before:
Early 2025: Low-volume rally → price goes up → sell-off
Look at what’s happening right now:
– Price grinding higher
– Volume staying weak
– No real buyers
Now add the macro:
A global oil crisis.
1990 (Gulf War): Oil spike → S&P -20%
2008: Oil → $147 → S&P -57%
2022: Oil 70% → S&P -28%
When volume returns, it won’t be buyers.
It will be sellers.
Remember, I’ve predicted all the market tops and bottoms for the last 15 years, including the exact Bitcoin bottom at $16,000 three years ago and the top at $126,000 in October.
If you missed those calls, don’t worry. I’ll call the next one too.
Turn notifications on. If you’re not following yet, you’ll understand why that was a mistake later.
50
82
415
1,388,026
Volt ⚡ retweeted
May 30
🚨 GOLD IS ABOUT TO REPEAT 1979
And nobody is ready for what will happen.
1979:
Iran War → oil explodes
Gold goes from $200 → $850
Everyone thought it was the beginning.
Then came the part nobody talks about:
A new Fed Chair took power.
Rates went up to 20%.
Liquidity got demolished.
Gold dumped: $850 → $300
Now look at today:
2026:
- War with Iran (happening)
- Oil up aggressively (done)
- Inflation creeping back (starting)
- Fed rate hikes (next)
But here’s where people get trapped:
They think gold = safety.
True, gold doesn’t die when the crisis ends.
It dies when central banks react.
And we’re getting close to that point again.
25% of the world’s oil is being held hostage at one chokepoint.
Inflation is picking up.
Rate hikes are already being discussed again.
And a new Fed Chair is already in power at the worst possible time.
This is how 1979 started.
Gold first looked like the safest trade in the world.
Then the Fed destroyed the trade.
That’s the part nobody is ready for.
Reminder: I’ve called all the market tops and bottoms for the last 15 years, including the Bitcoin bottom at $16,000 and the top at $126,000.
The next call will be even more important.
When I exit the markets completely, I’ll post it here publicly like I always do.
Turn notifications on. If you’re not following yet, you’ll understand why that was a mistake later.
168
150
961
245,570
Volt ⚡ retweeted
May 29
🚨 FACT: BITCOIN HAS FOLLOWED ONE RULE FOR 7 MONTHS
Touch the upper resistance → dump:
$126K touched → dumped to $87K.
$97K touched → dumped to $62K.
$82K touched → dump started immediately.
Each bounce is lower than the previous one.
Each rejection is faster than the previous one.
This time BTC didn’t even wait.
The move down started immediately.
Final bottom: October.
That’s where this cycle ends.
Reminder: I’ve called all the market tops and bottoms for the last 15 years, including the Bitcoin bottom at $16,000 and the top at $126,000.
The next call will be even more important.
Turn notifications on. If you’re not following yet, you’ll understand why that was a mistake later.
May 11
🚨 READ THIS CAREFULLY
Everyone thinks Bitcoin is breaking out.
The chart says something completely different.
Bitcoin is now forming a Wyckoff accumulation pattern.
Most traders see accumulation and think the danger is over.
That’s exactly how they get trapped.
Bitcoin has already completed the first major reaction after the local high near $82.5K.
That is the Relief Rally phase.
And historically, this stage is followed by downside.
But the setup is not that simple:
- Drop toward $60K (finished)
- Secondary Test formation (completed)
- Bounce back above $75K (done)
- Re-sweep of the lows (next)
- Cycle bottom formation (coming)
That’s how accumulation works.
It doesn’t reward people who chase every bounce.
It rewards people who understand the structure.
Most traders only think in one direction:
“BTC is pumping. Bottom is in.”
Wrong.
Real accumulation is messy.
It shakes out early buyers.
It traps breakout traders.
It forces people to sell the bottom twice.
That’s why my main focus is still the same:
A potential <$50K bottom.
Not because Bitcoin is dead.
Because this is where the real accumulation phase can finish.
For the record, I was the only one publicly calling the exact bottom at $16,000 three years ago and the top at $126,000 in October.
If you missed those calls, don’t worry. I’ll call the next one too.
Turn notifications on. If you’re not following yet, you’ll understand why that was a mistake later.
55
54
375
104,369
Volt ⚡ retweeted
May 28
Bitcoin is preparing for the final dump before $200K.
The bear market is 65% done.
Now BTC is following the path I warned about:
$73K → $68K → $62K → $55K → $200K
Next stops:
→ $60K dump
→ Bear market bottom in October
Reminder: I’ve called all the market tops and bottoms for the last 15 years, including the Bitcoin bottom at $16,000 and the top at $126,000.
The next call will be even more important.
When I exit the markets completely, I’ll post it here publicly like I always do.
Turn notifications on. If you’re not following yet, you’ll understand why that was a mistake later.
May 19
🚨 READ THIS TWICE
Bitcoin’s next cycle bottom won’t be where you think.
Everyone is focused on price.
Nobody is talking about timing.
Days from cycle top → bottom:
2012: 405 days
2016: 362 days
2020: 376 days
We haven’t entered the historical timing window yet.
The highest-probability zone for the real bottom:
July–November 2026.
That single fact matters more than any level on your chart.
Most traders think like this: “I’ll buy at $40K.”
But the zone that feels safe is exactly where people do nothing.
My rules are simple:
Below $60,000, I’m a buyer.
July–November 2026, I’m a buyer.
Either condition. No hesitation.
Yes, I already started accumulating when we entered the $60K range 3 months ago.
The timing window isn’t here yet. I don’t care. The price was right.
Back in October, when Bitcoin was around $120,000, I said I’d be a strong buyer near $60K.
People laughed. Sentiment was euphoric.
“BTC will never see $100K again.”
Now we’re here.
One more thing almost nobody is watching: NUPL.
Every generational bottom happened when NUPL entered the blue zone: 2018, 2022.
When we get there, you’ll know. I’ll make sure of it.
Remember, I was the only one publicly calling the exact bottom at $16,000 three years ago and the top at $126,000 in October.
If you missed those calls, don’t worry. I’ll call the next one too.
Turn notifications on. If you’re not following yet, you’ll understand why that was a mistake later.
185
226
1,601
1,461,868
Volt ⚡ retweeted
May 28
I warned you the S&P 500 crash is coming.
Dot-com bubble → Today
The final phase always looks the same.
Reminder: I’ve called all the market tops and bottoms for the last 15 years, including the Bitcoin bottom at $16,000 and the top at $126,000.
The next call will be even more important.
When I exit the markets completely, I’ll post it here publicly like I always do.
Turn notifications on. If you’re not following yet, you’ll understand why that was a mistake later.
Apr 28
🚨 S&P 500 IS BEING MANIPULATED, AND I HAVE PROOF
Everyone is watching the price.
Almost nobody is watching the volume.
Price is going up. Volume is not.
That’s not organic demand.
That’s price being pushed on low liquidity.
We’ve seen this exact setup before:
Early 2025: Low-volume rally → price goes up → sell-off
Look at what’s happening right now:
– Price grinding higher
– Volume staying weak
– No real buyers
Now add the macro:
A global oil crisis.
1990 (Gulf War): Oil spike → S&P -20%
2008: Oil → $147 → S&P -57%
2022: Oil 70% → S&P -28%
When volume returns, it won’t be buyers.
It will be sellers.
Remember, I’ve predicted all the market tops and bottoms for the last 15 years, including the exact Bitcoin bottom at $16,000 three years ago and the top at $126,000 in October.
If you missed those calls, don’t worry. I’ll call the next one too.
Turn notifications on. If you’re not following yet, you’ll understand why that was a mistake later.
53
54
286
94,077
Volt ⚡ retweeted
May 27
This is why Bitcoin won’t hit $100K this year:
Bitcoin has spent the last 2 months inside an ascending channel.
Slow higher highs. Fake strength.
Retail is being trapped.
The first target was the CME gap at $82K.
Filled.
Then immediate rejection happened.
This was a textbook trap before the next leg down.
My plan for the next 3 months is simple:
- Breakdown from the ascending channel (in progress).
- Dump toward $70K (next).
- New lows around $60K (soon).
Reminder: I’ve called all the market tops and bottoms for the last 15 years, including the Bitcoin bottom at $16,000 and the top at $126,000.
The next call will be even more important.
When I exit the markets completely, I’ll post it here publicly like I always do.
Turn notifications on. If you’re not following yet, you’ll understand why that was a mistake later.
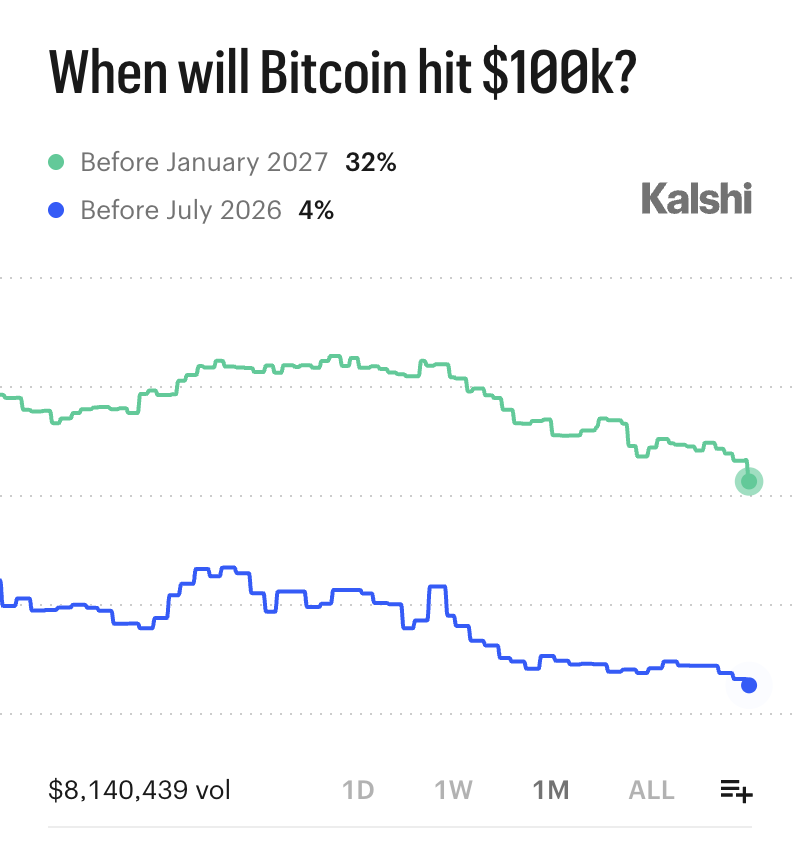
May 27

BREAKING: 32% chance Bitcoin hits $100,000 this year
4% chance it happens next month

67
81
399
119,249