
Find us on other social media platforms where we are actively posting | Online courses for PhDs and researchers | Workshops and commission collaborations.
Joined April 2014
- Tweets 522
- Following 680
- Followers 342
- Likes 60
506 Photos and videos


Dear friends and followers! We have decided to focus on our other social media platforms for now so we will not be posting here anymore. You can find us on Linkedin, Instagram, Threads, Facebook and Bluesky instead. We hope you join us there!
44
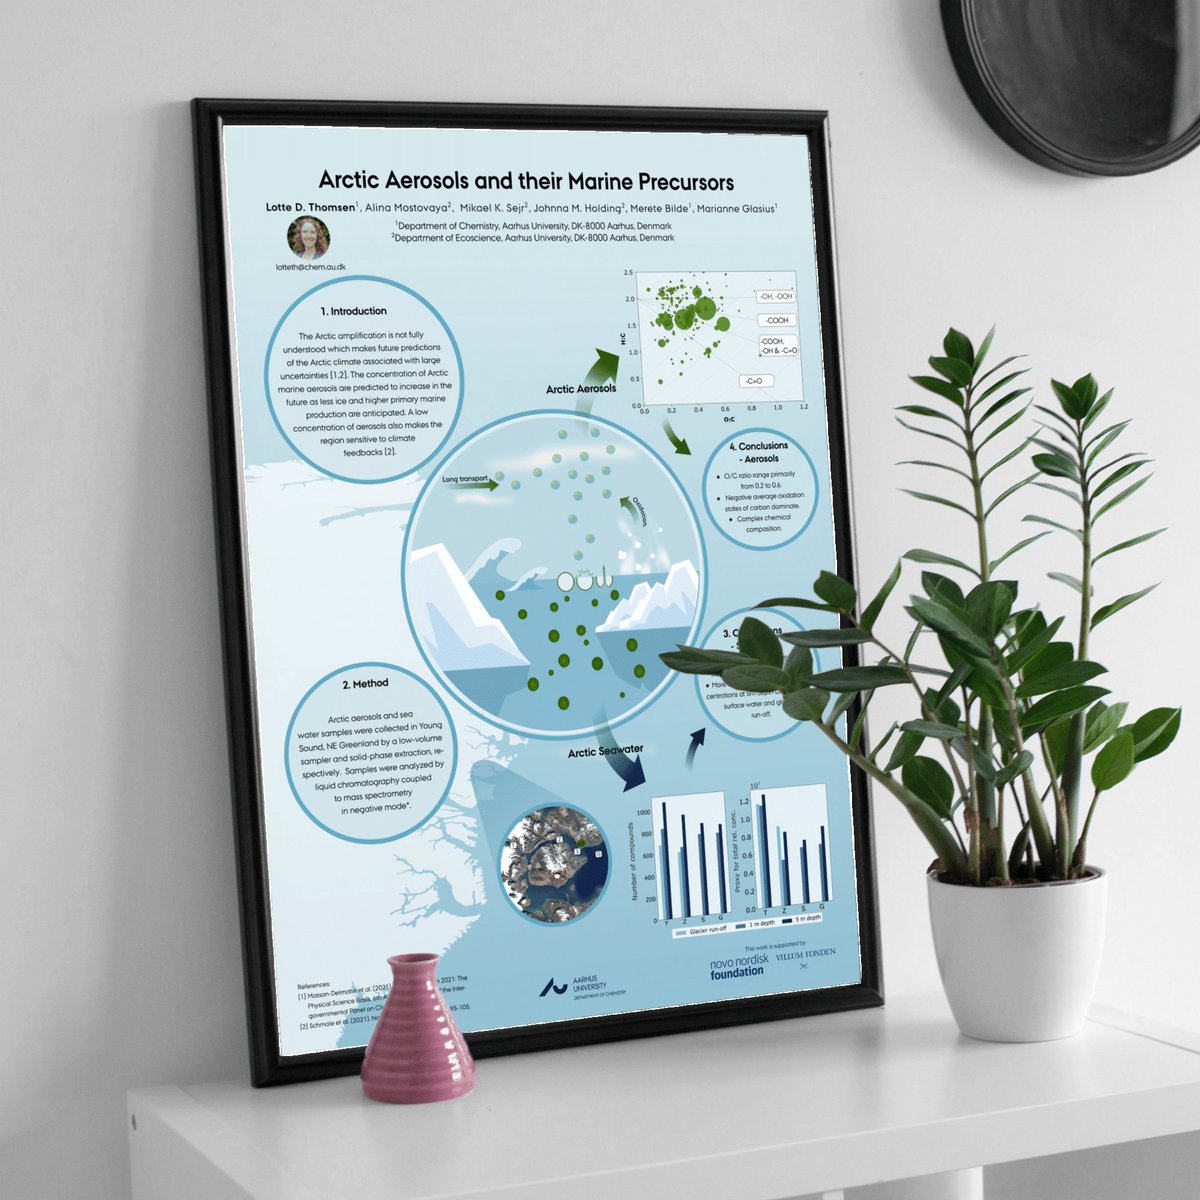
Welcome to the poster wall Lotte Thomsen from @AarhusUni! Less is more on this simple, yet elegant poster and we are happy to feature it on our poster wall. Great job Lotte!
Check out the poster in more detail here:
bit.ly/3AIUTzp?utm_campaign=…
#VisualizeYourScience
1
68
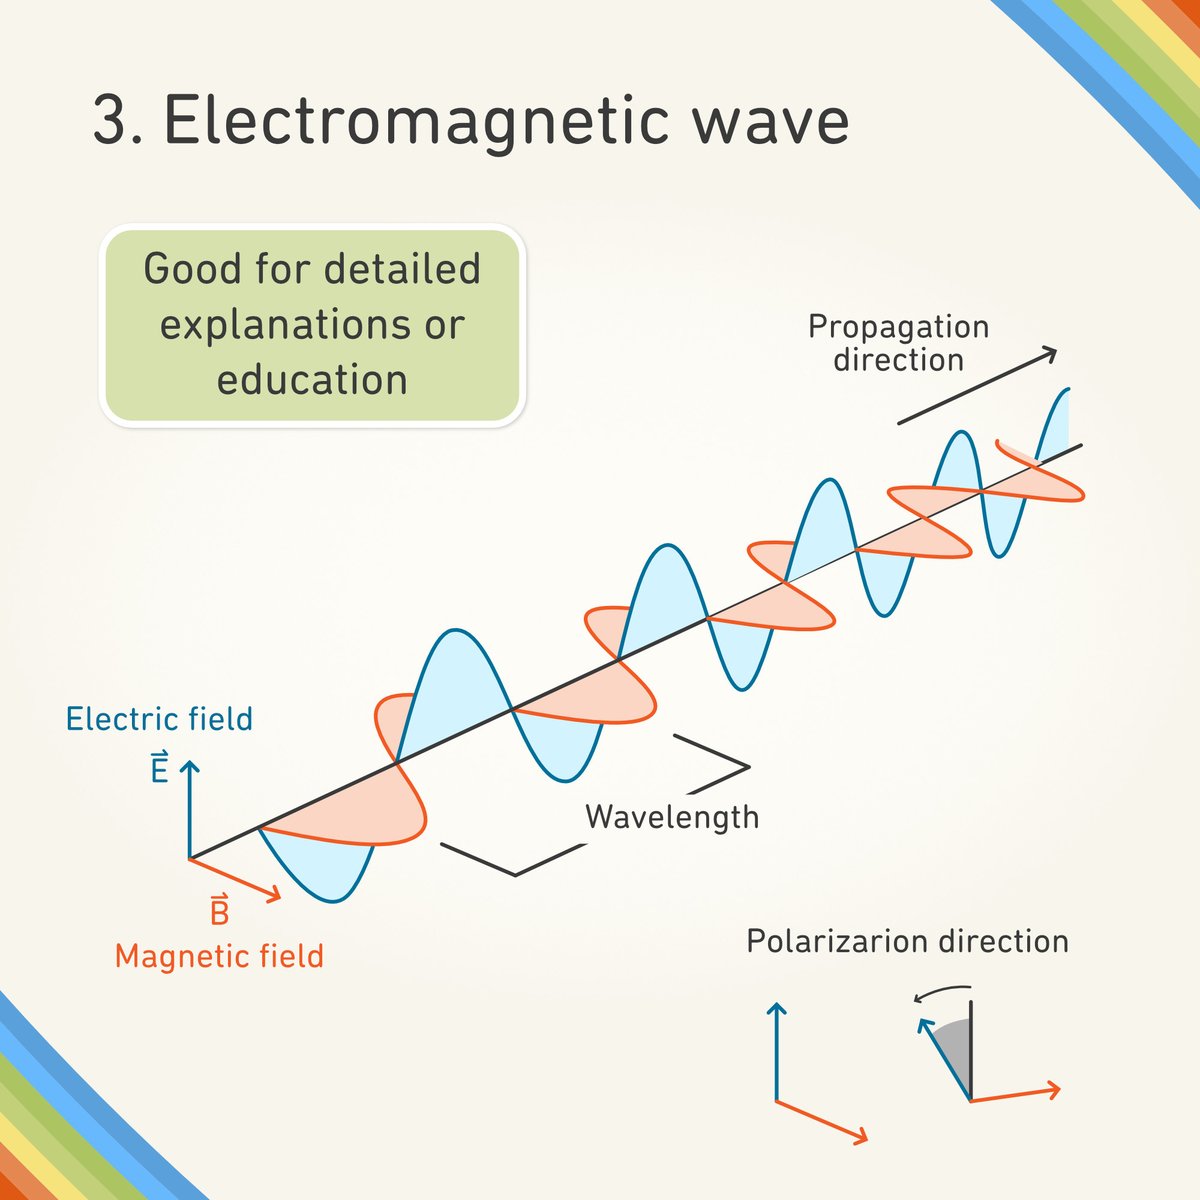
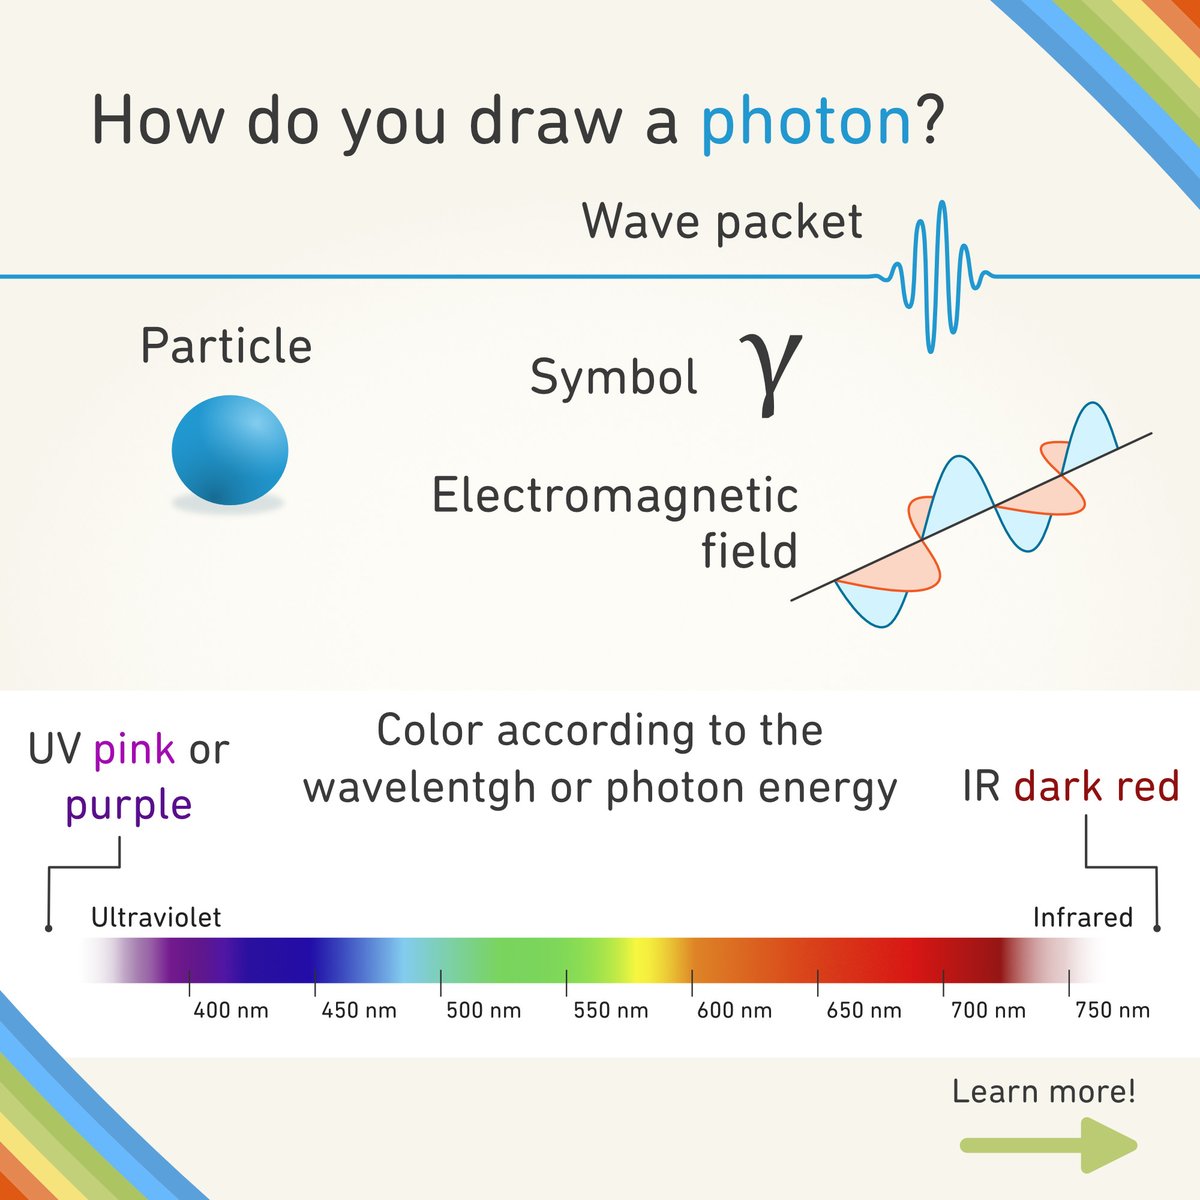
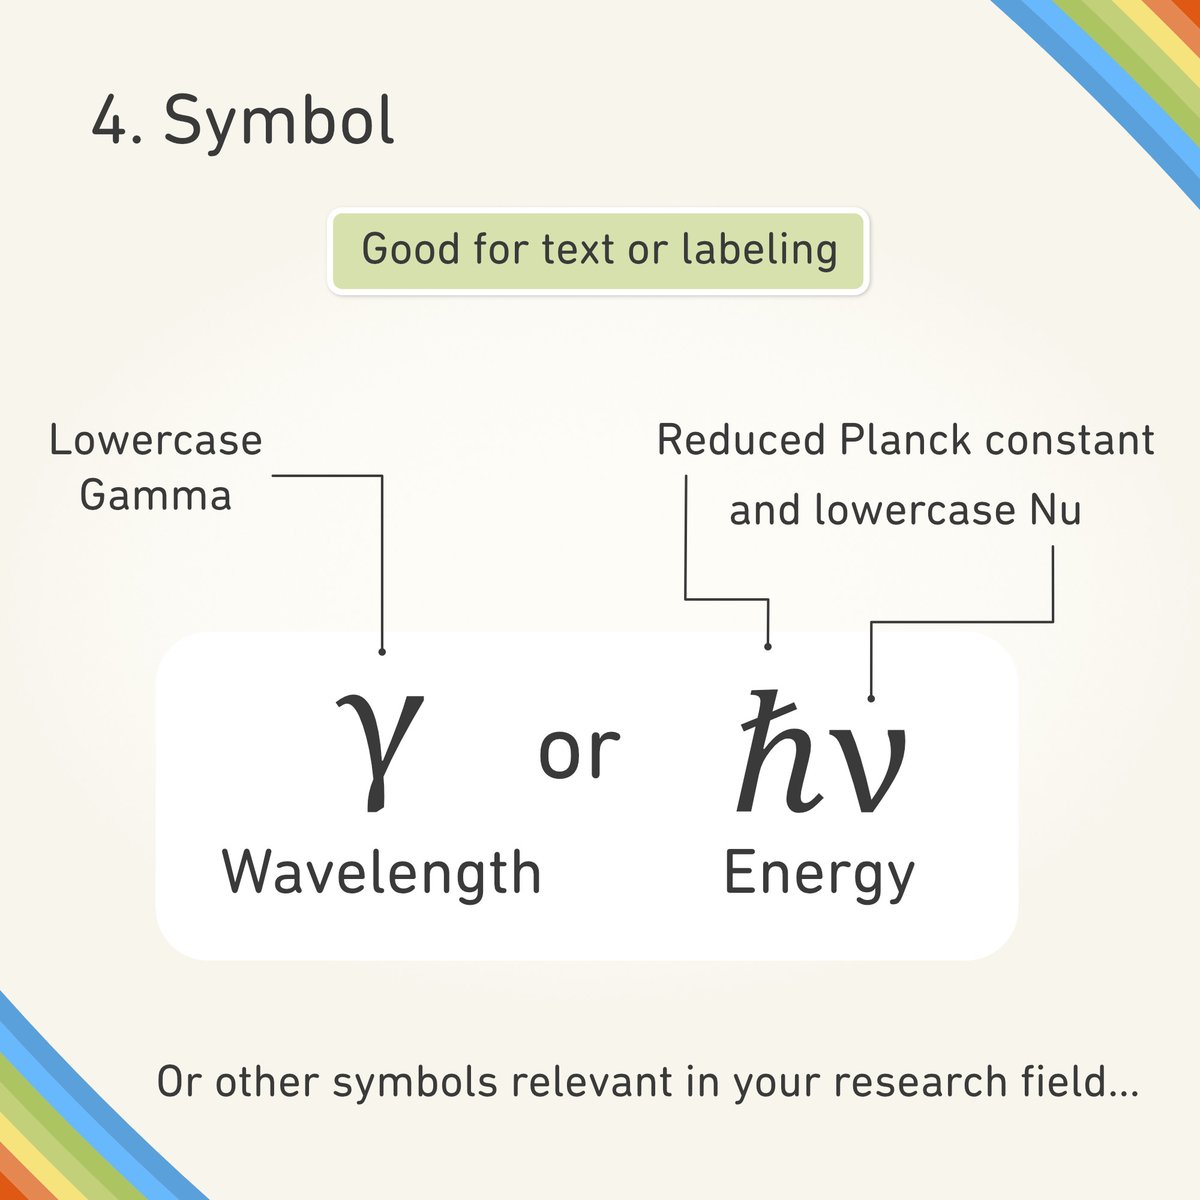
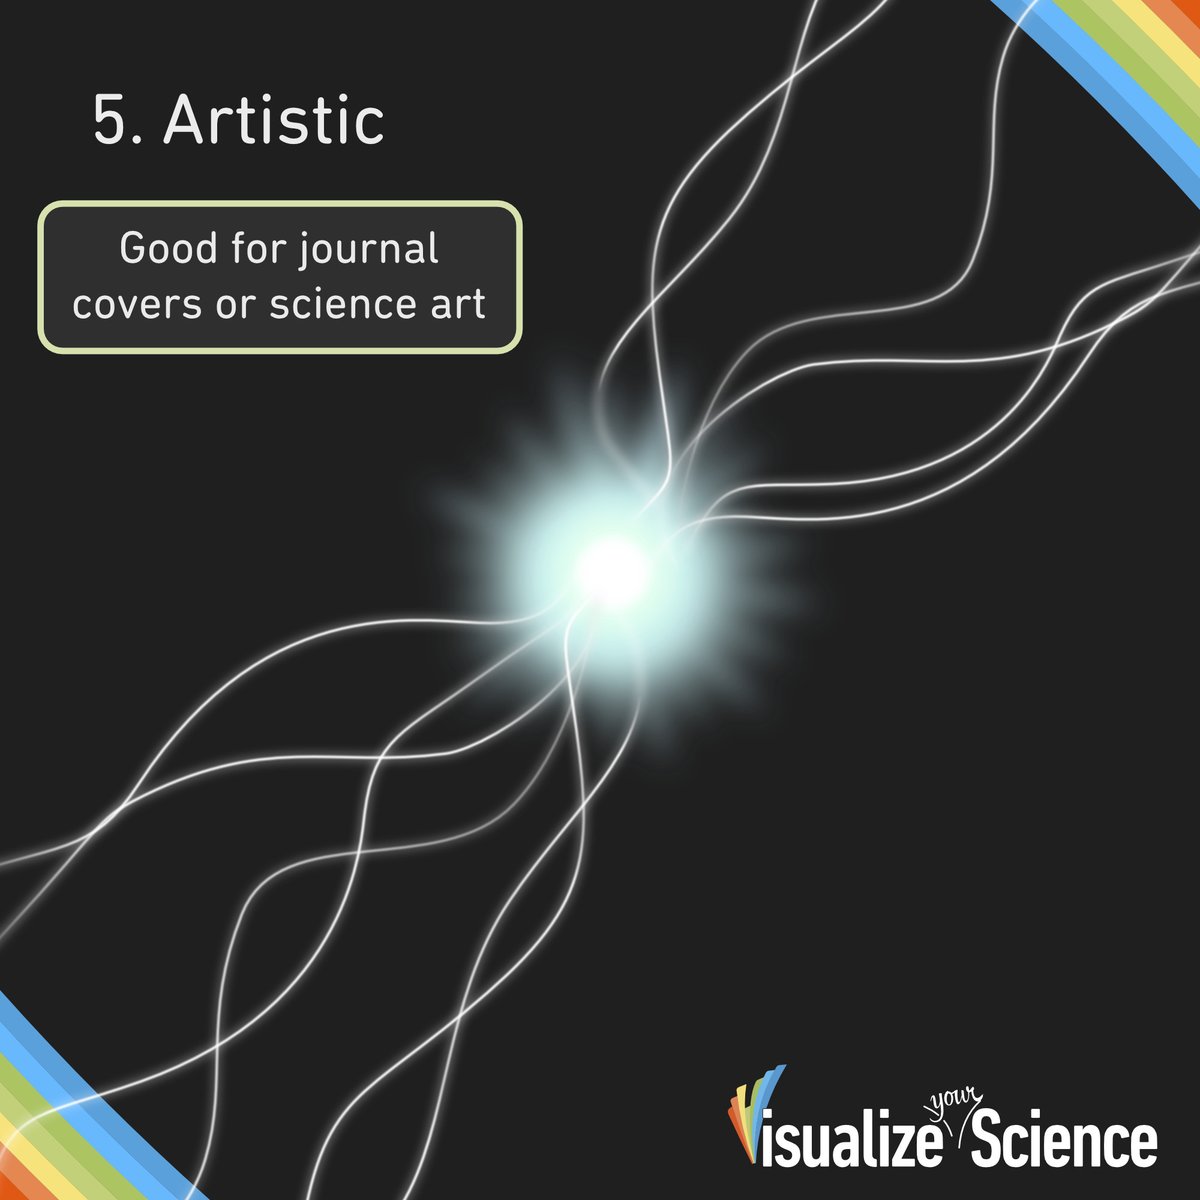
Part 2 of 2: How do you draw a photon?
There is no simple answer, and it depends a lot on the context and what you want to show. Here we list five different ways of drawing a photon and when to use it.
Enjoy your drawing!
#VisualizeYourScience #ScienceIllustration
1
44
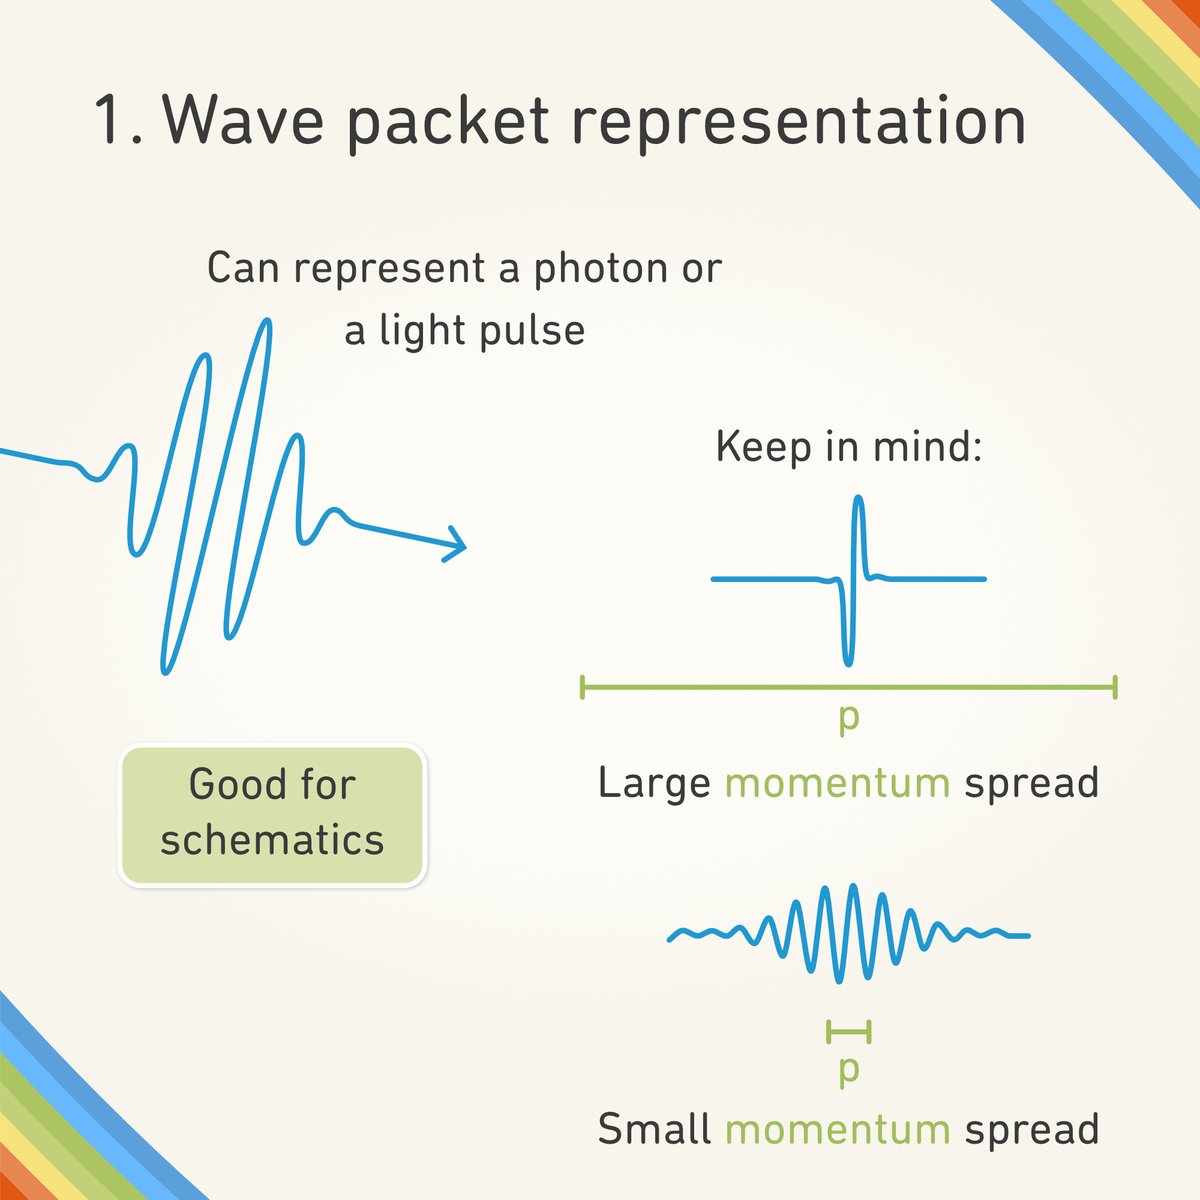
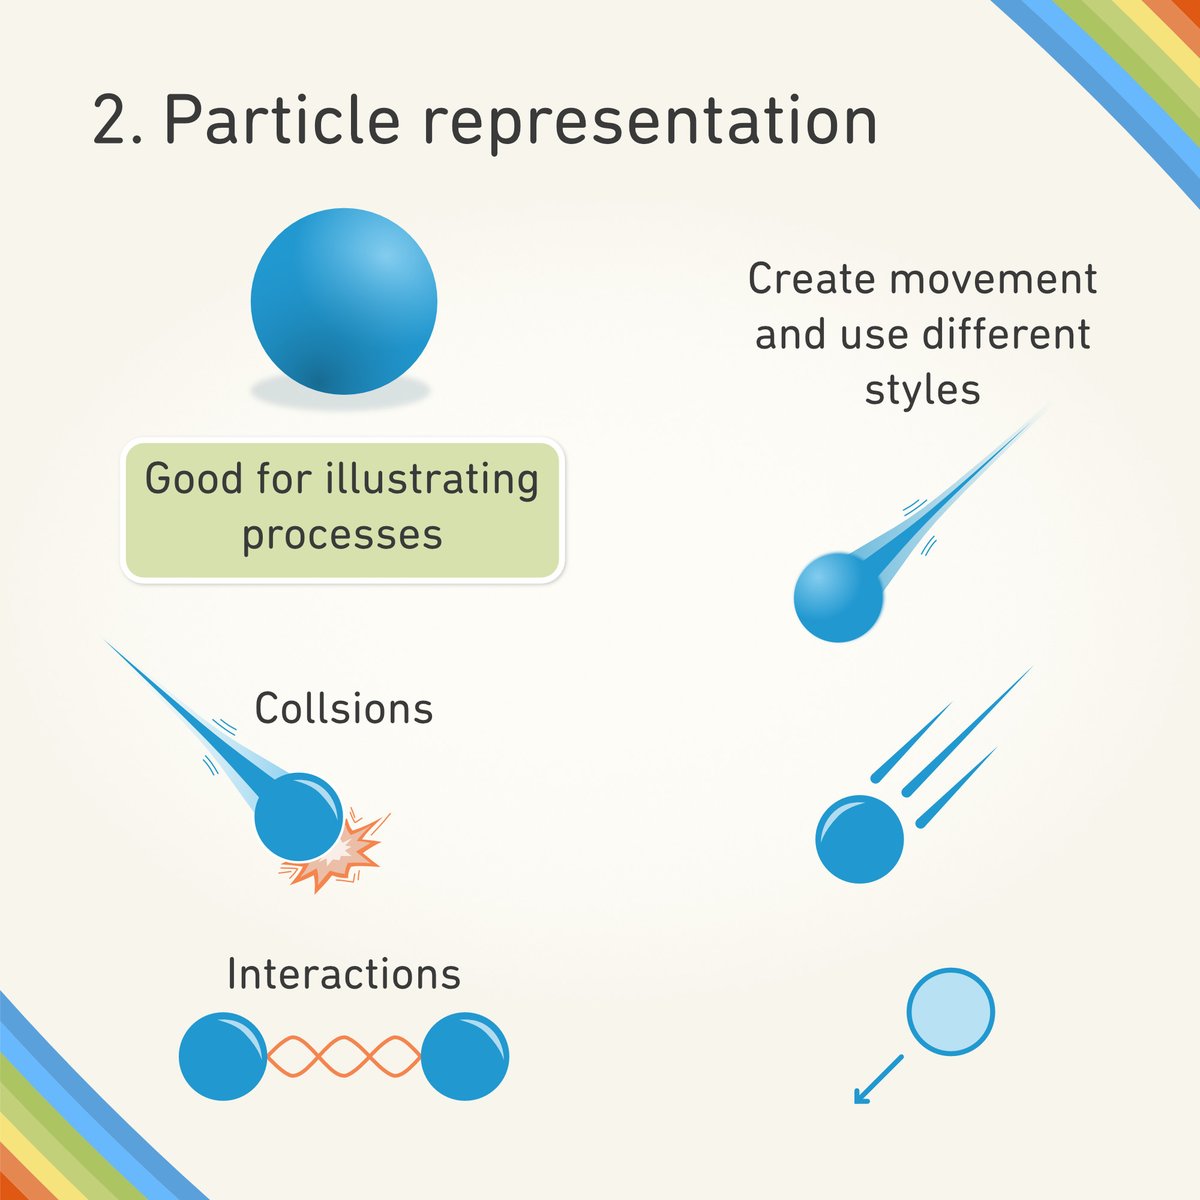
Part 1 of 2: How do you draw a photon?
There is no simple answer, and it depends a lot on the context and what you want to show. Here we list five different ways of drawing a photon and when to use it.
Enjoy your drawing!
#VisualizeYourScience #ScienceIllustration
1
49
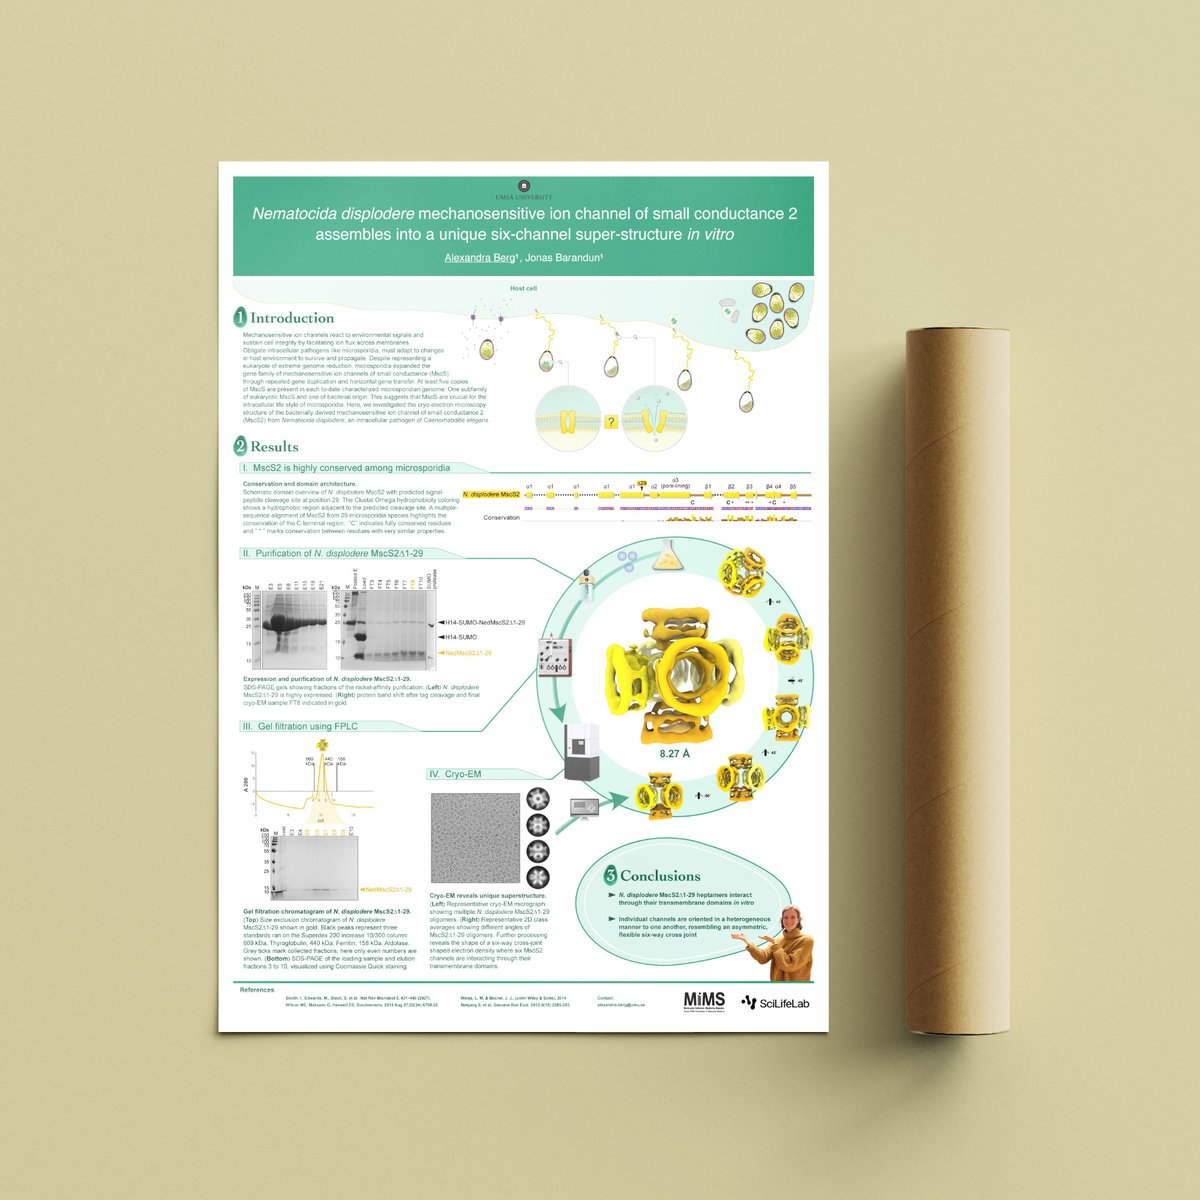
We're thrilled to welcome Alexandra Berg from @umeauniversity to our poster wall today!
This poster is a masterclass in balance and harmony, with a unifying color palette that ties all the visuals together beautifully.
Have a closer look here:
bit.ly/3AIUTzp?utm_campaign=…
1
51
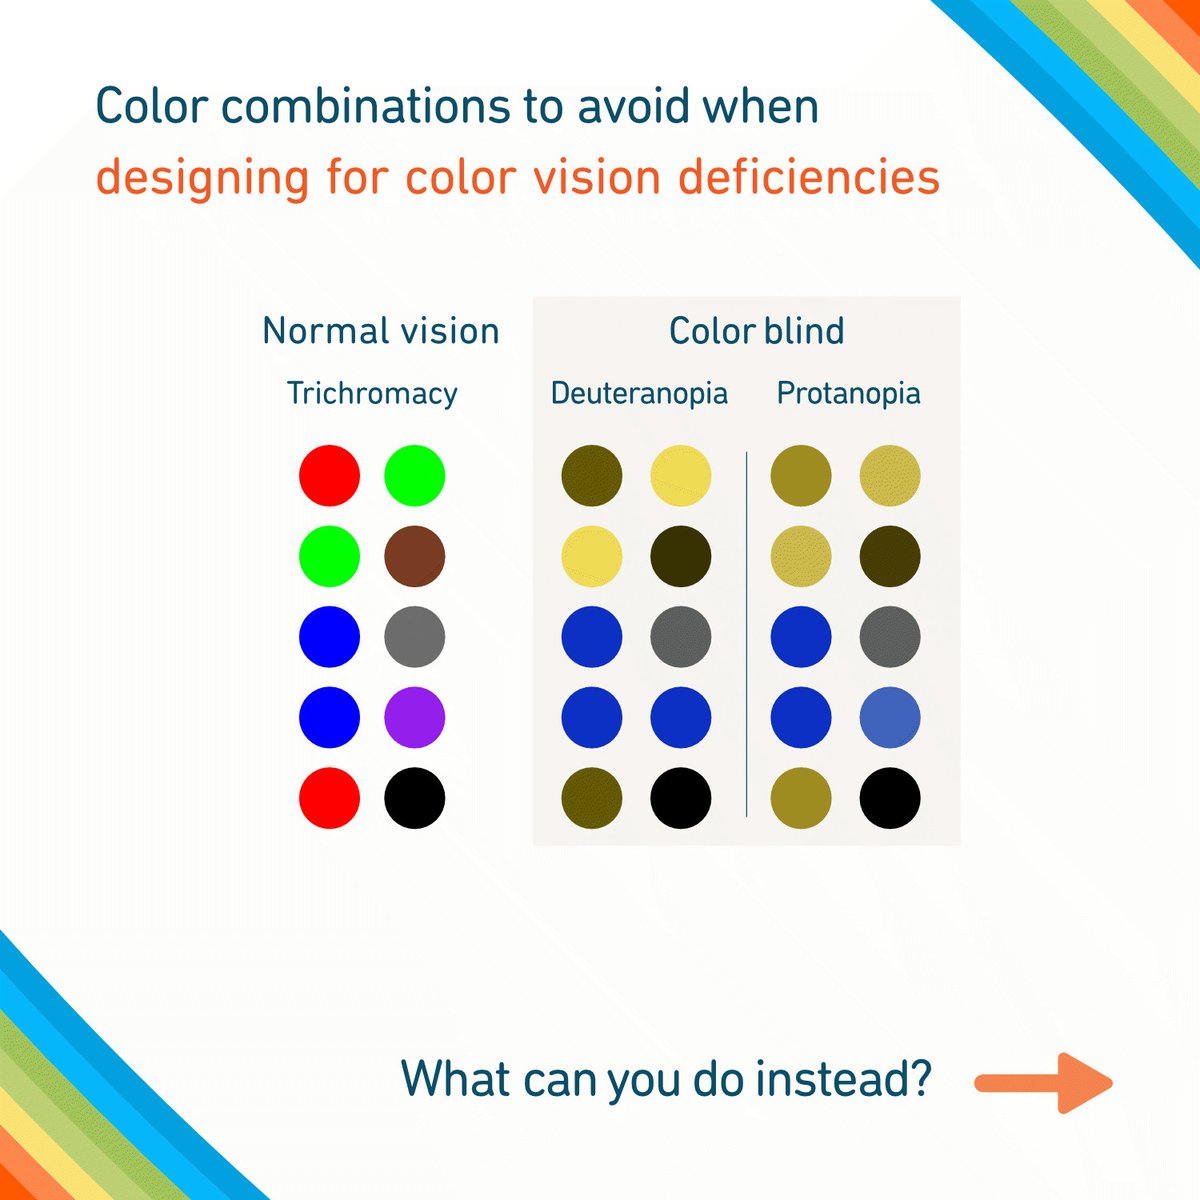
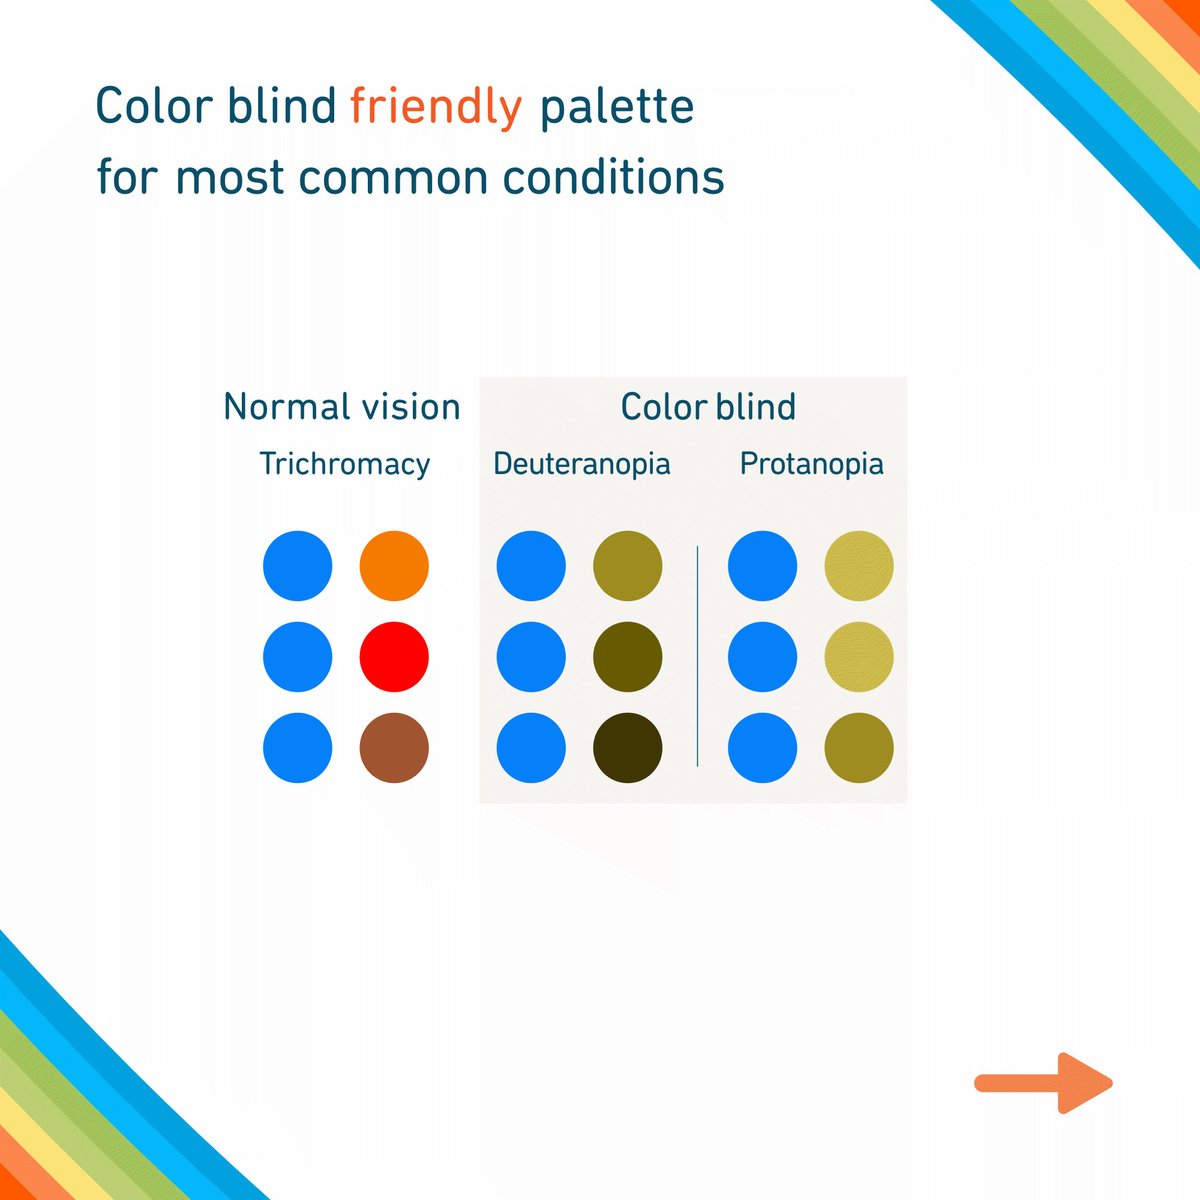
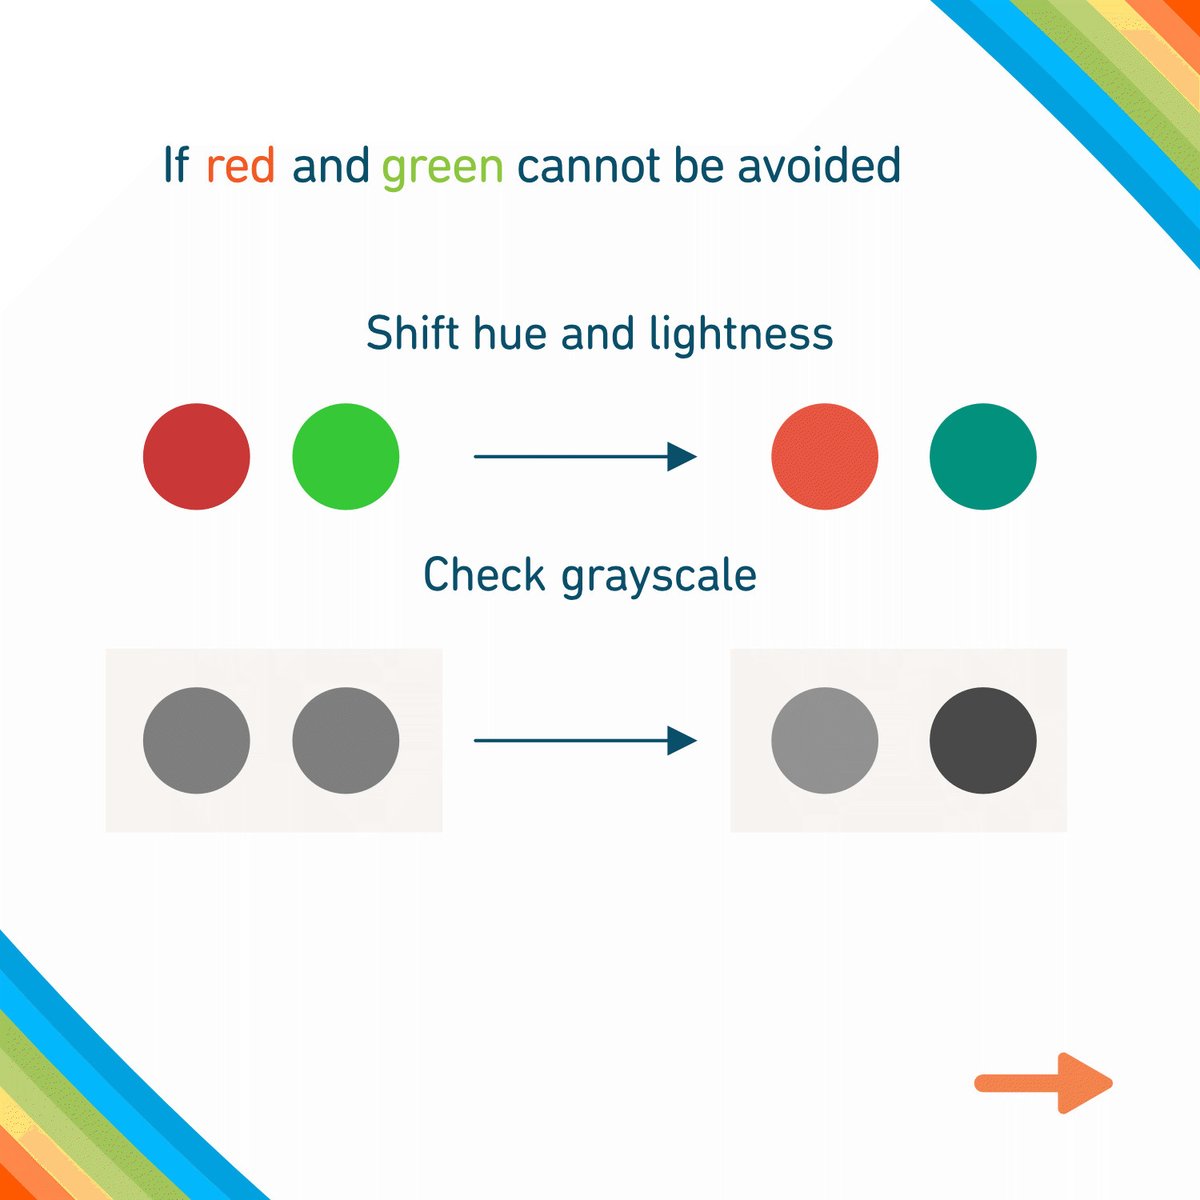
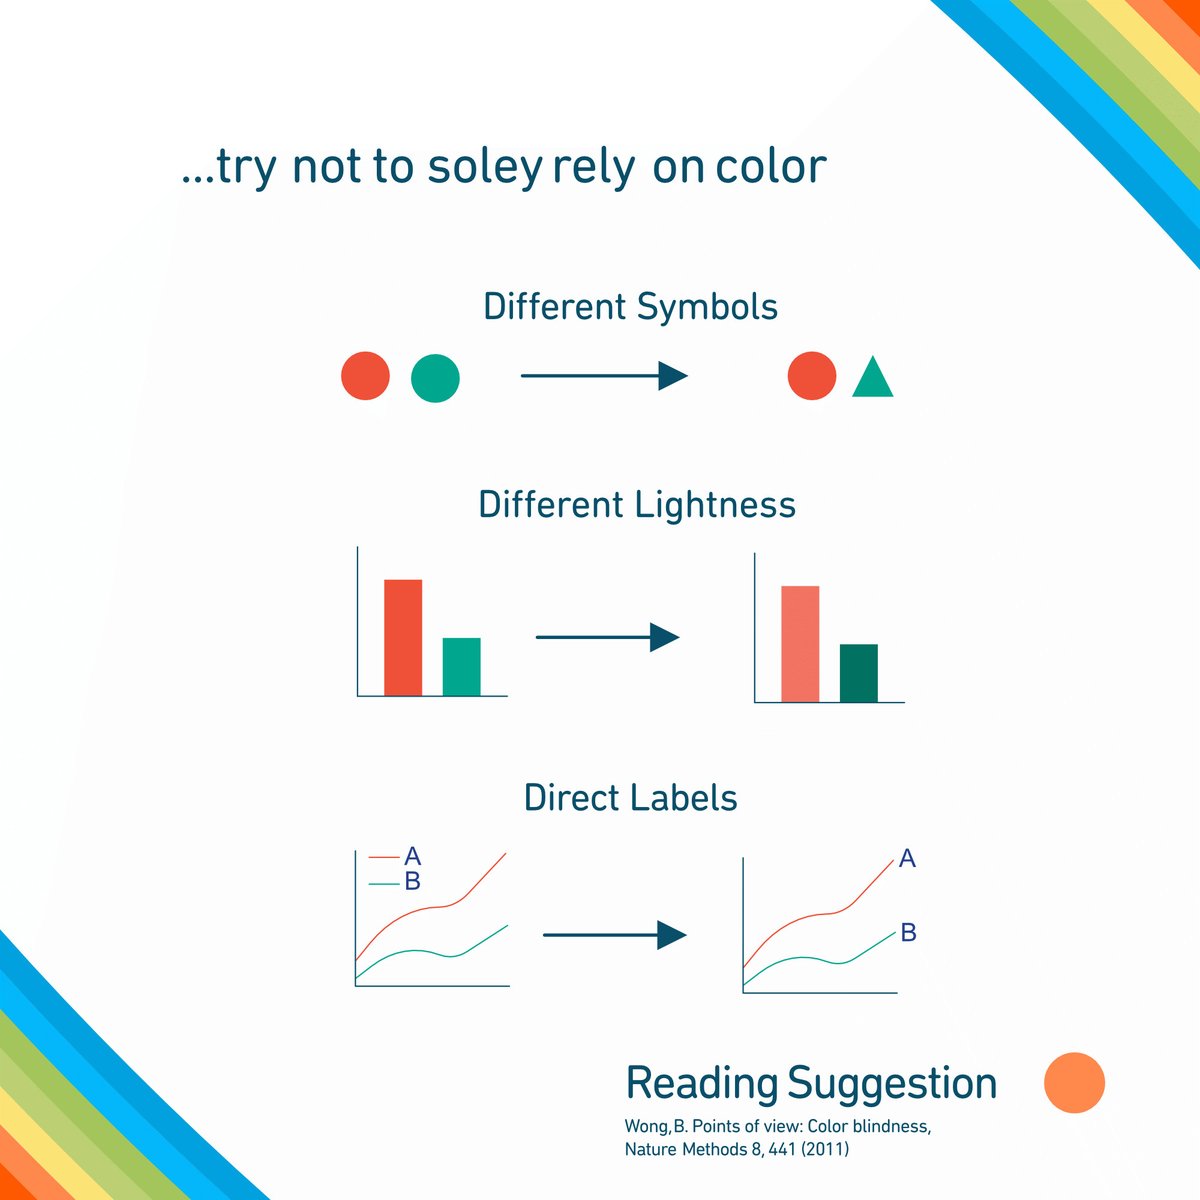
Not everyone experiences color the same way, which can be especially important to remember in data visualization. Thoughtful color selection helps ensure your data sets are clearly distinguishable.
Read more about color blindness here: doi.org/10.1038/nmeth.1618?u…
1
41
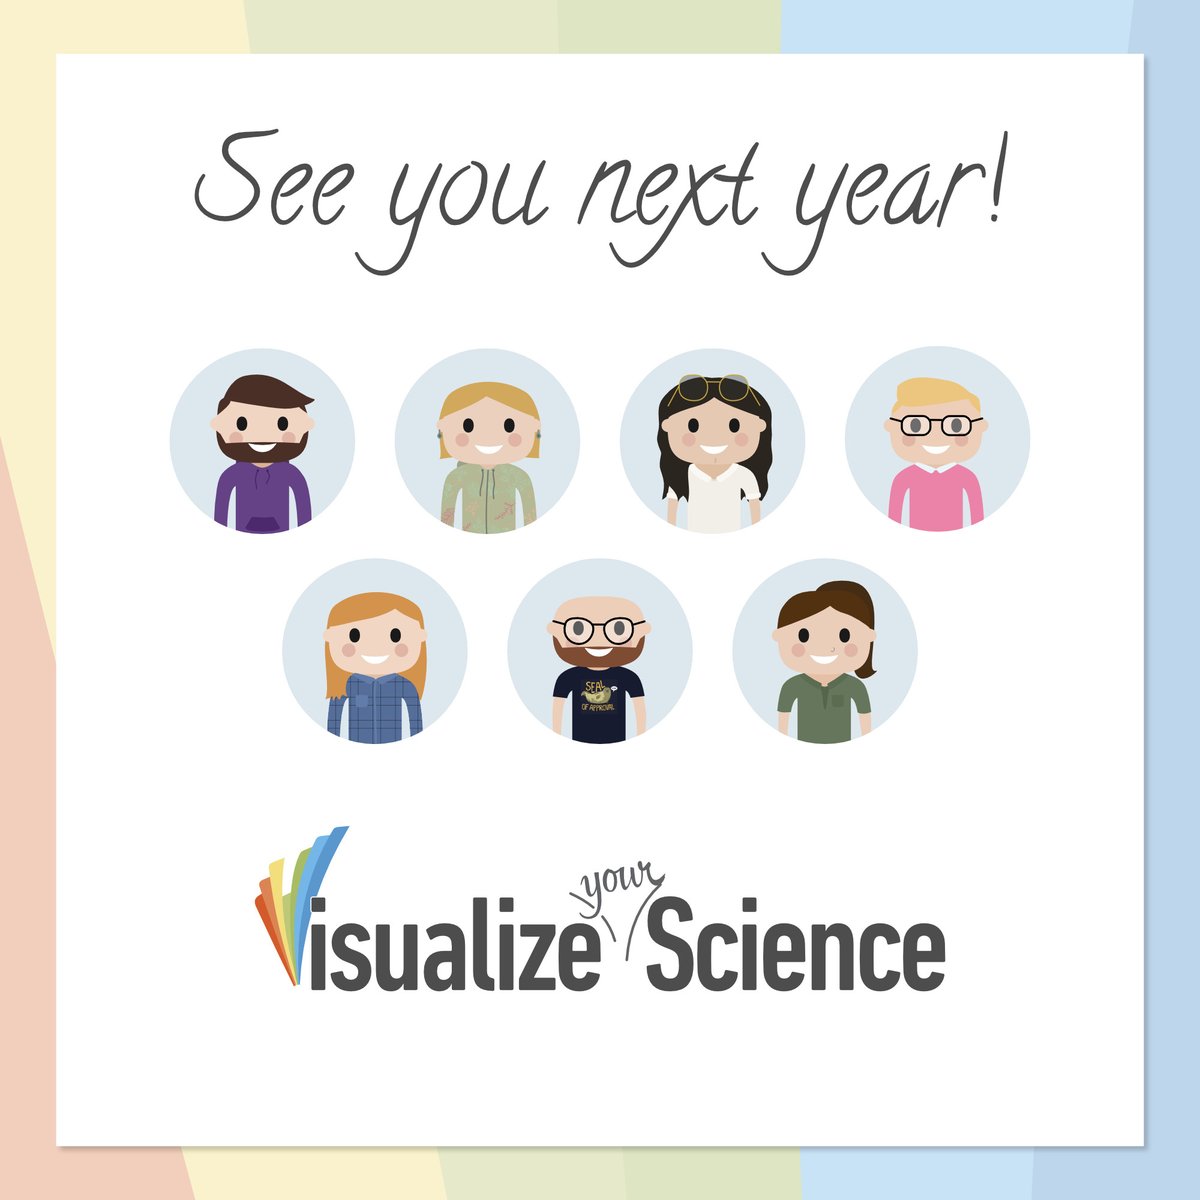
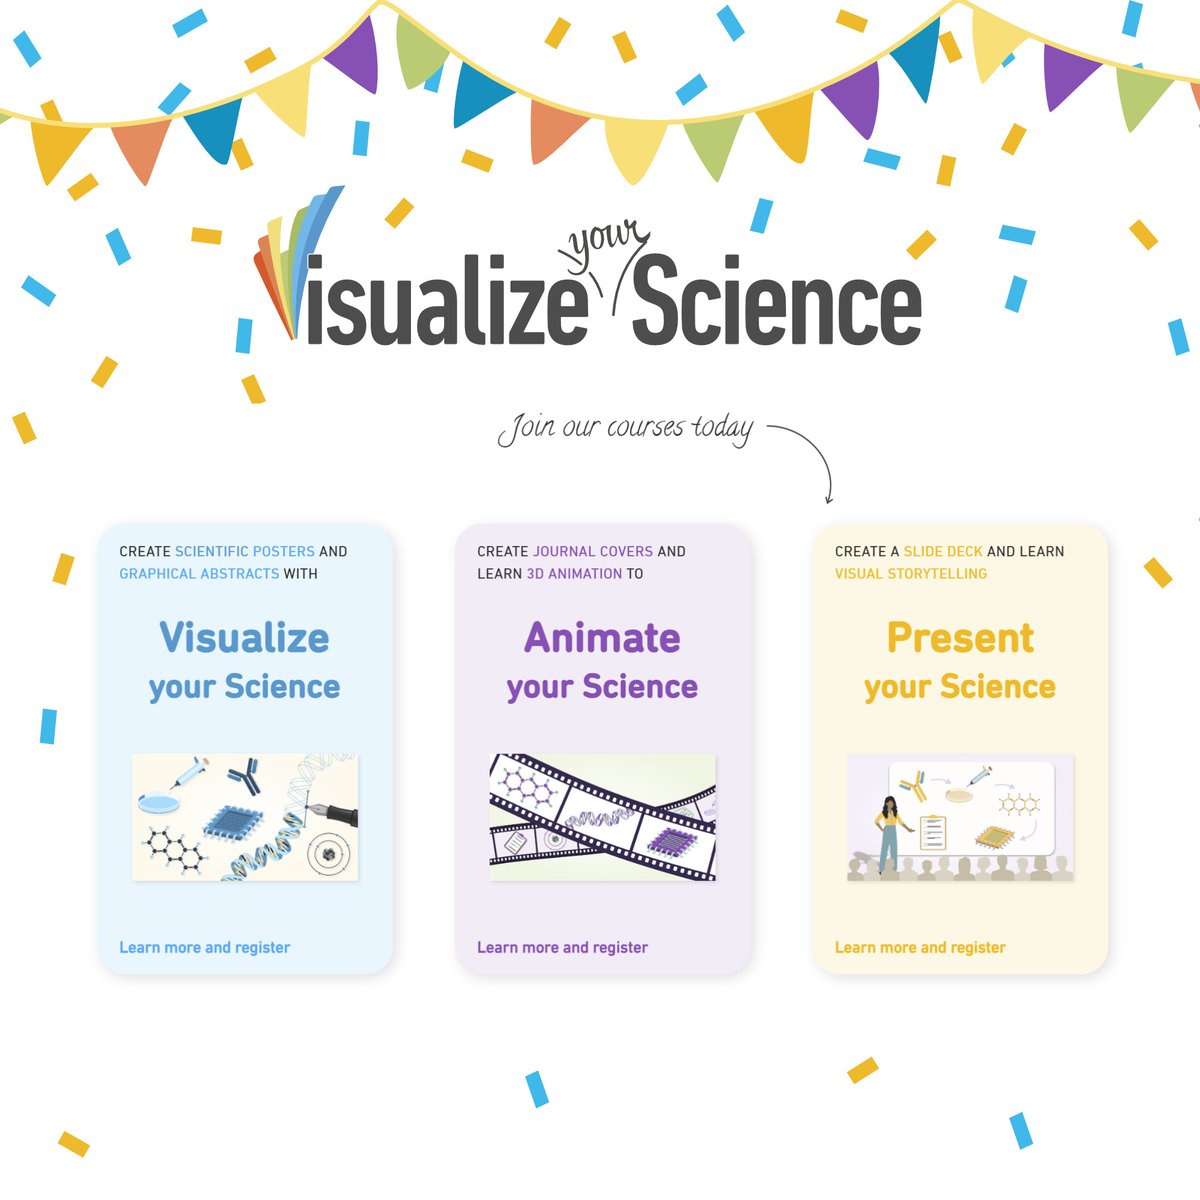
What an incredible year at Visualize your Science!
With over 800 students joining our courses, 12 workshops and several mini-courses held, we are now taking a short winter break and are looking forward to another year. Hope to see you in 2025!
#NewYear #VisualizeYourScience
1
61
The graphical abstract wall has been refreshed, check out the latest additions here: bit.ly/3Zpp8Fi?utm_campaign=…
Featured artists: Julia Ahlvind, Nima Mirzaei, Anna Pedersen, Emily Lechner, Marie Frausing, Bernadette Davies, Ida Hermansson, Núria Flores Espinosa, and Jan Klink.
1
88
In our latest blog post, we are trying to help you decide which software to use for making your scientific visualizations by comparing the three vector graphics software: Inkscape, Affinity Designer, and Adobe Illustrator.
Read it here: visualizeyourscience.com/blo…
1
133
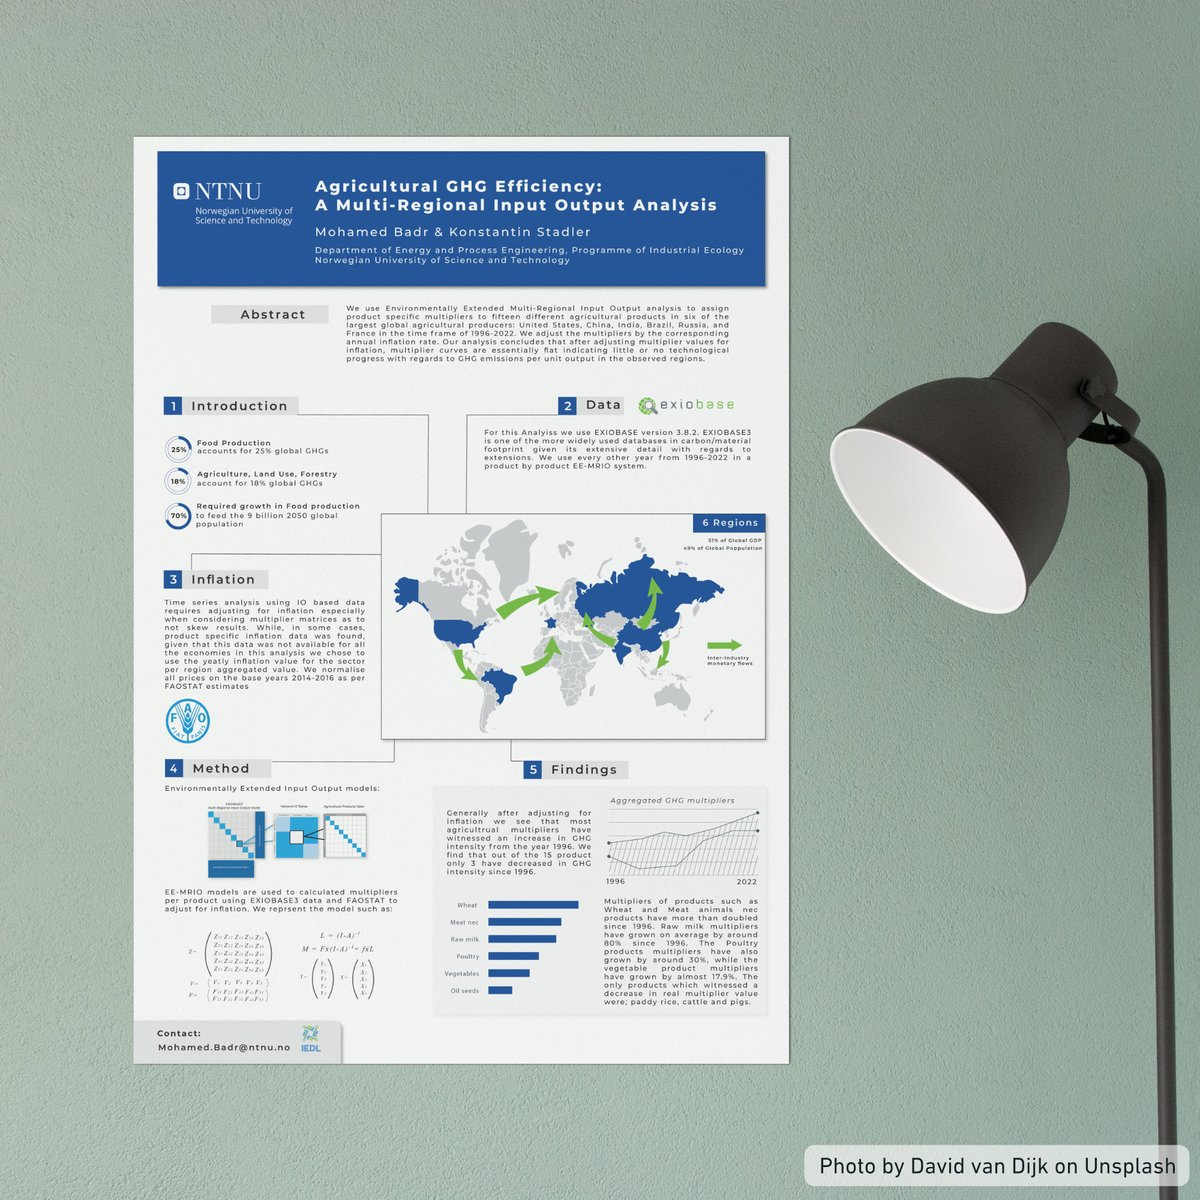
We welcome Mohammed Badr from @NTNU to our poster wall today!
This poster is a testament to the power of good design: balanced layout, clear structure, and a cohesive color palette.
Check it out here:
bit.ly/3AIUTzp?utm_campaign=…
#VisualizeYourScience #PosterDesign
1
52
How do you create good visuals for your poster? Ask Jan-Ole Reese from @UniOslo whose poster we welcome to our Poster Wall today. Go and have a closer look at it to see all the details of these incredible illustrations:
bit.ly/3AIUTzp?utm_campaign=…
#VisualizeYourScience
1
65
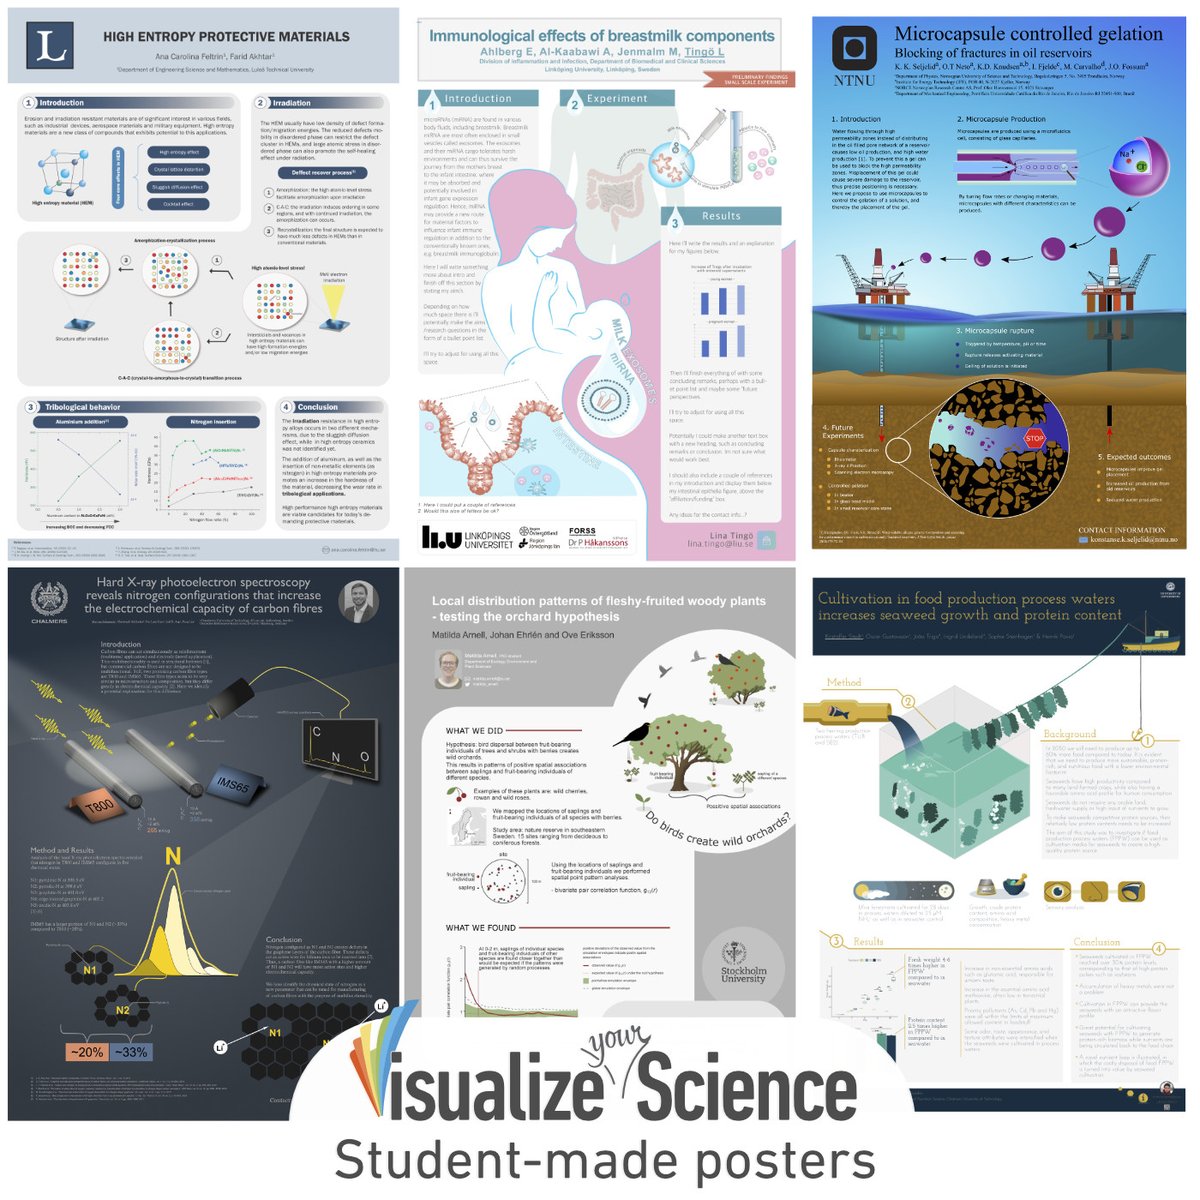
Here are some amazing final posters from the Visualize Your Science summer course! The effort and time put into these designs truly shine.
If you're interested in creating posters like these, check out the course here: bit.ly/3X6rJBw?utm_campaign=…
#VisualizeYourScience #Poster

1
67
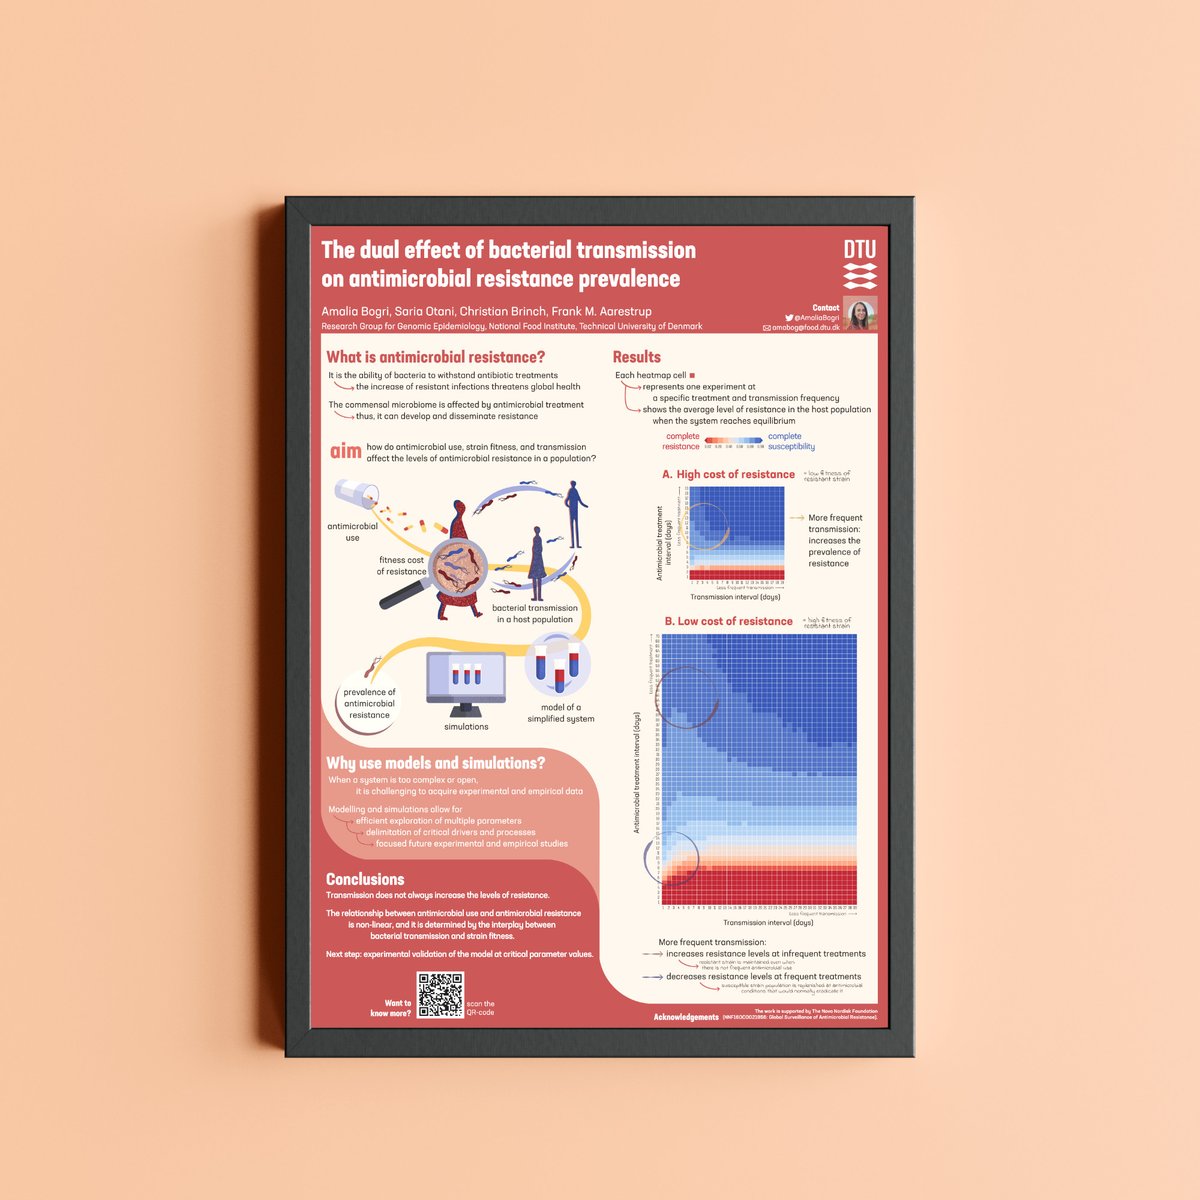
A big shoutout to Amalia Bogri from @DTUtweet for this stunning poster! The refreshing color palette and impeccable design make it a standout.
Fantastic job, Amalia!
Admire the poster in detail here:
bit.ly/3AIUTzp?utm_campaign=…
#VisualizeYourScience #AntimicrobialResistance
76
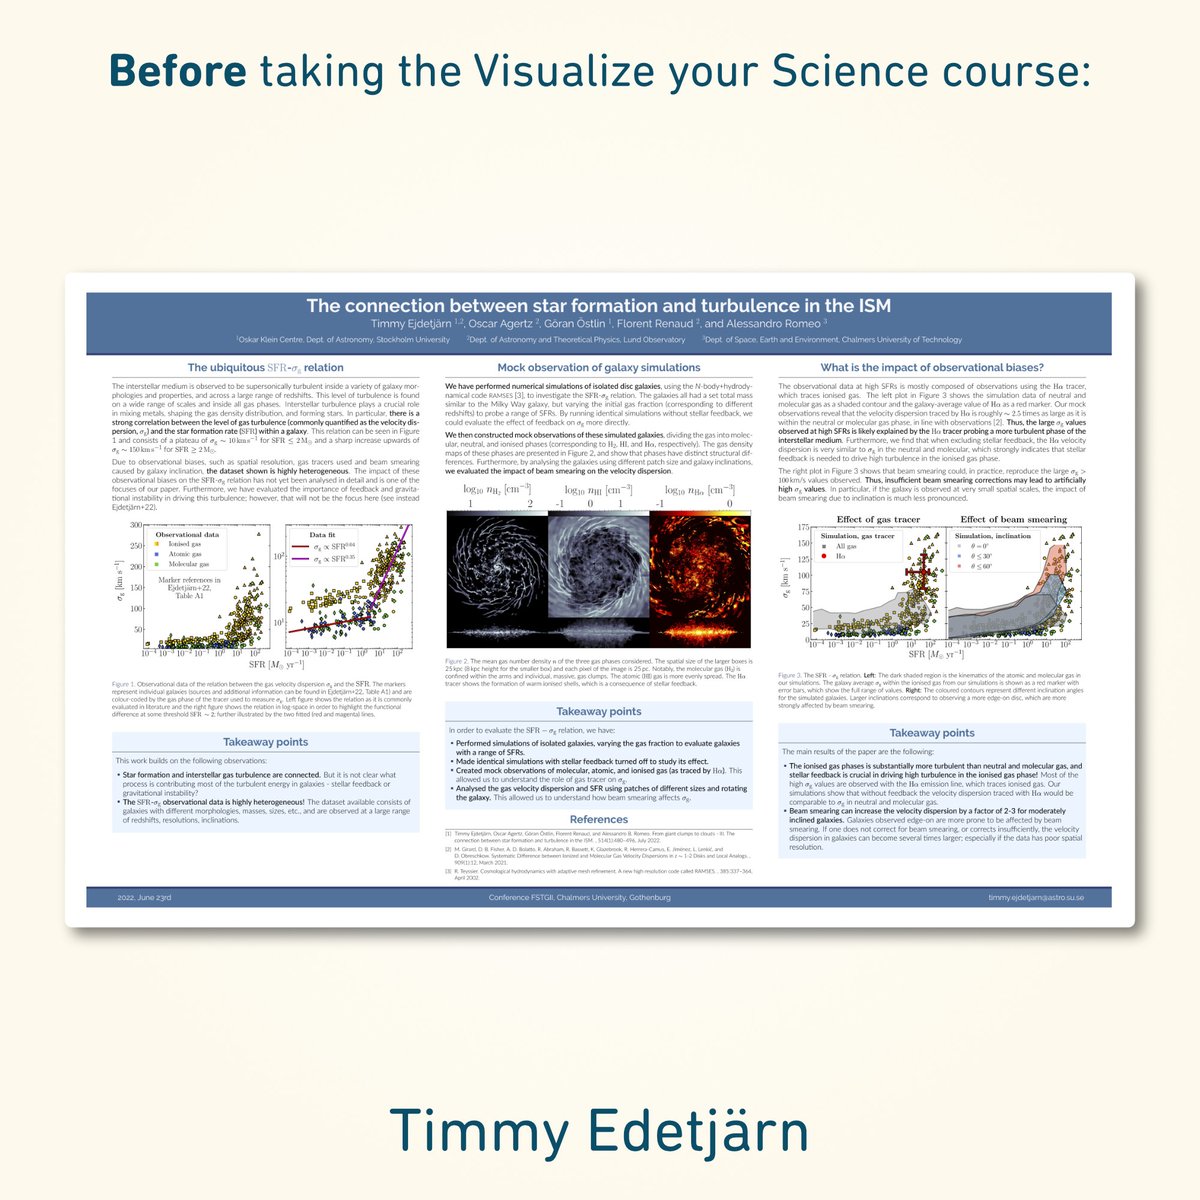
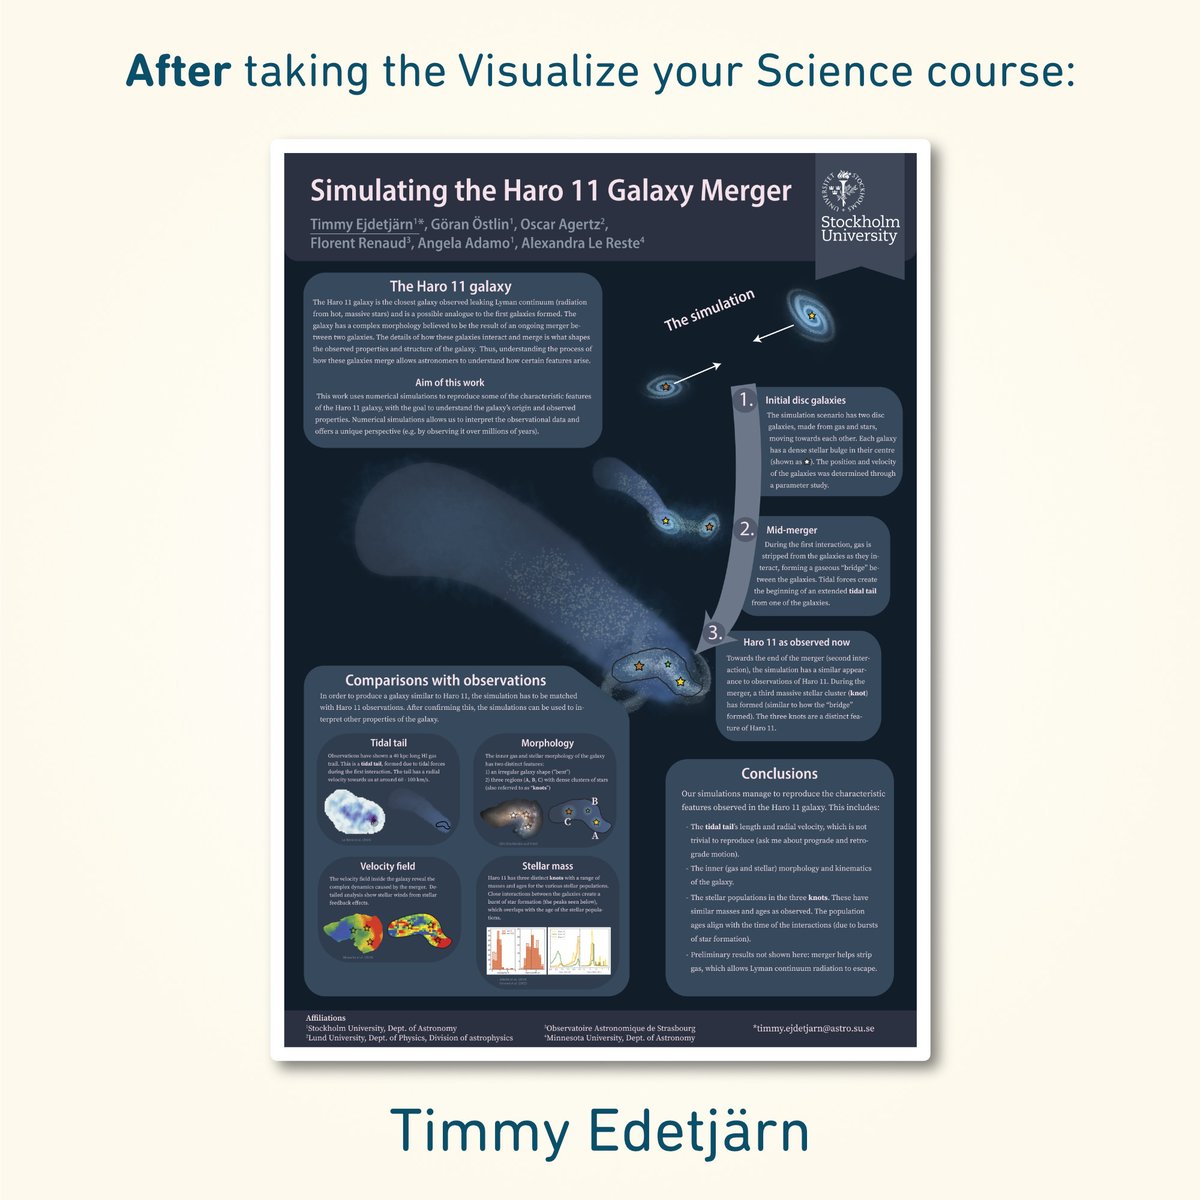
Why bother learning to draw your own images and make posters for your research?
To answer that check out Timmy Edetjärn's poster transformation before and after our course.
Want to create amazing posters like this? Check out the course here:
bit.ly/3X6rJBw?utm_campaign=…
1
62
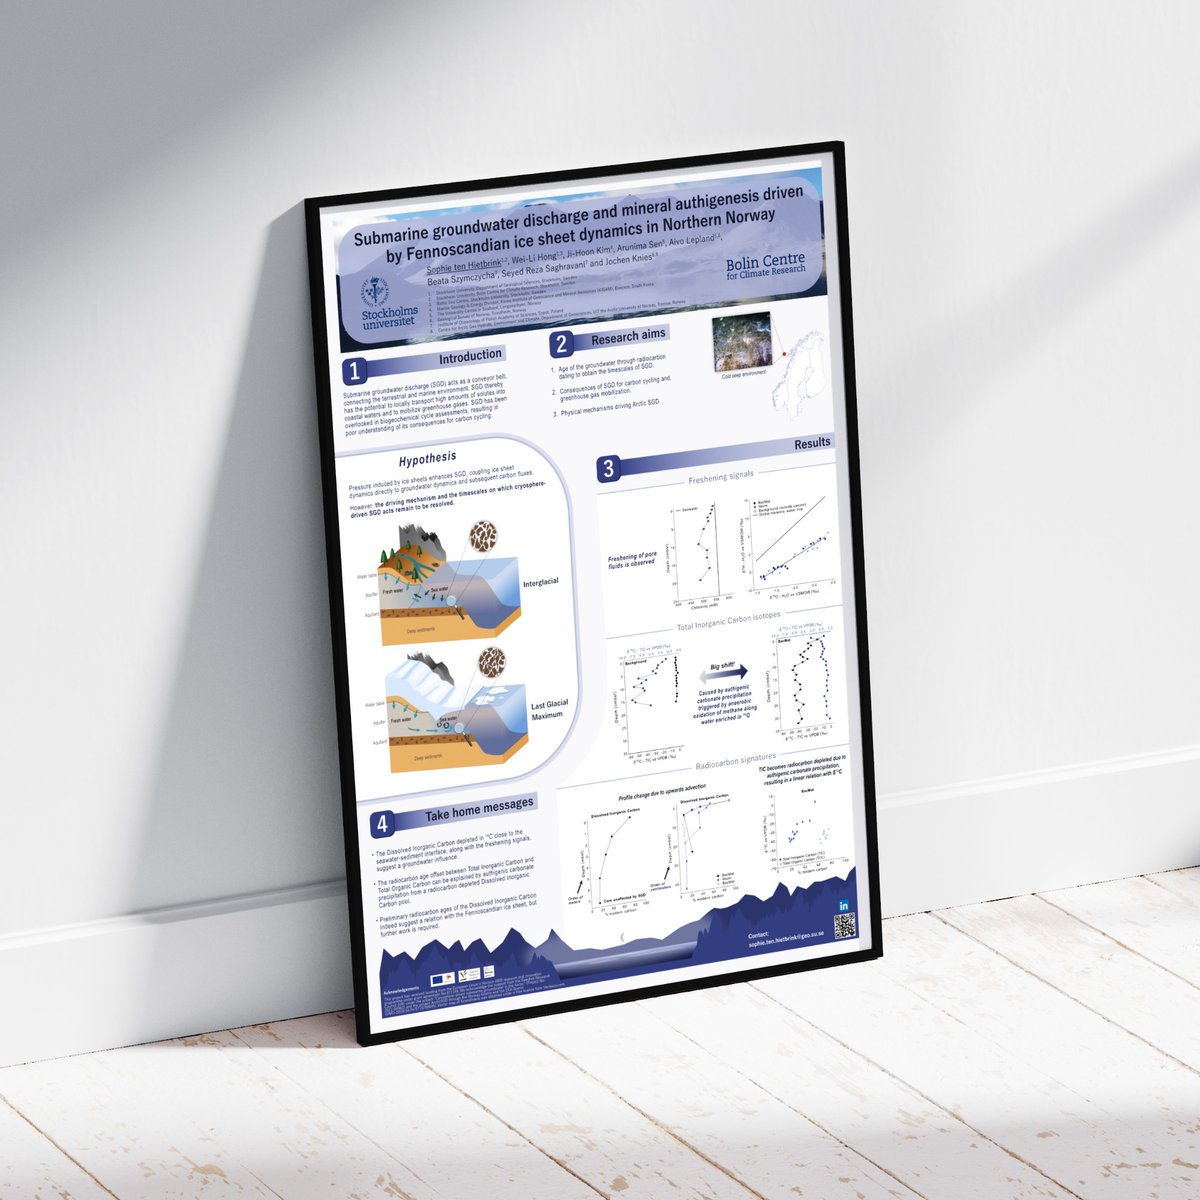
We're thrilled to feature Sophie ten Hietbrink from @Stockholm_Uni on our poster wall today!
The poster is packed with stunning visuals and smart design elements.
You can find this and many other great posters here:
bit.ly/3AIUTzp?utm_campaign=…
#VisualizeYourScience #Carbon14
1
67
We've given our website a fresh new look! Check it out here:
visualizeyourscience.com/?ut…
Rest assured, the courses are still the same - now with a nicer presentation!
#VisualizeYourScience
#FreshLook
2
52
We welcome William Pallisgaard Olsen from @DTUtweet to our poster wall today!
This poster has strong visual explanations, particularly in the mechanism section, where the images tell the story.
Admire the poster here:
bit.ly/3AIUTzp?utm_campaign=…
#VisualizeYourScience #PosterDesign
1
69
Last chance to sign up for the Visualize your Science Winter course!
Starting this week (first assignment due in two weeks).
There are only a few slots left! Learn more or sign up here: bit.ly/3X6rJBw?utm_campaign=…

1
63
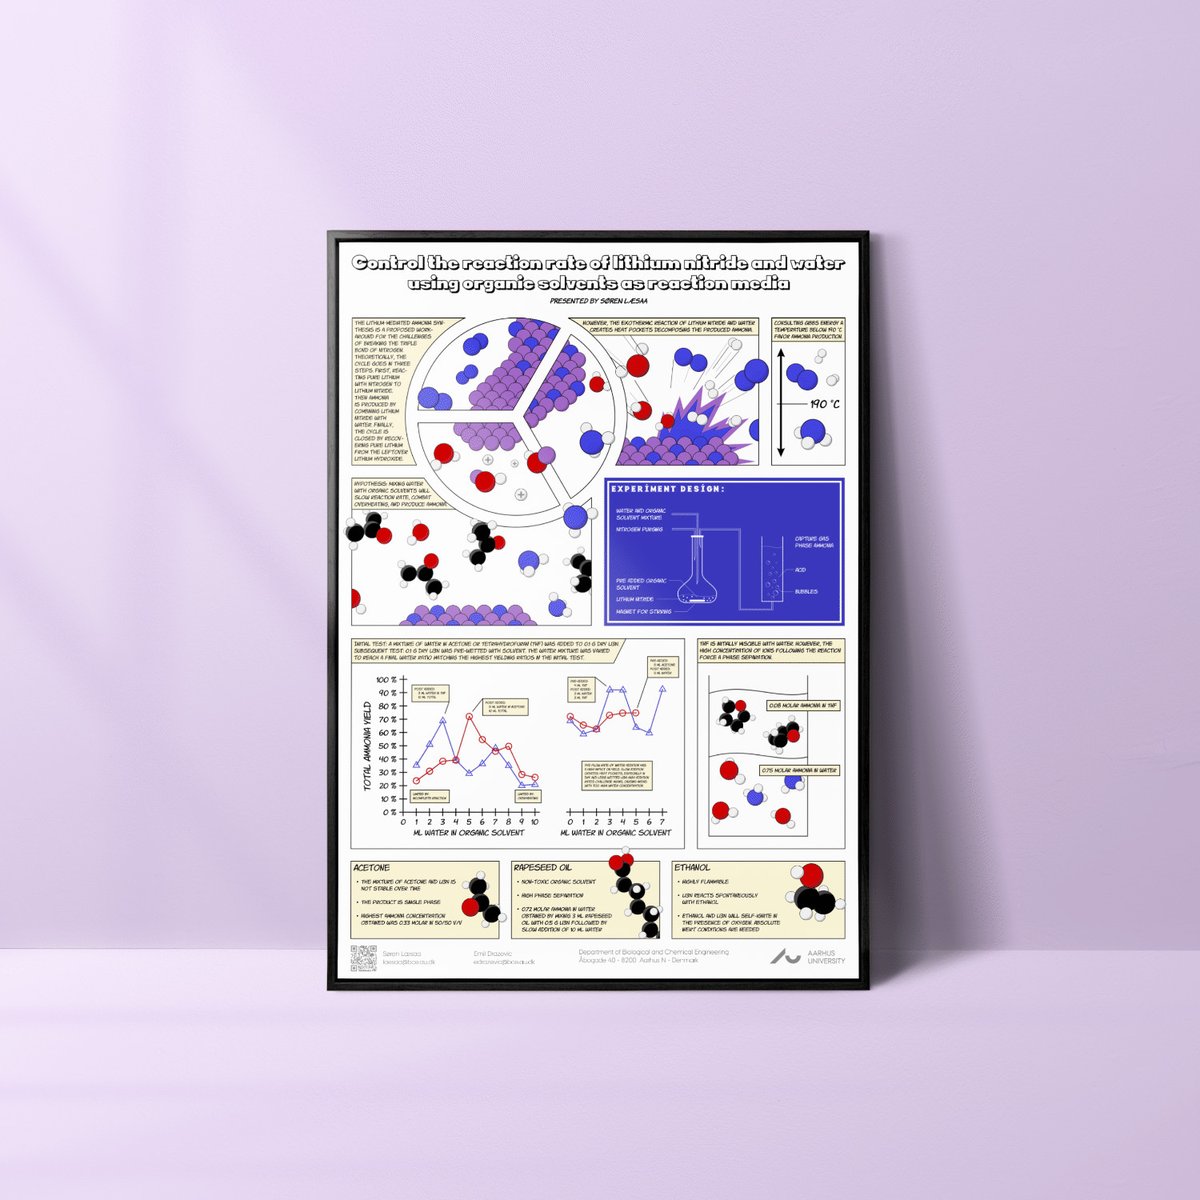
A true gem among our students' poster creations is this one made by Søren Læsaa from @AarhusUni .
Welcome to our poster wall Søren!
Admire the poster in detail here:
bit.ly/3AIUTzp?utm_campaign=…
#VisualizeYourScience #PosterDesign #ResearchPoster #SciComm #ScienceComics
3
111
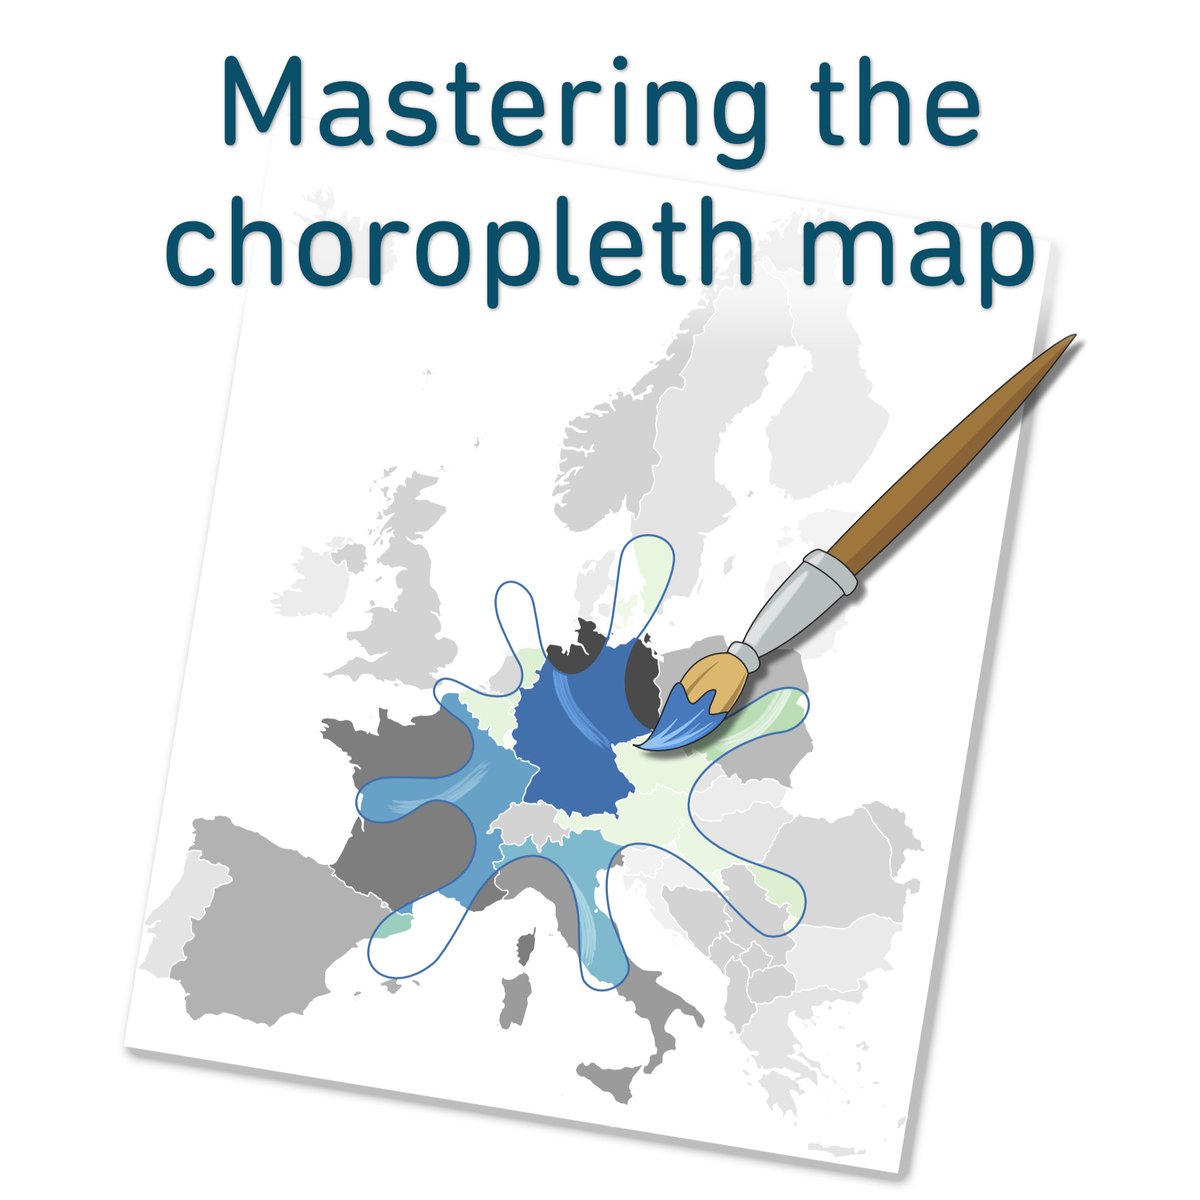
A new blog post is up!
Do you use maps in your data visualizations? Learn how to add color to your choropleth maps in our latest blog post:
visualizeyourscience.com/blo…
#VisualizeYourScience #NewBlogPost #Choropleth
1
65