
Complete Solidity security: Wake Framework (open-source) for testing & fuzzing Wake Arena for AI audits with graph-driven reasoning. By @AckeeBlockchain
Joined September 2023
- Tweets 6,503
- Following 138
- Followers 2,248
- Likes 8,245
385 Photos and videos


Pinned Tweet

Mar 30
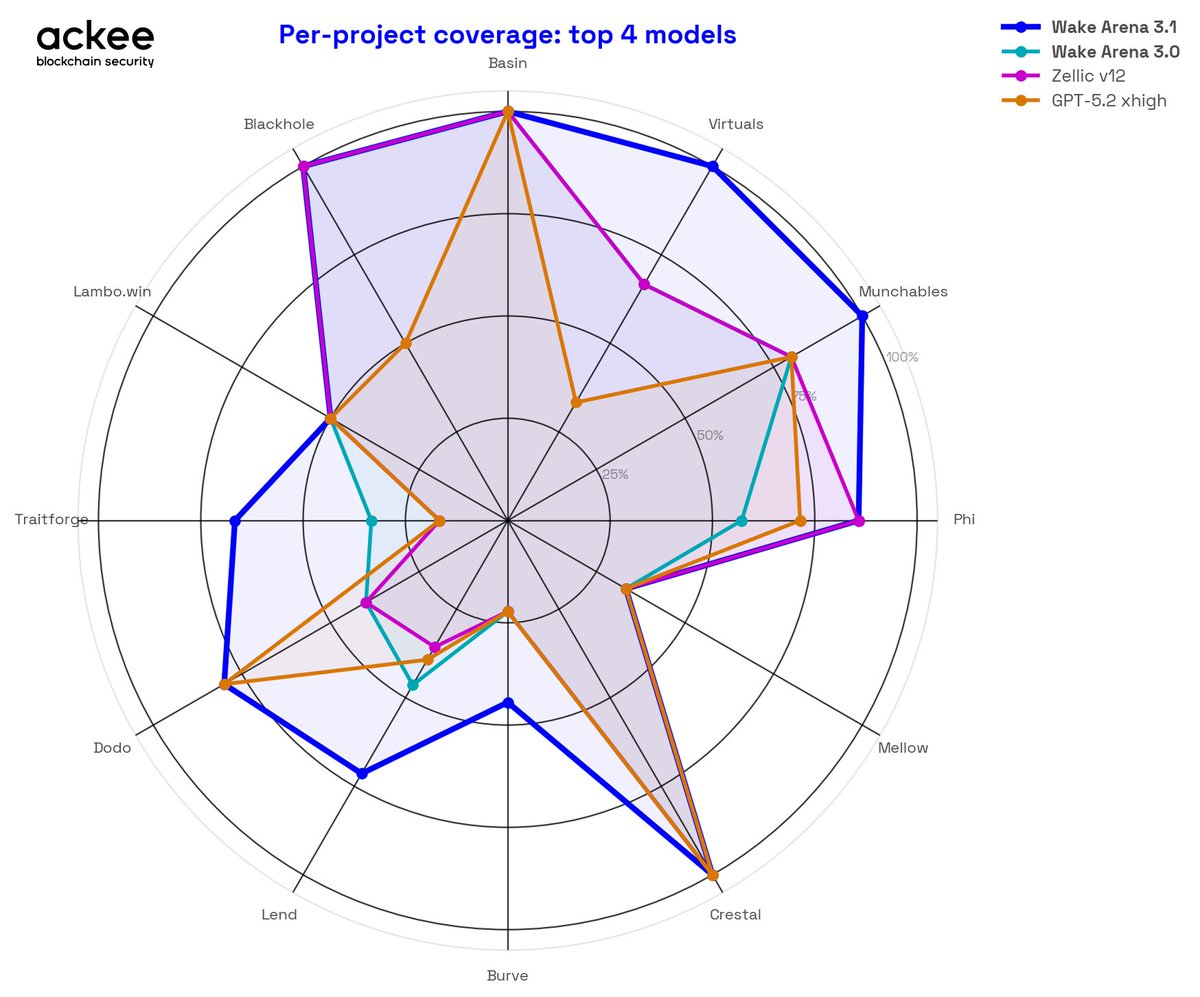
Four AI auditing tools. Fourteen protocols. The shape tells the story.
Wake Arena 3.1's blue area contains the other three on every axis.
Where all systems struggle — Burve, Notional — the gap closes.
Where the work matters — Lend, Munchables, Virtuals — the edge is visible and consistent.
What the chart doesn't show: 49 of the 63 found vulnerabilities were confirmed by more than one Wake Arena agent independently.
The shape reflects consensus, not a single model's guess.
Learn more ↓
10
2
24
925
Jun 9
Learning to write security tests?
"Awesome Wake Tests" collects real production test suites from Aave, Lido, Axelar comprehensive reentrancy defense patterns educational resources (workshops, Ethernaut solutions, benchmarks).
Study how protocols securing billions test their code ↓

2
156
Jun 2
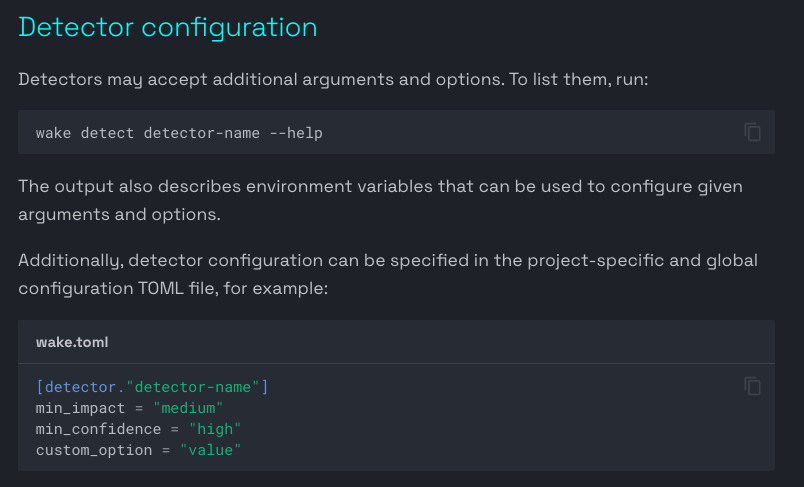
Most security checks happen after code review.
`wake detect` runs the same detectors used in Ackee audits before anyone opens a PR.
Here's how to add a security gate to your pipeline:
Thread ↓
7
1
12
259
Jun 2
3/ Pair detectors with fuzzing for layered coverage:
Static analysis catches known bad patterns.
`wake test -P 5` explores unexpected runtime behavior.
Structure behavior — the gap most CI pipelines leave open.
1
1
23
Jun 2
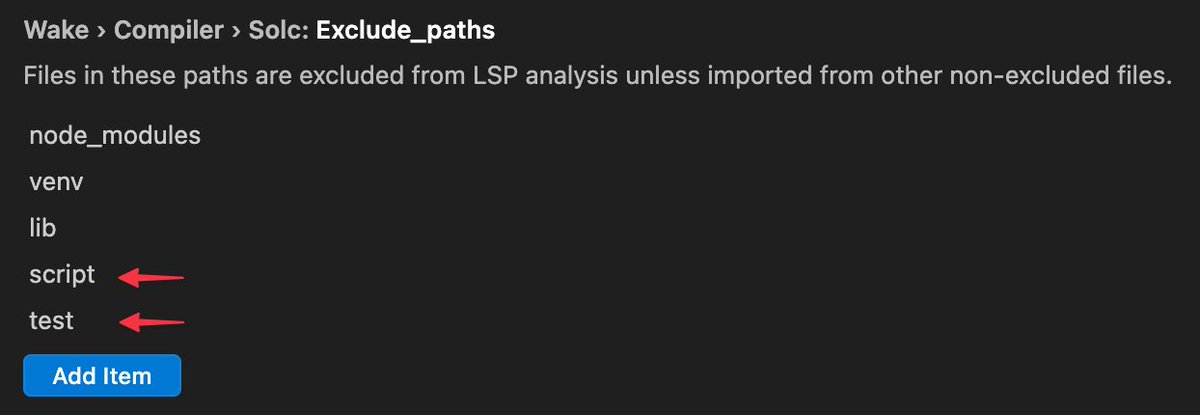
4/ Security gates in CI mean auditors review cleaner code.
• Follow @WakeFramework for more insights
• Retweet the 1st tweet to help others
Get Wake:
getwake.io
1
23
May 26
Coverage percentages hide the dangerous code paths.
"92% coverage" sounds reassuring until you realize the missing 8% contains your entire liquidation logic.
Traditional coverage reports show numbers.
Wake's VS Code extension shows the actual untested code, highlighted directly in your editor as you write contracts.
Green shows executed paths.
Red marks untested sections.
Execution counts appear inline.
Revert error coverage highlights which error conditions tests actually trigger.
The visualization changes how developers approach testing.
Instead of chasing percentage targets, focus shifts to the code that matters.
Complex branching logic.
Edge case handlers.
Critical security functions.
One DeFi protocol team discovered their emergency pause mechanism had zero test coverage despite 94% overall coverage.
The percentage metric masked the gap.
Visual highlighting made it obvious.
During security audits, this becomes invaluable.
Auditors immediately see which contract areas lack test validation.
Developers can target testing efforts precisely where vulnerabilities hide.
The setup is immediate.
Add ``--coverage`` to your test command.
Run your test suite or fuzzing campaign.
Wake generates a coverage file automatically.
Open the command palette in VS Code.
Select "Show Coverage."
Choose your coverage file.
Your contracts transform with color-coded insights.
The extension displays execution counts for each line, making it trivial to spot code that runs once versus code that executes thousands of times during fuzzing campaigns.
This matters for fuzzing, especially.
You're running thousands of iterations.
Which branches actually execute?
Which error conditions actually trigger?
Visual coverage answers instantly.
Testing thoroughness shouldn't require detective work.
Wake turns abstract coverage metrics into actionable visual feedback.
See gaps at a glance.
Build more secure contracts.
Start visualizing your test coverage ↓
7 Oct 2025
1
3
409
May 19
Why use Wake's extension?
Professional code navigation:
→ Inheritance graphs showing contract relationships
→ Control flow visualization capturing reverting and successful branches
→ Compiler-based accuracy (no parsing guesses)
Superior UI quality vs 1.7M install extensions.
168
May 12
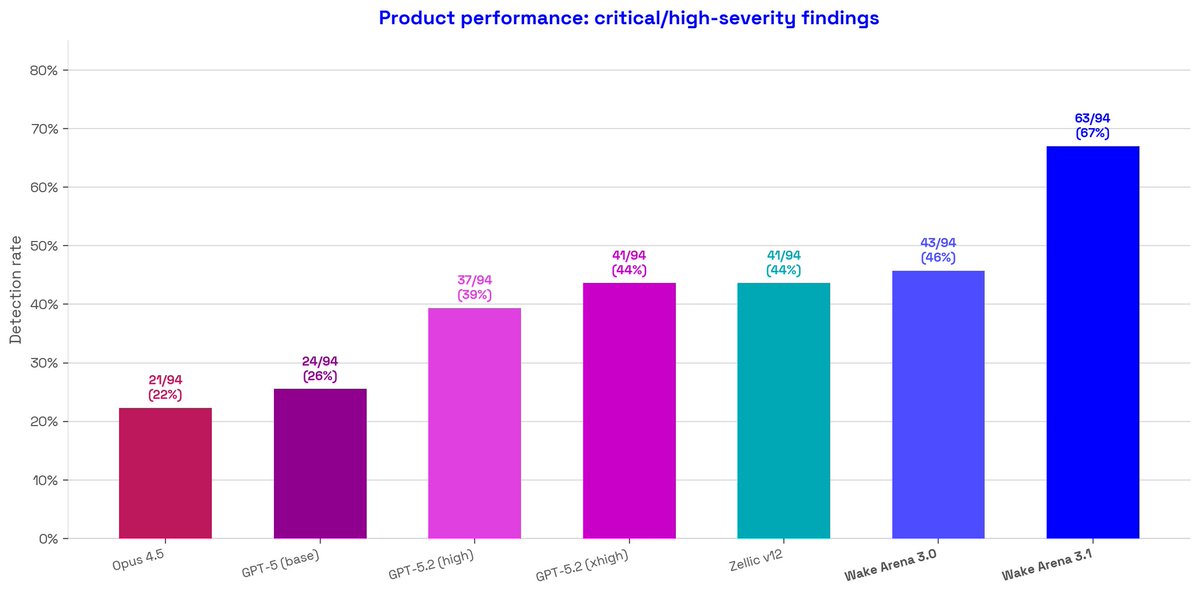
The full leaderboard: 9 systems, 94 critical/high-severity findings:
• Wake Arena 3.1: 63/94 (67%)
• Wake Arena 3.0: 43/94 (46%)
• GPT-5.2 xhigh: 41/94 (44%)
• Zellic v12: 41/94 (44%)
• GPT-5.2 high: 37/94 (39%)
• GPT-5 base: 24/94 (26%)
• Opus 4.5: 21/94 (22%)
The second-best result on this benchmark belongs to our previous version.
"Your only competition is yourself," they say.
Learn more ↓
2
2
4
340
May 12
Labels are from Code4rena and Sherlock, taken as-is.
• Follow @WakeFramework for that release
• Repost to keep AI audit benchmarks honest
Benchmarks: github.com/Ackee-Blockchain/…
Try Wake Arena:
ackee.xyz/wake/arena
2
75
May 5
Why use Wake's extension?
Remix-like testing without context switching:
Deploy contracts, fork mainnet, test functions through UI.
Test environments persist between sessions.
Everything you loved about Remix, enhanced for VS Code.
1
3
218
Apr 28
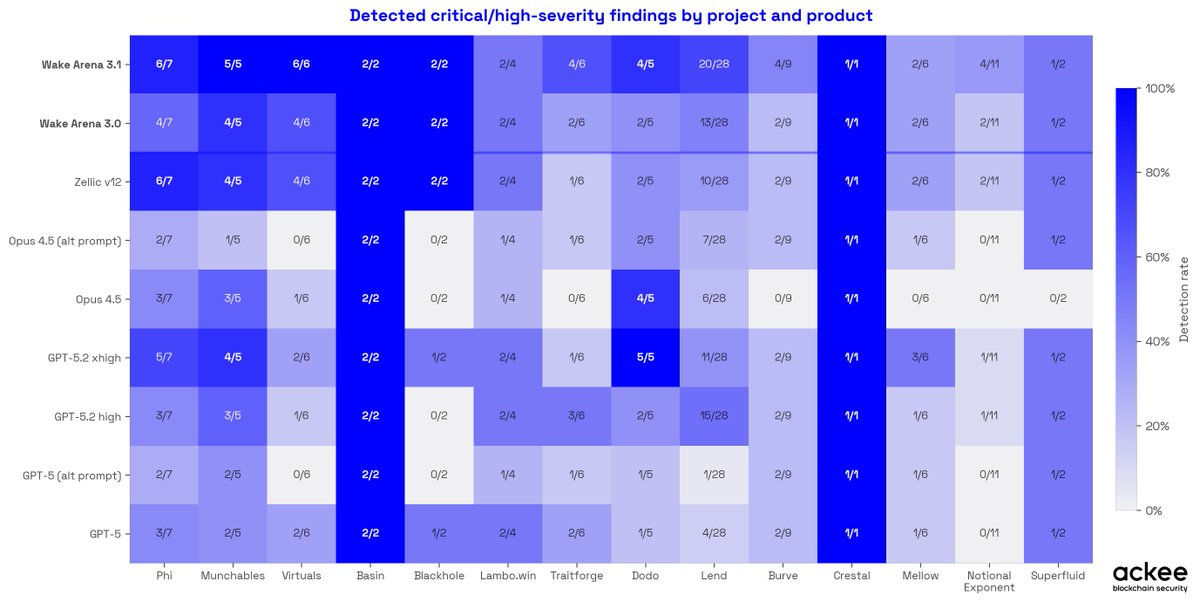
Most tools give you a headline number.
Here's every number.
9 models × 14 protocols = 126 cells.
Wake Arena 3.1 is the darkest row.
But look at where all systems struggle: Burve, Notional Exponent, Lambo.win.
No tool finds everything, and this chart makes that visible.
On Lend, the hardest protocol in the dataset with 28 high-severity findings:
Wake Arena 3.1 found 20.
Zellic v12 found 10.
Learn more ↓
1
3
166
Apr 28
Labels are from Code4rena and Sherlock, taken as ground truth. Some may have been miscategorized, a known limitation of any competition-based benchmark.
• Follow @WakeFramework for protocol-by-protocol breakdowns
• Repost to help the security community calibrate AI audit expectations
Benchmarks: github.com/Ackee-Blockchain/…
Try Wake Arena:
ackee.xyz/wake/arena
62
Apr 21
Why use Wake's extension?
Real-time vulnerability detection as you type:
Same detectors used in Lido, Aave, Axelar, Safe audits.
Red squiggles for security issues, not just syntax errors.
Only extension with proven audit framework integration.
1
1
9
494
Apr 14
The jump from Wake Arena 3.0 to 3.1 is a 21 percentage point increase in detection rate.
3.0 at 46% → 3.1 at 67%
Frontier LLMs plateau around 44%.
That ceiling is real: more compute, better prompts, same result.
The staircase:
Opus 4.5 (22%)
GPT-5 (26%)
GPT-5.2 xhigh (44%) = Zellic v12 (44%)
Wake Arena 3.0 (46%)
Wake Arena 3.1 (67%).
Breaking through that ceiling required a different architecture.
Not a different prompt.
Learn more ↓
1
4
8
993
Apr 14
Graph-driven reasoning.
Multi-agent cross-checking.
Static analysis context from 200 audits.
That's the architecture behind the step change.
• Follow @WakeFramework for technical breakdowns
• Repost if you build or secure smart contracts
Benchmarks: github.com/Ackee-Blockchain/…
Try Wake Arena:
ackee.xyz/wake/arena
73
Apr 3
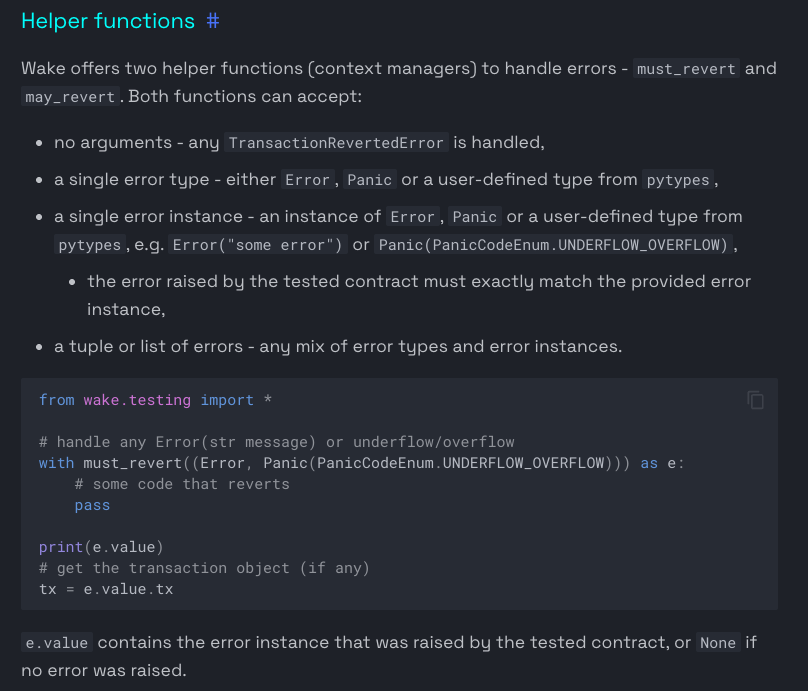
Access control tests that only verify the authorized caller leave the unauthorized caller untested.
Wake's must_revert() makes revert testing as clean as success testing.
Here's the pattern:
Thread ↓
9
8
292
Apr 3
3/ Extend it: assert the specific revert reason.
After the block, check the captured error to confirm the correct reason was returned — not just that something reverted.
Tests that verify the right error catch guard logic bugs, not just guard existence.
1
1
64
Apr 3
4/ Access control bugs and incorrect guard logic appear consistently in production audits.
Testing the revert path is the check most teams keep skipping.
• Follow @WakeFramework for more insights
• Repost to help others
Get Wake:
getwake.io
4
2
56