
Joined March 2026
- Tweets 1,027
- Following 1,048
- Followers 907
- Likes 13,691
153 Photos and videos


Pinned Tweet

May 17
💰📱 5 Phone AI Tools That Pay in Crypto
From ForU AI to Grass, your smartphone can now earn tokens while you chat, scroll, or share bandwidth.
🔹 ForU AI — get paid for training models
🔹 Grass — passive income from idle bandwidth
🔹 Gaia AI Phone — run AI nodes locally
🔹 Yoyo Bot — complete AI bounties for crypto
🔹 OpenRouter Mobile — host inference & earn ROUTER tokens
The AI‑crypto merge is happening in your pocket.
👇 Which one would you try first?
#Web3 #Airdrop #PiNetwork #CryptoAirdrops #Crypto #Web3Africa
117
Jun 14
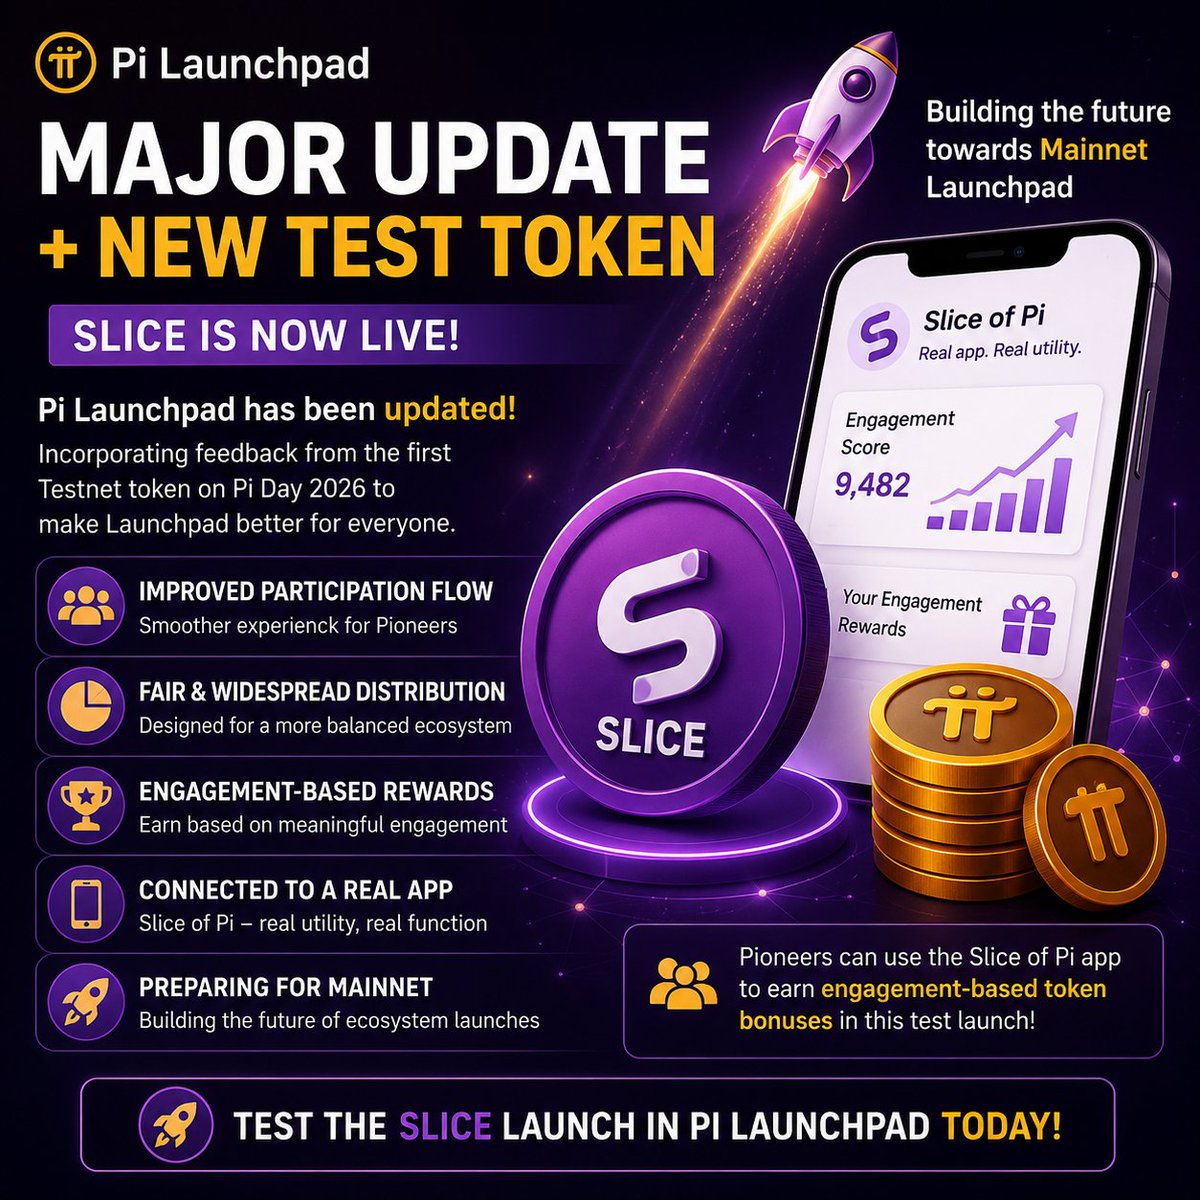
Pi Launchpad has been updated, and a new test token called SLICE is now live.
What stands out?
✅ Better participation flow
✅ Fairer token distribution
✅ Rewards tied to real engagement
✅ Connected to an actual app (Slice of Pi)
#PiNetwork #PiCoin #SLICE #Crypto #Web3
1
57
Jun 14
Looks like $Pi is preparing users for future Mainnet Launchpad projects while giving Pioneers another chance to learn the ecosystem.
If you've been waiting for signs of progress, this is one to watch.
Have you tried the SLICE launch yet? 👀
27
Jun 10
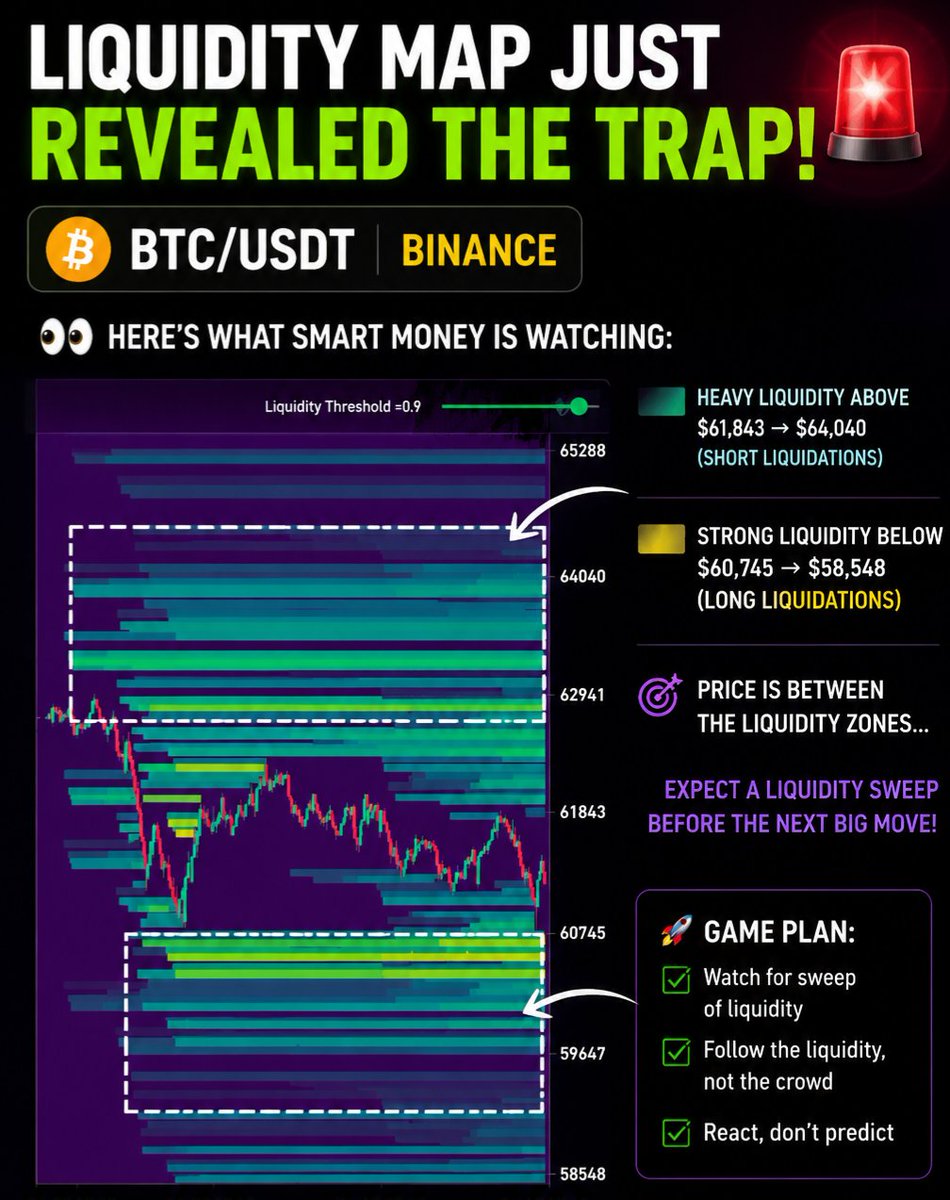
🚨 BTC Liquidation Heatmap Right Now.
Big liquidity walls at $60K–$62K and $64K .
Watch $61.8K–$62.9K closely.
Mobile tip: Use this for Liquidiction prediction trades.
SQUEEZE or DUMP?
Reply below 👇
Follow for daily heatmaps phone alpha 💰
#BTC #Airdrop #Web3Africa
7
Xenea Testnet is getting active!
Early users are already building on-chain activity and positioning themselves ahead of the crowd.
✅ Send a transaction
💬 Drop your wallet address
🔄 I'll interact back
#Xenea #Testnet #Airdrop #Web3 #CryptoCommunity
1
30
May 21
🚨 Binance picked another AI project for HODLer Airdrops 👀
Gensyn ( $AIGENSYN ) is becoming the 64th project on Binance HODLer Airdrops 🔥
Here’s why people are paying attention 👇
🤖 Gensyn is building infrastructure for AI
⚡ Focused on decentralized machine intelligence
💰 100M $AIGENSYN allocated for rewards
And if you held/subscribed BNB recently…
you could qualify for the distribution 👀
This is the part most people miss:
AI Crypto is no longer just hype.
Binance keeps pushing AI-related projects to millions of users.
Smart money is watching this narrative VERY closely. 👀
So the real question is:
Will AI tokens dominate the next bull run…
or is this another temporary trend? 🔥👇
#AI #Binance #Crypto #Airdrop
44
May 18
🚨 Pi Network is quietly positioning itself at the center of AI Web3 👀
Developers can now bring AI-created apps into Pi App Studio and connect directly to a network of 60M engaged users 🌍
That means:
🤖 Build with AI tools like:
• Claude Code
• Cursor
• Replit
• Codex
⚡ Then instantly plug into:
• Pi payments
• Real users
• A live ecosystem
This is the important part most people are missing 👇
AI can generate apps…
But distribution, users, and payments still matter.
Pi might already have all 3. 👀
So the real question is:
Is Pi building the next AI app ecosystem…
or is this still overhyped? 🔥👇
#Web3 #Airdrop #PiNetwork #CryptoAirdrops #Web3Africa
13
May 17
🚨 #Bitcoin bulls are losing control… and the charts are starting to show it 👀
$BTC failed to break above the key $82,885 resistance zone ❌
Now selling pressure is increasing as momentum weakens.
Analysts say the 4H chart still points to downside risk — especially if Bitcoin stays below the critical $78,203 level 📉
Translation? 👇
If bulls can’t reclaim resistance soon…
the market could be heading for a deeper correction.
But here’s the interesting part:
Big drops are usually where smart money accumulates 👀
So what do you think?
📈 Bounce incoming
or
📉 Bigger dump ahead? 🔥👇
#Web3 #Airdrop #PiNetwork #CryptoAirdrops #Crypto #Web3Africa
1
21
May 16
Liquidiction Testnet (Hyperliquid Prediction Markets Frontend)
Why it’s hot:
Active points system badges (testnet activity carries over)
Prediction markets on steroids
Super mobile-friendly
How to start in 5 mins on phone:
Go to Liquidiction testnet (@LiquidictionHL)
Connect wallet
(Phantom or Solflare works best)
Trade/test small predictions with test tokens (free)
Complete tasks for badges & leaderboard points
25
May 16
🔎 How traders use liquidation heatmaps
1️⃣ Identify clusters — zones where millions in leverage are stacked.
2️⃣ Watch for triggers — once price touches these levels, liquidations cascade.
3️⃣ Spot reversals — after forced selling, markets often bounce as liquidity gets absorbed.
4️⃣ Plan entries/exits — smart traders wait for these zones instead of chasing moves.
Example: $BTC saw $20.7M liquidations at $78,345 — volatility born right there.
💡 Heatmaps aren’t just charts. They’re risk maps.
👇 Do you trade into liquidation zones or fade them?
1
38
May 16
⚠️ Liquidation Heatmap Alert
Massive leverage zones lighting up on $BTC/ $USDT — over $20.7M in liquidations around $78,345.
When too many traders pile on the same side, liquidations trigger a domino effect — one forced sell leads to another.
🔥 Leverage amplifies profits… and pain.
Watch these zones closely — they’re where volatility is born.
👇 Do you trade around liquidation levels or avoid them entirely?
1
14
May 15
1/3
AI can generate apps in minutes.
But turning those ideas into real‑world utility?
That’s where most creators hit a wall.
Pi Network breaks that wall — giving you instant access to 60 million active users.
#PiNetwork #AI #Web3
1
13
May 15
2/3
💡 Build with AI tools like Codex, Claude Code, Replit, Cursor, or Lovable.
⚙️ Convert your project into a Pi App through Pi App Studio.
🚀 Launch directly inside Pi’s ecosystem.
Creation meets distribution — finally.
#CreatorEconomy #Innovation
1
10
May 15
3/3
This is how creators win in 2026:
AI builds. Pi Network distributes.
Together, they redefine what “launching an app” means.
Don’t just build.
Launch where the audience already exists.
#PiNetwork #AIApps #Web3
5