
Joined October 2025
- Tweets 7,290
- Following 1,870
- Followers 1,774
- Likes 1,076
1,490 Photos and videos


Pinned Tweet
🏆 Expected Gold Price per 10 gm in India & USD
(Projected, ± 50% Accuracy)
(Assuming 1 USD = ₹100)
━━━━━━━━━━━━━━━━━━
Year end 2026:
🟡 ₹1,90,000 → 💵 $1,900 (Possible range: ₹95,000 – ₹2,85,000)
Year end 2027:
🟡 ₹2,80,000 → 💵 $2,800 (Possible range: ₹1,40,000 – ₹4,20,000)
Year end 2028:
🟡 ₹4,00,000 → 💵 $4,000 (Possible range: ₹2,00,000 – ₹6,00,000)
Year end 2029:
🟡 ₹7,00,000 → 💵 $7,000 (Possible range: ₹3,50,000 – ₹10,50,000)
Year end 2030:
🟡 ₹10,00,000 → 💵 $10,000 (Possible range: ₹5,00,000 – ₹15,00,000)
Year end 2040:
🟡 ₹20–30 Lakh → 💵 $20,000–$30,000 (Possible range: ₹10–45 Lakh / $10,000–$45,000)
Year end 2050:
🟡 ₹80–100 Lakh → 💵 $80,000–$100,000
(Possible range: ₹40–150 Lakh / $40,000–$150,000)
1kg gold in 2050= 100 crore inr or $10 million 🎯💥
━━━━━━━━━━━━━━━━━━
Source: Market projections & historical gold trends (50% margin considered for long-term uncertainty).


5
3
5
483
WorldIndiaStats🌐 retweeted

30 Dec 2025
👑 Top 20 Most Beautiful Actresses in the World (2025) 🌍
20️⃣ 🇫🇷 Marion Cotillard ✨
19️⃣ 🇮🇹 Monica Bellucci 🌹
18️⃣ 🇺🇸 Scarlett Johansson 🔥
17️⃣ 🇬🇧 Keira Knightley 🎭
16️⃣ 🇺🇸 Emma Watson 📚
15️⃣ 🇪🇸 Penélope Cruz 💃
14️⃣ 🇺🇸 Angelina Jolie 🕊️
13️⃣ 🇦🇺 Margot Robbie 💎
12️⃣ 🇮🇳 Deepika Padukone 👑
11️⃣ 🇬🇧 Emily Blunt 🌸
🔟 🇺🇸 Gal Gadot 🛡️
9️⃣ 🇮🇳 Aishwarya Rai Bachchan 🌺
8️⃣ 🇺🇸 Natalie Portman 🎬
7️⃣ 🇬🇧 Elizabeth Hurley 💫
6️⃣ 🇸🇪 Alicia Vikander ❄️
5️⃣ 🇺🇸 Anne Hathaway 🌷
4️⃣ 🇲🇽 Salma Hayek 🔥
3️⃣ 🇿🇦 Charlize Theron ⚡
2️⃣ 🇨🇺 Ana de Armas 💖
1️⃣ 🇺🇸 Zendaya 🌟
📌 Source:
• IMDb Popularity Rankings (2024–2025)
• TC Candler – The 100 Most Beautiful Faces
• Vogue / People Magazine – Global Beauty & Style Lists
• Google Trends & Social Media Influence (2025)
#BeautifulActresses #WorldCinema #2025Ranking
#GlobalBeauty #Hollywood #Bollywood #Celebrities #FilmIcons

5
5
13
4,793
The Largest economies in the world, by GDP ( PPP).
1. 🇨🇳 China — $43.49 trillion
2. 🇺🇸 United States — $31.82 trillion
3. 🇮🇳 India — $19.14 trillion
4. 🇷🇺 Russia — $7.34 trillion
5. 🇯🇵 Japan — $6.92 trillion
6. 🇩🇪 Germany — $6.32 trillion
1
2
4
268
🇺🇸 United States GDP (Current Prices)
2013: $16.7 trillion
2026: $31.8 trillion
(IMF)
1
147
🌍 All 6 Continents : Top 1 Power Country ⚡
🌎 North America : 🇺🇸 United States
🌍 South America : 🇧🇷 Brazil
🌍 Europe : 🇩🇪 Germany
🌏 Asia : 🇨🇳 China
🌍 Africa : 🇳🇬 Nigeria
🌏 Oceania : 🇦🇺 Australia
📌 Basis : Economy size, population, military, regional influence
1
2
219
💰 Top 10 Largest Economies (Projected GDP 2026) 🌍
1️⃣ 🇺🇸 US : $31,821B
2️⃣ 🇨🇳 China : $20,651B
3️⃣ 🇩🇪 Germany : $5,328B
4️⃣ 🇮🇳 India : $4,506B
5️⃣ 🇯🇵 Japan : $4,464B
6️⃣ 🇬🇧 U.K. : $4,226B
7️⃣ 🇫🇷 France : $3,559B
8️⃣ 🇮🇹 Italy : $2,702B
9️⃣ 🇷🇺 Russia : $2,509B
🔟 🇨🇦 Canada : $2,421B
1
126
WorldIndiaStats🌐 retweeted
🇺🇸 Top 10 USA Youngest TV Actresses (All-Time)
––––––––––––––––––––
🔟 📺 Ariel Winter
9️⃣ 📺 Millie Bobby Brown
8️⃣ 📺 Maisie Williams
7️⃣ 📺 Chloë Grace Moretz
6️⃣ 📺 Miranda Cosgrove
5️⃣ 📺 Dakota Fanning
4️⃣ 📺 Raven-Symoné
3️⃣ 📺 Mary-Kate Olsen
2️⃣ 📺 Ashley Olsen
1️⃣ 📺 Shirley Temple
––––––––––––––––––––


5
5
16
16,044
WorldIndiaStats🌐 retweeted
⏸️🔥 Game of Thrones: Top 10 Most Paused Scenes
1️⃣ 🐉 👑 Daenerys walks out of fire (S1) 🇬🇧
2️⃣ 🌹 👸 Margaery Tyrell royal entrances & gowns (S3–S4) 🇬🇧
3️⃣ 🦁 👑 Cersei’s “Walk of Atonement” (S5) 🇬🇧
4️⃣ 🔥 🏹 Ygritte & Jon Snow cave scene (S3) 🇬🇧
5️⃣ 🌊 💎 Missandei beach & dragonstone scenes (S7–S8) 🇬🇧
6️⃣ 🐺 🗡️ Arya Stark transformation reveal (S6) 🇬🇧
7️⃣ 🔮 🌙 Melisandre necklace reveal (S6) 🇳🇱
8️⃣ 👑 🦂 Ellaria Sand & Sand Snakes introduction (S5) 🇬🇧
9️⃣ 🛡️ ⚔️ Brienne of Tarth knighted (S8) 🇬🇧
🔟 ❄️ 🖤 Sansa Stark glow-up moments (S6–S8) 🇬🇧


3
3
6
1,538
🇺🇸🇨🇳 United States vs China GDP (Nominal)
━━━━━━━━━━━━━━━━━━
2025
🇺🇸 United States 💵 $30.62 Trillion
🇨🇳 China 💵 ~$19.40 Trillion
2024
🇺🇸 United States 💵 $29.18 Trillion
🇨🇳 China 💵 ~$18.75 Trillion
2023
🇺🇸 United States 💵 $27.72 Trillion
🇨🇳 China 💵 ~$18.27 Trillion
2022
🇺🇸 United States 💵 $26.01 Trillion
🇨🇳 China 💵 ~$18.31 Trillion
2021
🇺🇸 United States 💵 $23.68 Trillion
🇨🇳 China 💵 ~$18.19 Trillion
2020
🇺🇸 United States 💵 $20.95 Trillion
🇨🇳 China 💵 ~$15.10 Trillion
2019
🇺🇸 United States 💵 $21.43 Trillion
🇨🇳 China 💵 ~$14.57 Trillion
2015
🇺🇸 United States 💵 $18.24 Trillion
🇨🇳 China 💵 ~$11.31 Trillion
2010
🇺🇸 United States 💵 $14.99 Trillion
🇨🇳 China 💵 ~$6.14 Trillion
2000
🇺🇸 United States 💵 $10.25 Trillion
🇨🇳 China 💵 ~$1.22 Trillion
1990
🇺🇸 United States 💵 $5.96 Trillion
🇨🇳 China 💵 ~$0.40 Trillion
1980
🇺🇸 United States 💵 $2.86 Trillion
🇨🇳 China 💵 ~$0.19 Trillion
1970
🇺🇸 United States 💵 $1.07 Trillion
🇨🇳 China 💵 ~$0.09 Trillion
1960
🇺🇸 United States 💵 $0.54 Trillion
🇨🇳 China 💵 ~$0.06 Trillion
━━━━━━━━━━━━━━━━━━
2
89
🇺🇸🇨🇳 United States vs China GDP (Nominal · Projected)
━━━━━━━━━━━━━━━━━━
2035
🇺🇸 United States 💵 ~$39.5 Trillion
🇨🇳 China 💵 ~$29.0 Trillion
2030
🇺🇸 United States 💵 ~$35.0 Trillion
🇨🇳 China 💵 ~$24.5 Trillion
2027
🇺🇸 United States 💵 ~$32.0 Trillion
🇨🇳 China 💵 ~$21.3 Trillion
2026
🇺🇸 United States 💵 ~$31.3 Trillion
🇨🇳 China 💵 ~$20.3 Trillion
2025
🇺🇸 United States 💵 $30.62 Trillion
🇨🇳 China 💵 ~$19.40 Trillion
━━━━━━━━━━━━━━━━━━
76
🇺🇸🇨🇳 United States vs China GDP (Nominal · Projected)
━━━━━━━━━━━━━━━━━━
2035
🇺🇸 United States 💵 ~$39.5 Trillion
🇨🇳 China 💵 ~$29.0 Trillion
2030
🇺🇸 United States 💵 ~$35.0 Trillion
🇨🇳 China 💵 ~$24.5 Trillion
2027
🇺🇸 United States 💵 ~$32.0 Trillion
🇨🇳 China 💵 ~$21.3 Trillion
2026
🇺🇸 United States 💵 ~$31.3 Trillion
🇨🇳 China 💵 ~$20.3 Trillion
2025
🇺🇸 United States 💵 $30.62 Trillion
🇨🇳 China 💵 ~$19.40 Trillion
━━━━━━━━━━━━━━━━━━
60
Top 20 Most Popular Official Languages (by Number of Countries) 🌍
---
1. 🇬🇧 English → 57 countries
2. 🇫🇷 French → 28 countries
3. 🇸🇦 Arabic → 27 countries
4. 🇪🇸 Spanish → 21 countries
5. 🇵🇹 Portuguese → 10 countries
6. 🇩🇪 German → 7 countries
7. 🇲🇦 Berber → 5 countries
8. 🇰🇪 Swahili → 5 countries
9. 🇷🇸 Serbo-Croatian → 5 countries
10. 🇷🇺 Russian → 4 countries
11. 🇲🇾 Malay-based → 4 countries
12. 🇮🇹 Italian → 4 countries
13. 🇨🇳 Chinese → 3 countries
14. 🇳🇱 Dutch → 3 countries
15. 🇮🇷 Persian → 3 countries
16. 🇵🇪 Quechua → 3 countries
17. 🇮🇳 Tamil → 3 countries
18. 🇹🇷 Turkish → 3 countries
19. 🇷🇴 Romanian → 3 countries
20. 🇪🇹 Amharic → 2 countries
---
1
1
79
Top 25 Nationalities of U.S. Immigrants 🇺🇸
🇲🇽 Mexico: 10.7M
🇮🇳 India: 2.8M
🇨🇳 China: 2.2M
🇵🇭 Philippines: 2.0M
🇸🇻 El Salvador: 1.4M
🇻🇳 Vietnam: 1.3M
🇨🇺 Cuba: 1.3M
🇩🇴 Dominican Republic: 1.3M
🇬🇹 Guatemala: 1.1M
🇰🇷 South Korea: 1.0M
🇨🇴 Colombia: 929k
🇭🇳 Honduras: 844k
🇨🇦 Canada: 821k
🇯🇲 Jamaica: 805k
🇭🇹 Haiti: 731k
🇬🇧 United Kingdom: 677k
🇻🇪 Venezuela: 668k
🇧🇷 Brazil: 619k
🇩🇪 Germany: 537k
🇪🇨 Ecuador: 518k
🇵🇪 Peru: 472k
🇳🇬 Nigeria: 448k
🇺🇦 Ukraine: 427k
🇮🇷 Iran: 407k
🇵🇰 Pakistan: 399k
1
90
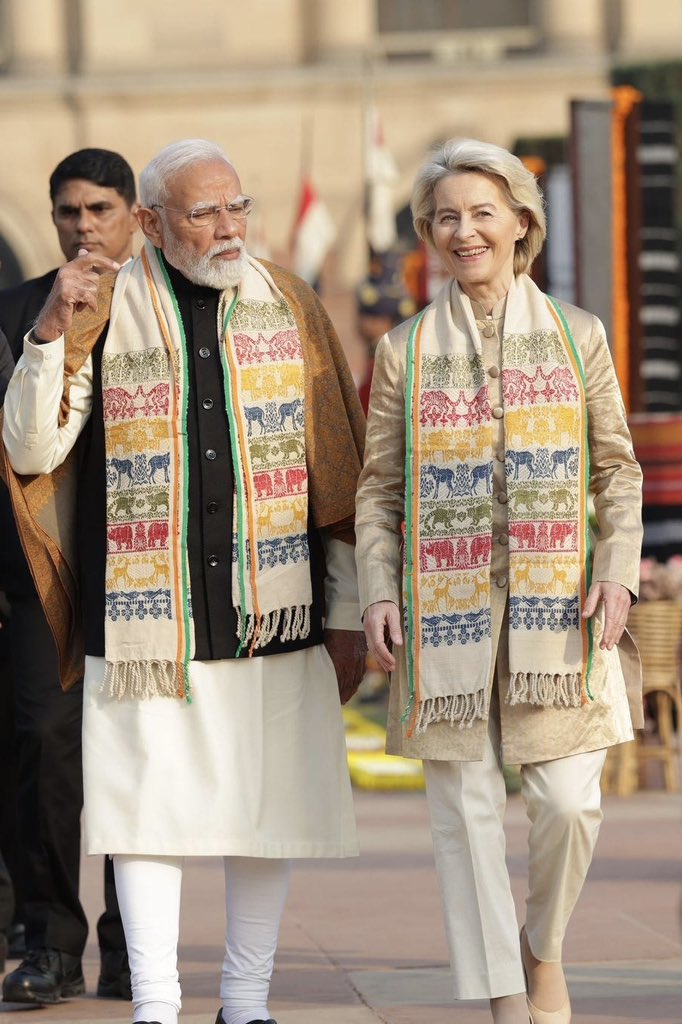
🌍🇮🇳🇪🇺 India–EU Free Trade Agreement (FTA): Key Facts
1️⃣ 📅 Deal concluded: 27 January 2026 (⏳ ~20 years of talks)
2️⃣ 🤝 Parties: 🇮🇳 India 🇪🇺 European Union (27 countries)
3️⃣ 👥 Market size: ~2️⃣ billion people
4️⃣ 💰 Global share: ~2️⃣5️⃣% of world GDP
5️⃣ 📦📊 Coverage: 🛒 Goods | 🧾 Services | 💼 Investment | ⚙️ Regulations
6️⃣ 💸📉 Tariffs:
• ✅ 🔟9️⃣0️⃣% goods → tariffs reduced/eliminated
• 💶 EU savings: ~€4️⃣ billion/year
• 🚗🇪🇺➡️🇮🇳 Car duty: 110% ➜ ~10% (phased)
• 🍷🫒⚙️ Cuts on wine, olive oil, machinery, chemicals
7️⃣ 🇮🇳📈 India gains:
• 👕💊💎🐟 Better EU access for exports
• 👷♂️👷♀️ Jobs & export growth
8️⃣ 🇪🇺📊 EU gains:
• 🏦🚚🧑💼 Better access to India’s services market
9️⃣ 🌐🔗 Strategic impact:
• 🧱 Stronger global supply chains
• 🔀 Reduced single-market dependence
🔟 📦💱 Current trade value: ~$135–140 billion/year
1️⃣1️⃣ 📝⏭️ Next step: Ratification by 🇮🇳 India & 🇪🇺 EU institutions
1️⃣2️⃣ 🗣️⭐ Leaders:
• 🇮🇳 Narendra Modi — “One of India’s largest FTAs”
• 🇪🇺 Ursula von der Leyen — “Mother of all trade deals”
1
57
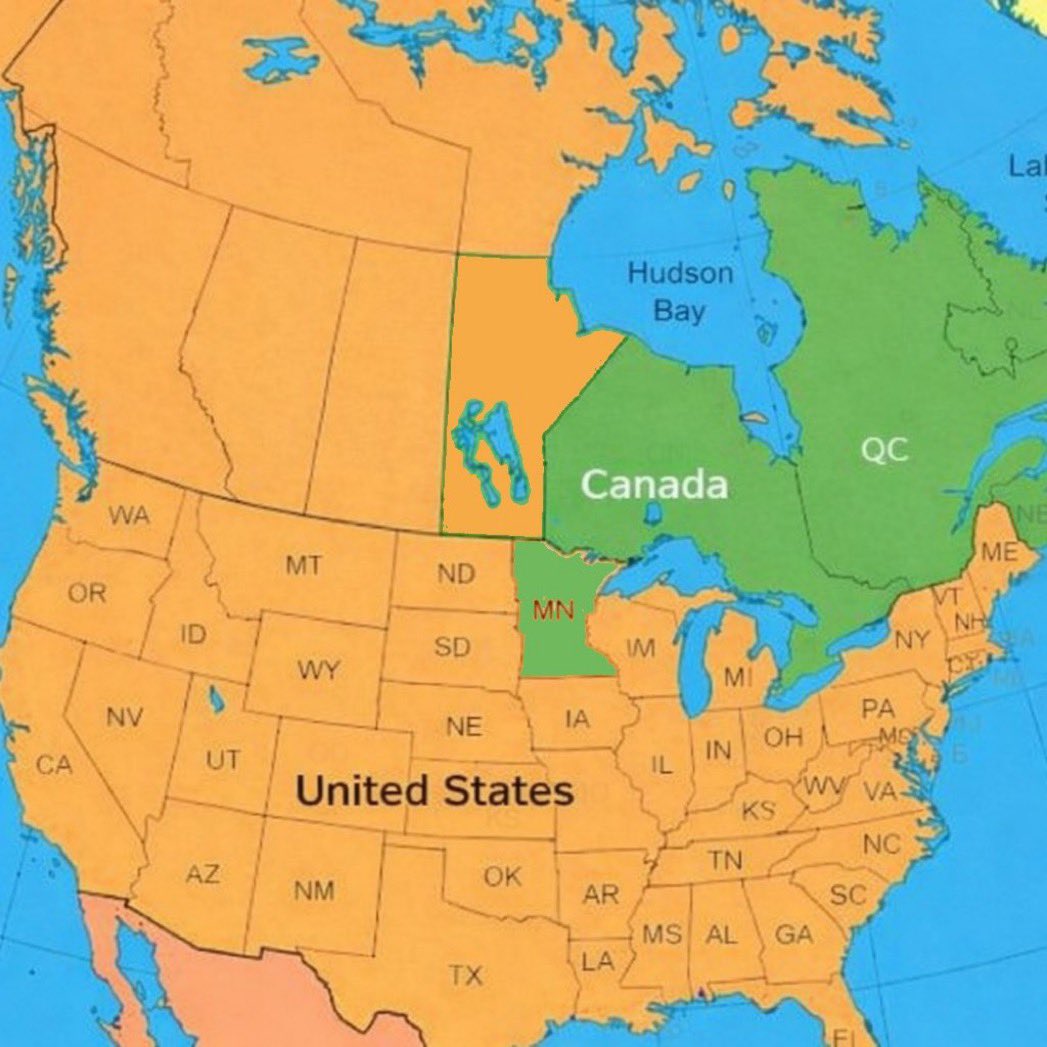
Is this possible?
For now 👇👇👇
🇨🇦 Canada vs 🇺🇸 United States — Key Comparison
🌍 Type:
Canada — Sovereign country, constitutional monarchy
USA — Sovereign country, federal republic
👥 Population:
Canada — ~39 million
USA — ~339 million
🗺️ Area:
Canada — 9.98 million km²
USA — 9.83 million km²
🏛️ Government:
Canada — Parliamentary democracy under constitutional monarchy
USA — Federal presidential republic
💰 GDP (Nominal):
Canada — ~$2.3 trillion
USA — ~$27 trillion
💱 Currency:
Canada — Canadian Dollar (CAD)
USA — US Dollar (USD)
💰 GDP per capita:
Canada — ~$59,000
USA — ~$79,000
📈 Economic Growth Rate:
Canada — ~1.5–2%
USA — ~2–3%
🏭 Economic Structure:
Canada — Services & natural resources-led
USA — Services, technology, and industry-led
🧠 Literacy Rate:
Canada — ~99%
USA — ~99%
🎓 Education System:
Canada — High-quality public education, strong universities
USA — Global leader in higher education and research
🧬 Life Expectancy:
Canada — ~82 years
USA — ~78 years
🧾 Official Language(s):
Canada — English & French
USA — No official federal language (English widely used)
👷 Labor Force:
Canada — ~20 million
USA — ~165 million
🏥 Healthcare System:
Canada — Universal public healthcare
USA — Mixed public-private healthcare, high costs
🪖 Military Strength:
Canada — Moderate-sized military, NATO member
USA — Largest military globally, nuclear power
🌱 Climate & Geography:
Canada — Cold temperate to arctic, vast forests & lakes
USA — Diverse climate: tropical, arid, temperate, arctic
🏛️ Political Influence:
Canada — Strong regional & UN influence
USA — Global superpower, permanent UN Security Council member
🌐 Internet Users:
Canada — ~36 million
USA — ~330 million
🏞️ Tourism:
Canada — ~22 million international tourists/year
USA — ~90–95 million international tourists/year
Source: World Bank, IMF, CIA World Factbook, UN
2
50
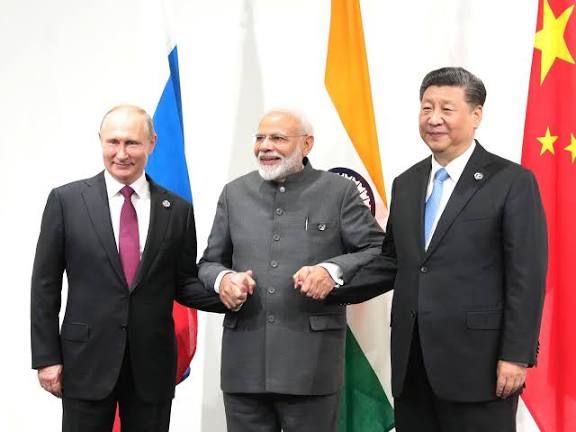
🇮🇳 India vs 🇷🇺 Russia vs 🇨🇳 China — Comparison
🌍 Type:
India — Sovereign country
Russia — Sovereign country
China — Sovereign country
👥 Population:
India — ~1.43 billion
Russia — ~145 million
China — ~1.41 billion
🗺️ Area:
India — 3.3 million km²
Russia — 17.1 million km²
China — 9.6 million km²
🏛️ Government:
India — Federal parliamentary democracy
Russia — Federal semi-presidential republic (authoritarian trend)
China — Single-party socialist republic
💰 GDP (Nominal):
India — ~$3.7 trillion
Russia — ~$2.3 trillion
China — ~$19 trillion
💱 Currency:
India — Indian Rupee (₹)
Russia — Russian Ruble (₽)
China — Renminbi / Yuan (¥)
💰 GDP per capita:
India — ~$2,600
Russia — ~$15,800
China — ~$13,500
📈 Economic Growth Rate:
India — ~6–7%
Russia — ~1–2%
China — ~5–6%
🏭 Economic Structure:
India — Services-led, agriculture & manufacturing growing
Russia — Energy exports-driven, industrial & defense
China — Manufacturing & exports-led, growing services
🧠 Literacy Rate:
India — ~77%
Russia — ~100%
China — ~97%
🎓 Education System:
India — Large IT & engineering focus
Russia — Strong science & technical universities
China — Strong STEM & vocational emphasis
🧬 Life Expectancy:
India — ~70 years
Russia — ~73 years
China — ~78 years
🧾 Official Language(s):
India — Hindi, English 21 others
Russia — Russian
China — Mandarin Chinese
👷 Labor Force:
India — Young & large workforce (~500 million)
Russia — Aging, shrinking (~72 million)
China — Aging workforce (~780 million)
🏥 Healthcare System:
India — Mixed public-private, out-of-pocket high
Russia — Universal public system, quality varies
China — Universal basic coverage, urban-rural gap
🪖 Military Strength:
India — Large standing army, nuclear power
Russia — Strongest nuclear arsenal, global power
China — Largest military by personnel, nuclear power
🌱 Climate Policy:
India — Development-focused, gradual green transition
Russia — Fossil fuel-driven, slow green adoption
China — Aggressive renewable investments, coal dependence
🏛️ Political Influence:
India — Regional leader, emerging global influence
Russia — Regional & global military influence
China — Global economic & geopolitical superpower
🌐 Internet Users:
India — ~900 million
Russia — ~118 million
China — ~1.05 billion
🏞️ Tourism:
India — ~10–15 million international tourists/year
Russia — ~25 million international tourists/year
China — ~65–70 million international tourists/year
Source: World Bank, IMF, UN, CIA World Factbook
2
41
🇮🇳 India vs 🇫🇷 France — Comparison:
1. 🌍 Type:
India — Sovereign country
France — Sovereign country
2. 👥 Population:
India — ~1.43 billion
France — ~68 million
3. 🗺️ Area:
India — 3.3 million km²
France — 643,801 km²
4. 🏛️ Government:
India — Federal parliamentary democracy
France — Unitary semi-presidential republic
5. 💰 GDP (Nominal):
India — ~$3.7 trillion
France — ~$3.0 trillion
6. 💱 Currency:
India — Indian Rupee (₹)
France — Euro (€)
7. 💰 GDP per capita:
India — ~$2,600
France — ~$44,000
8. 📈 Economic Growth Rate:
India — ~6–7%
France — ~1–2%
9. 🏭 Economic Structure:
India — Services-led, agriculture & manufacturing growing
France — Services-led, strong industry & high-tech
10. 🧠 Literacy Rate:
India — ~77%
France — ~99%
11. 🎓 Education System:
India — Large IT & engineering focus
France — Strong higher education & research institutions
12. 🧬 Life Expectancy:
India — ~70 years
France — ~82 years
13. 🧾 Official Language(s):
India — Hindi, English 21 others
France — French
14. 👷 Labor Force:
India — Young & large workforce (~500 million)
France — Aging workforce (~30 million)
15. 🏥 Healthcare System:
India — Mix of public & private, out-of-pocket high
France — Universal healthcare, ranked among best globally
16. 🪖 Military Strength:
India — One of the largest armies, nuclear power
France — Modern army, nuclear power, global influence
17. 🌱 Climate Policy:
India — Development-focused, gradual green transition
France — Aggressive climate & renewable energy policies
18. 🏛️ Political Influence:
India — Regional leader, emerging global power
France — EU leader, permanent UN Security Council member
19. 🌐 Internet Users:
India — ~900 million
France — ~60 million
20. 🏞️ Tourism:
India — ~10–15 million international tourists/year
France — ~90–95 million international tourists/year
Source: World Bank, IMF, UN, CIA World Factbook
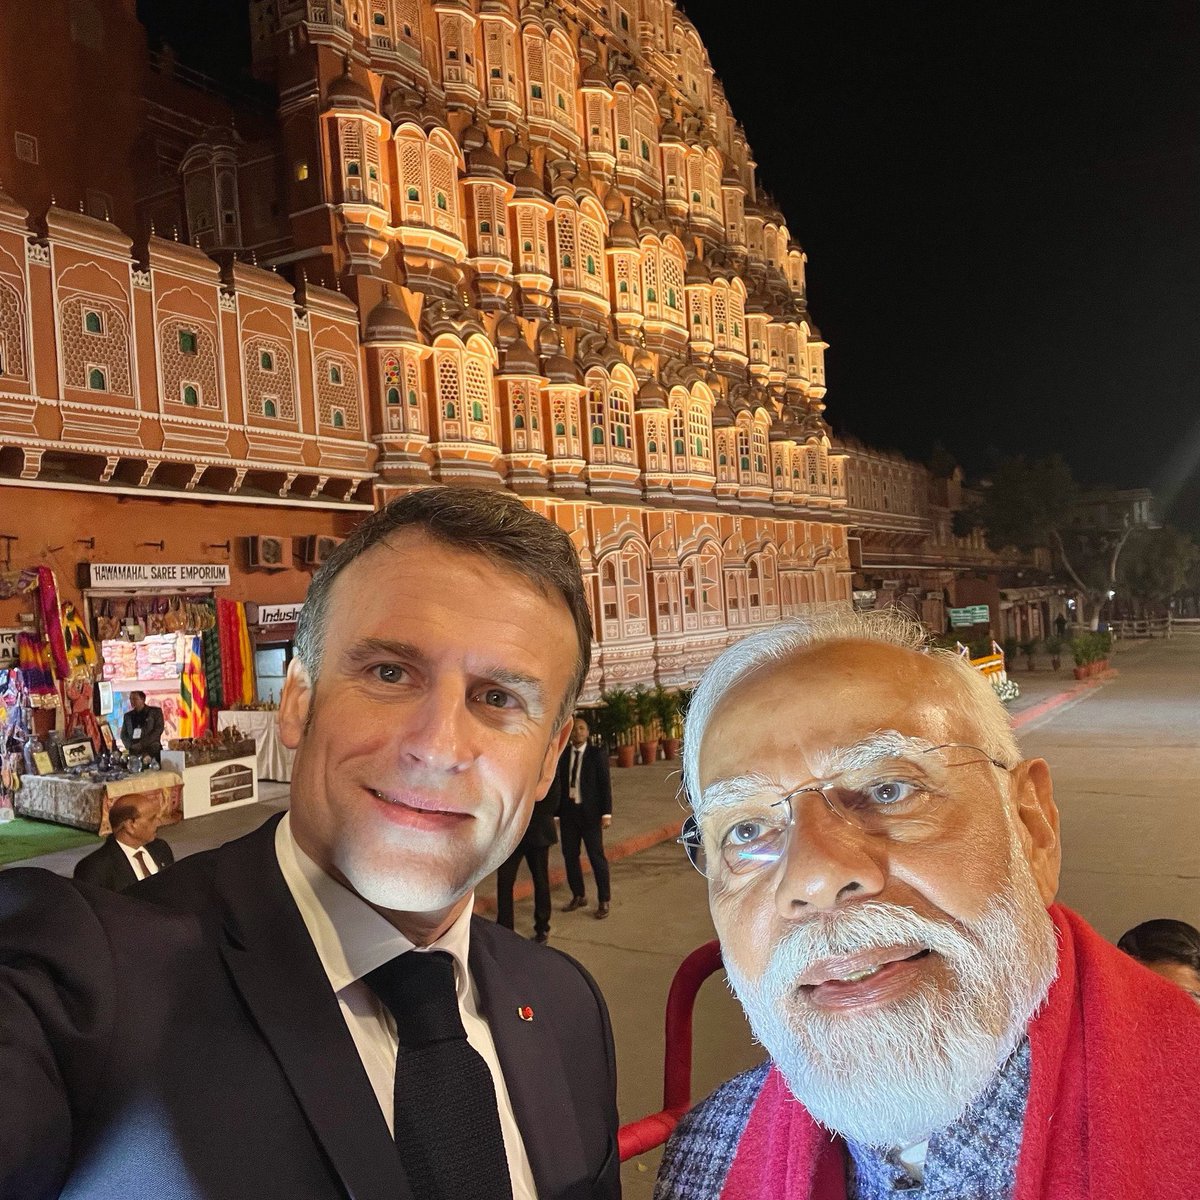
Jan 26

What a wonderful memory of the #RepublicDay we shared together in 2024! 🇮🇳🇫🇷
My dear friend @NarendraModi, dear Indian friends, my very best wishes on this great day of celebration. See you in February to continue building together!
2
45
🇭🇰 Countries with Significant Hong Kong–Origin Populations (Outside Hong Kong)
🇨🇦 Canada — ~209,000
🇺🇸 United States — ~212,000
🇬🇧 United Kingdom — ~117,700
🇦🇺 Australia — ~101,290
🇳🇱 Netherlands — ~9,757
🇮🇪 Ireland — a few thousand
🇳🇿 New Zealand — low thousands
🇸🇬 Singapore — smaller community
🇯🇵 Japan — hundreds
🇰🇷 South Korea — small expatriate group
Source: Census & Demographic Studies
2
32
Top 10 Longest-Running Car Nameplates in India 🚗🇮🇳
🇮🇳 Maruti Suzuki Omni — 1984–2019
🇮🇳 Maruti Suzuki Gypsy — 1985–2019
🇮🇳 Maruti Suzuki 800 — 1983–2014
🇮🇳 Maruti Suzuki Alto — 2000–Present
🇮🇳 Maruti Suzuki WagonR — 1999–Present
🇮🇳 Maruti Suzuki Swift — 2005–Present
🇮🇳 Maruti Suzuki Dzire — 2008–Present
🇮🇳 Toyota Innova — 2005–Present
🇮🇳 Mahindra Bolero — 2000–Present
🇮🇳 Tata Indica — 1998–2018
🖇️ Source: SIAM, Autocar India, Company Production Histories
2
71
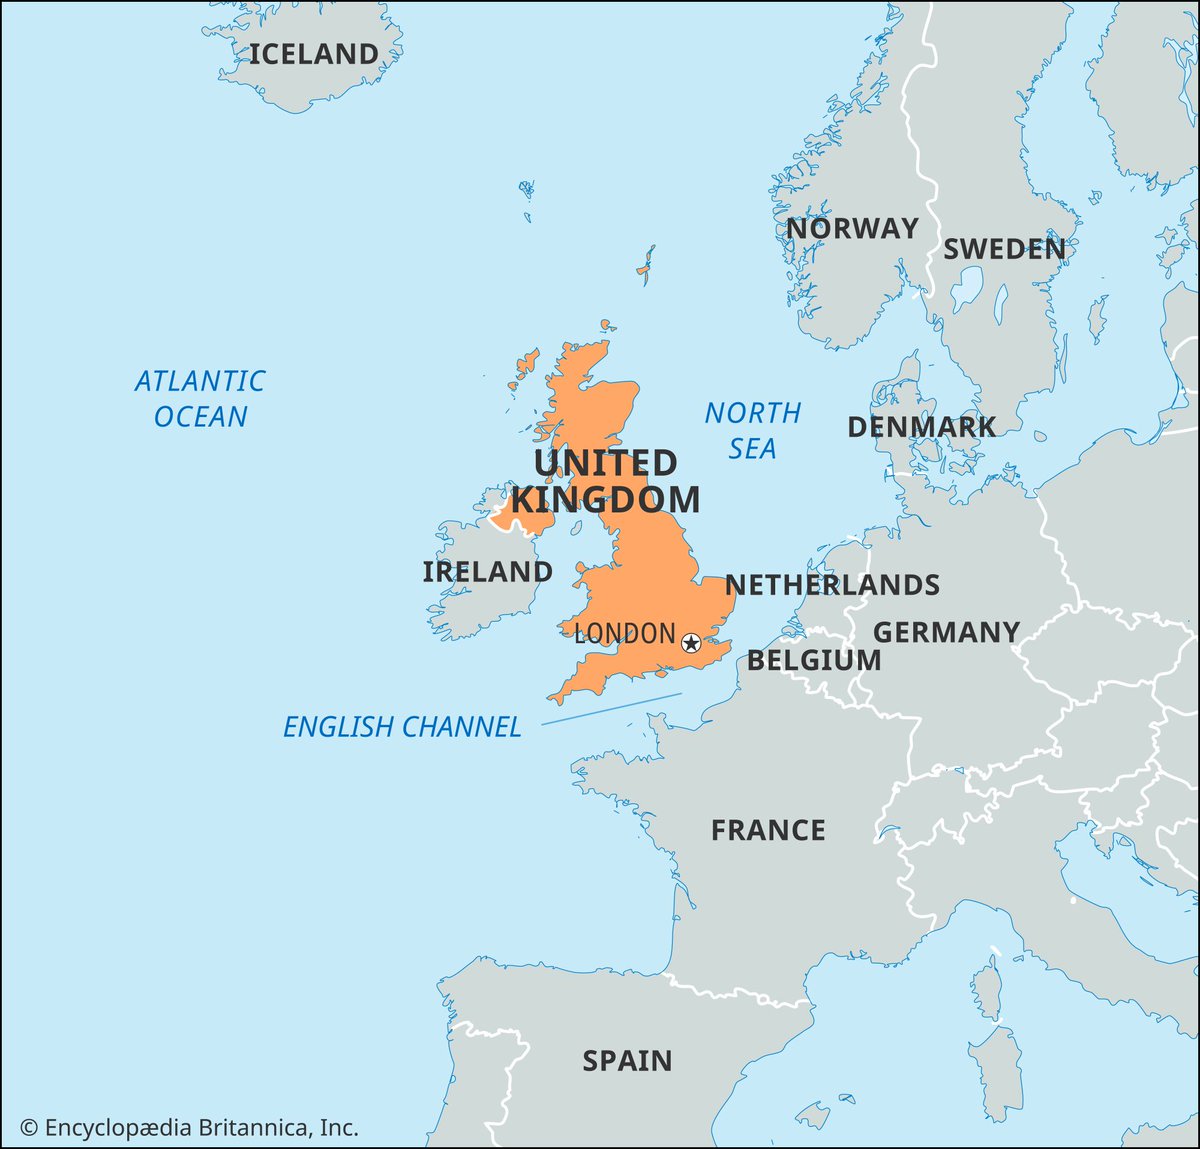
🇮🇳 India vs 🇪🇺 European Union — Comparison
🌍 Type:
India — Single sovereign country
EU — Political & economic union (27 countries)
👥 Population:
India — ~1.43 billion
EU — ~450 million
🗺️ Area:
India — ~3.3 million km²
EU — ~4.2 million km²
🏛️ Governance:
India — Federal parliamentary democracy
EU — Supranational member states’ governments
💰 GDP (Nominal):
India — ~$3.7 trillion
EU — ~$17 trillion
💰 GDP per capita:
India — ~$2,600
EU — ~$38,000
🏭 Economic Structure:
India — Services-led manufacturing growth
EU — Highly industrialized & service-driven
💱 Currency:
India — Indian Rupee (₹)
EU — Euro (€) (not all members)
📈 Growth Rate:
India — High (6–7% range)
EU — Low–moderate (1–2% range)
👷 Labor Force:
India — Young & large workforce
EU — Aging workforce
🧠 Median Age:
India — ~28 years
EU — ~44 years
🎓 Education & R&D:
India — Strong in IT & engineering, lower spend %
EU — High R&D spending, strong universities
🪖 Military:
India — One of world’s largest standing armies
EU — No single army; NATO-dependent
🌐 Global Influence:
India — Emerging global power, Global South leader
EU — Major regulatory & economic power
🌱 Climate Policy:
India — Development-focused, gradual transition
EU — Aggressive climate & green regulations
2
24
🌍 Global Demographic Projection 2025–2050 👥
📊 Projected Population Growth Rates (%)
🇺🇸 United States:
2025 Estimate: 0.7%
2050 Forecast: 0.4%
Change: -0.3 pp
🇮🇳 India:
2025 Estimate: 0.9%
2050 Forecast: 0.4%
Change: -0.5 pp
🇨🇳 China:
2025 Estimate: 0.2%
2050 Forecast: -0.2%
Change: -0.4 pp
🇳🇬 Nigeria:
2025 Estimate: 2.6%
2050 Forecast: 2.7%
Change: 0.1 pp
🇪🇹 Ethiopia:
2025 Estimate: 2.3%
2050 Forecast: 2.4%
Change: 0.1 pp
🇮🇩 Indonesia:
2025 Estimate: 1.0%
2050 Forecast: 0.8%
Change: -0.2 pp
🇵🇰 Pakistan:
2025 Estimate: 2.0%
2050 Forecast: 1.8%
Change: -0.2 pp
🇧🇩 Bangladesh:
2025 Estimate: 1.0%
2050 Forecast: 0.7%
Change: -0.3 pp
🇧🇷 Brazil:
2025 Estimate: 0.6%
2050 Forecast: 0.2%
Change: -0.4 pp
🇲🇽 Mexico:
2025 Estimate: 1.0%
2050 Forecast: 0.5%
Change: -0.5 pp
🇷🇺 Russia:
2025 Estimate: 0.1%
2050 Forecast: -0.3%
Change: -0.4 pp
🇯🇵 Japan:
2025 Estimate: -0.3%
2050 Forecast: -0.6%
Change: -0.3 pp
🇩🇪 Germany:
2025 Estimate: 0.1%
2050 Forecast: -0.1%
Change: -0.2 pp
🇬🇧 United Kingdom:
2025 Estimate: 0.5%
2050 Forecast: 0.3%
Change: -0.2 pp
🇫🇷 France:
2025 Estimate: 0.4%
2050 Forecast: 0.2%
Change: -0.2 pp
🇮🇹 Italy:
2025 Estimate: -0.1%
2050 Forecast: -0.4%
Change: -0.3 pp
Source: United Nations World Population Prospects (2024 Revision)
5
2
33