
Joined July 2010
- Tweets 14,444
- Following 817
- Followers 64,163
- Likes 12,713
3,141 Photos and videos


🇹🇷 Turkey FIFA Men's World Ranking Since 2000
2000 ➜ 🇹🇷 FIFA Ranking: 30th
2001 ➜ 🇹🇷 FIFA Ranking: 23rd
2002 ➜ 🇹🇷 FIFA Ranking: 9th
2003 ➜ 🇹🇷 FIFA Ranking: 8th
2004 ➜ 🇹🇷 FIFA Ranking: 13th
2005 ➜ 🇹🇷 FIFA Ranking: 11th
2006 ➜ 🇹🇷 FIFA Ranking: 26th
2007 ➜ 🇹🇷 FIFA Ranking: 16th
2008 ➜ 🇹🇷 FIFA Ranking: 10th
2009 ➜ 🇹🇷 FIFA Ranking: 41st
2010 ➜ 🇹🇷 FIFA Ranking: 31st
2011 ➜ 🇹🇷 FIFA Ranking: 28th
2012 ➜ 🇹🇷 FIFA Ranking: 40th
2013 ➜ 🇹🇷 FIFA Ranking: 45th
2014 ➜ 🇹🇷 FIFA Ranking: 48th
2015 ➜ 🇹🇷 FIFA Ranking: 21st
2016 ➜ 🇹🇷 FIFA Ranking: 24th
2017 ➜ 🇹🇷 FIFA Ranking: 42nd
2018 ➜ 🇹🇷 FIFA Ranking: 39th
2019 ➜ 🇹🇷 FIFA Ranking: 29th
2020 ➜ 🇹🇷 FIFA Ranking: 32nd
2021 ➜ 🇹🇷 FIFA Ranking: 37th
2022 ➜ 🇹🇷 FIFA Ranking: 44th
2023 ➜ 🇹🇷 FIFA Ranking: 37th
2024 ➜ 🇹🇷 FIFA Ranking: 28th
2025 ➜ 🇹🇷 FIFA Ranking: 25th
2026 ➜ 🇹🇷 FIFA Ranking: 22nd
Source: FIFA

2
6
60
16,980
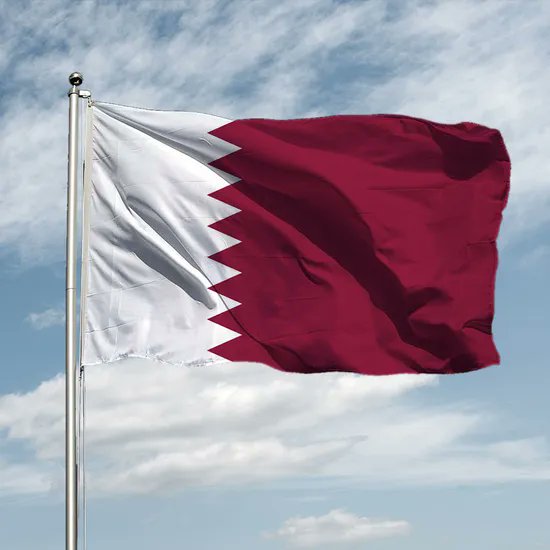
🇶🇦 Qatar FIFA Men's World Ranking
2000 ➜ 🇶🇦 FIFA Ranking: 72nd
2001 ➜ 🇶🇦 FIFA Ranking: 70th
2002 ➜ 🇶🇦 FIFA Ranking: 74th
2003 ➜ 🇶🇦 FIFA Ranking: 66th
2004 ➜ 🇶🇦 FIFA Ranking: 90th
2005 ➜ 🇶🇦 FIFA Ranking: 93rd
2006 ➜ 🇶🇦 FIFA Ranking: 81st
2007 ➜ 🇶🇦 FIFA Ranking: 86th
2008 ➜ 🇶🇦 FIFA Ranking: 88th
2009 ➜ 🇶🇦 FIFA Ranking: 95th
2010 ➜ 🇶🇦 FIFA Ranking: 113th
2011 ➜ 🇶🇦 FIFA Ranking: 89th
2012 ➜ 🇶🇦 FIFA Ranking: 113th
2013 ➜ 🇶🇦 FIFA Ranking: 101st
2014 ➜ 🇶🇦 FIFA Ranking: 96th
2015 ➜ 🇶🇦 FIFA Ranking: 92nd
2016 ➜ 🇶🇦 FIFA Ranking: 91st
2017 ➜ 🇶🇦 FIFA Ranking: 100th
2018 ➜ 🇶🇦 FIFA Ranking: 93rd
2019 ➜ 🇶🇦 FIFA Ranking: 55th
2020 ➜ 🇶🇦 FIFA Ranking: 58th
2021 ➜ 🇶🇦 FIFA Ranking: 48th
2022 ➜ 🇶🇦 FIFA Ranking: 60th
2023 ➜ 🇶🇦 FIFA Ranking: 58th
2024 ➜ 🇶🇦 FIFA Ranking: 48th
2025 ➜ 🇶🇦 FIFA Ranking: 55th
2026 ➜ 🇶🇦 FIFA Ranking: 53rd
Source: FIFA
3
86
9,410
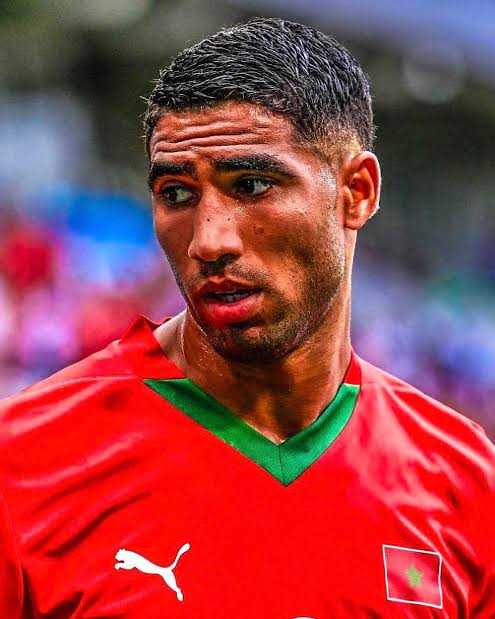
🇲🇦 Morocco FIFA Men's World Ranking
2000 ➜ 🇲🇦 FIFA Ranking: 28th
2001 ➜ 🇲🇦 FIFA Ranking: 36th
2002 ➜ 🇲🇦 FIFA Ranking: 35th
2003 ➜ 🇲🇦 FIFA Ranking: 38th
2004 ➜ 🇲🇦 FIFA Ranking: 33rd
2005 ➜ 🇲🇦 FIFA Ranking: 36th
2006 ➜ 🇲🇦 FIFA Ranking: 39th
2007 ➜ 🇲🇦 FIFA Ranking: 39th
2008 ➜ 🇲🇦 FIFA Ranking: 41st
2009 ➜ 🇲🇦 FIFA Ranking: 67th
2010 ➜ 🇲🇦 FIFA Ranking: 79th
2011 ➜ 🇲🇦 FIFA Ranking: 61st
2012 ➜ 🇲🇦 FIFA Ranking: 74th
2013 ➜ 🇲🇦 FIFA Ranking: 73rd
2014 ➜ 🇲🇦 FIFA Ranking: 82nd
2015 ➜ 🇲🇦 FIFA Ranking: 75th
2016 ➜ 🇲🇦 FIFA Ranking: 57th
2017 ➜ 🇲🇦 FIFA Ranking: 40th
2018 ➜ 🇲🇦 FIFA Ranking: 40th
2019 ➜ 🇲🇦 FIFA Ranking: 43rd
2020 ➜ 🇲🇦 FIFA Ranking: 35th
2021 ➜ 🇲🇦 FIFA Ranking: 28th
2022 ➜ 🇲🇦 FIFA Ranking: 11th
2023 ➜ 🇲🇦 FIFA Ranking: 13th
2024 ➜ 🇲🇦 FIFA Ranking: 14th
2025 ➜ 🇲🇦 FIFA Ranking: 11th
2026 ➜ 🇲🇦 FIFA Ranking: 7th
48
250
4,770
1,704,509
🇧🇷 Brazil FIFA Men's World Ranking
2000 ➜ 🇧🇷 FIFA Ranking: 1st
2001 ➜ 🇧🇷 FIFA Ranking: 3rd
2002 ➜ 🇧🇷 FIFA Ranking: 1st
2003 ➜ 🇧🇷 FIFA Ranking: 1st
2004 ➜ 🇧🇷 FIFA Ranking: 1st
2005 ➜ 🇧🇷 FIFA Ranking: 1st
2006 ➜ 🇧🇷 FIFA Ranking: 1st
2007 ➜ 🇧🇷 FIFA Ranking: 2nd
2008 ➜ 🇧🇷 FIFA Ranking: 5th
2009 ➜ 🇧🇷 FIFA Ranking: 2nd
2010 ➜ 🇧🇷 FIFA Ranking: 4th
2011 ➜ 🇧🇷 FIFA Ranking: 6th
2012 ➜ 🇧🇷 FIFA Ranking: 13th
2013 ➜ 🇧🇷 FIFA Ranking: 10th
2014 ➜ 🇧🇷 FIFA Ranking: 6th
2015 ➜ 🇧🇷 FIFA Ranking: 6th
2016 ➜ 🇧🇷 FIFA Ranking: 2nd
2017 ➜ 🇧🇷 FIFA Ranking: 2nd
2018 ➜ 🇧🇷 FIFA Ranking: 3rd
2019 ➜ 🇧🇷 FIFA Ranking: 3rd
2020 ➜ 🇧🇷 FIFA Ranking: 3rd
2021 ➜ 🇧🇷 FIFA Ranking: 2nd
2022 ➜ 🇧🇷 FIFA Ranking: 1st
2023 ➜ 🇧🇷 FIFA Ranking: 5th
2024 ➜ 🇧🇷 FIFA Ranking: 5th
2025 ➜ 🇧🇷 FIFA Ranking: 5th
2026 ➜ 🇧🇷 FIFA Ranking: 6th

4
25
512
53,230
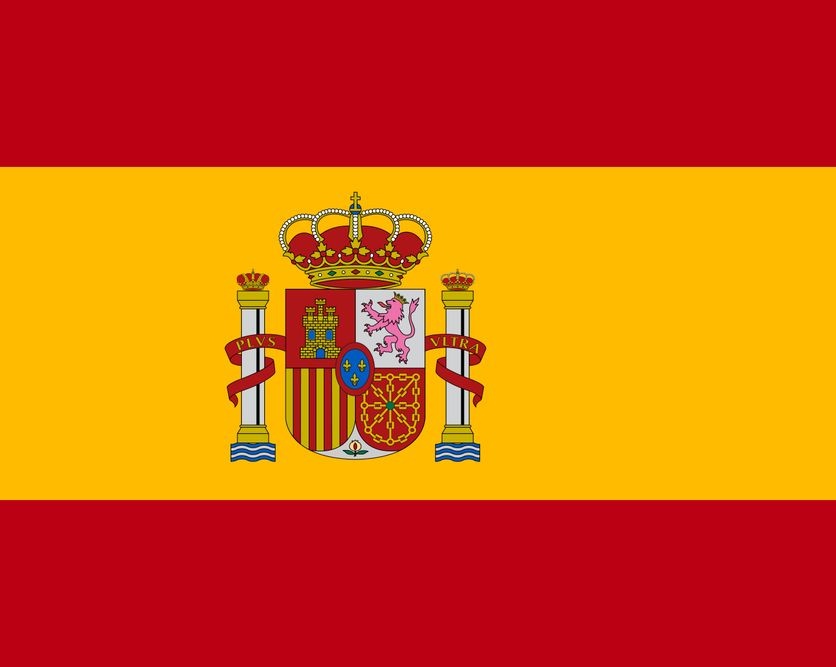
🇪🇸 Spain FIFA Men's World Ranking
2000 ➜ 🇪🇸 FIFA Ranking: 3rd
2001 ➜ 🇪🇸 FIFA Ranking: 5th
2002 ➜ 🇪🇸 FIFA Ranking: 7th
2003 ➜ 🇪🇸 FIFA Ranking: 3rd
2004 ➜ 🇪🇸 FIFA Ranking: 3rd
2005 ➜ 🇪🇸 FIFA Ranking: 5th
2006 ➜ 🇪🇸 FIFA Ranking: 7th
2007 ➜ 🇪🇸 FIFA Ranking: 4th
2008 ➜ 🇪🇸 FIFA Ranking: 1st
2009 ➜ 🇪🇸 FIFA Ranking: 1st
2010 ➜ 🇪🇸 FIFA Ranking: 1st
2011 ➜ 🇪🇸 FIFA Ranking: 1st
2012 ➜ 🇪🇸 FIFA Ranking: 1st
2013 ➜ 🇪🇸 FIFA Ranking: 1st
2014 ➜ 🇪🇸 FIFA Ranking: 9th
2015 ➜ 🇪🇸 FIFA Ranking: 3rd
2016 ➜ 🇪🇸 FIFA Ranking: 10th
2017 ➜ 🇪🇸 FIFA Ranking: 6th
2018 ➜ 🇪🇸 FIFA Ranking: 9th
2019 ➜ 🇪🇸 FIFA Ranking: 9th
2020 ➜ 🇪🇸 FIFA Ranking: 6th
2021 ➜ 🇪🇸 FIFA Ranking: 7th
2022 ➜ 🇪🇸 FIFA Ranking: 10th
2023 ➜ 🇪🇸 FIFA Ranking: 8th
2024 ➜ 🇪🇸 FIFA Ranking: 3rd
2025 ➜ 🇪🇸 FIFA Ranking: 1st
2026 ➜ 🇪🇸 FIFA Ranking: 2nd
4
38
903
64,920
⚽ Fastest Goals in FIFA World Cup History:
1. 🇹🇷 Hakan Şükür ⟶ 11s (2002)
2. 🇨🇿 Václav Mašek ⟶ 15s (1962)
3. 🇩🇪 Ernst Lehner ⟶ 25s (1934)
4. 🏴 Bryan Robson ⟶ 28s (1982)
5. 🇺🇸 Clint Dempsey ⟶ 30s (2014)
6. 🇫🇷 Bernard Lacombe ⟶ 31s (1978)
7. 🇸🇪 Arne Nyberg ⟶ 35s (1938)
8. 🇫🇷 Émile Veinante ⟶ 35s (1938)
9. 🇭🇺 Flórián Albert ⟶ 50s (1962)
10. 🇷🇴 Adalbert Deșu ⟶ 50s (1930)
11. 🇰🇵 Pak Seung-zin ⟶ 50s (1966)
12. 🇵🇾 Celso Ayala ⟶ 52s (1998)
13. 🇩🇰 Mathias Jørgensen ⟶ 55s (2018)
14. 🇩🇪 Uwe Seeler ⟶ 58s (1966)
15. 🇳🇱 Johan Neeskens ⟶ 90s (1974)
16. 🇧🇷 Rivellino ⟶ 91s (1978)
17. 🇩🇪 Karl-Heinz Rummenigge ⟶ 95s (1982)
18. 🇧🇷 Ronaldo ⟶ 96s (2002)
19. 🇦🇷 Martín Demichelis ⟶ 97s (2010)
20. 🇵🇹 Cristiano Ronaldo ⟶ 100s (2018)
A single moment can change a match, and these players struck before many fans had even settled into their seats.
The record set in 2002 remains one of the most remarkable starts ever seen on football's biggest stage
📊 Source: FIFA

7
24
203
43,689
World Insights retweeted

Jun 12
Elon Musk Net Worth Since 2000 💰
🇺🇸 2000 ⟶ 💵 $28M
🇺🇸 2001 ⟶ 💵 $34M
🇺🇸 2002 ⟶ 💵 $180M
🇺🇸 2003 ⟶ 💵 $160M
🇺🇸 2004 ⟶ 💵 $210M
🇺🇸 2005 💵 $250M
🇺🇸 2006 ⟶ 💵 $320M
🇺🇸 2007 ⟶ 💵 $400M
🇺🇸 2008 ⟶ 💵 $150M
🇺🇸 2009 ⟶ 💵 $350M
🇺🇸 2010 ⟶ 💵 $650M
🇺🇸 2011 ⟶ 💵 $680M
🇺🇸 2012 ⟶ 💵 $2.0B
🇺🇸 2013 ⟶ 💵 $2.7B
🇺🇸 2014 ⟶ 💵 $8.4B
🇺🇸 2015 ⟶ 💵 $13.0B
🇺🇸 2016 ⟶ 💵 $10.7B
🇺🇸 2017 ⟶ 💵 $13.9B
🇺🇸 2018 ⟶ 💵 $19.9B
🇺🇸 2019 ⟶ 💵 $22.3B
🇺🇸 2020 ⟶ 💵 $27.0B
🇺🇸 2021 ⟶ 💵 $151B
🇺🇸 2022 ⟶ 💵 $219B
🇺🇸 2023 ⟶ 💵 $180B
🇺🇸 2024 ⟶ 💵 $320B
🇺🇸 2025 ⟶ 💵 $342B
🇺🇸 2026 ⟶ 💵 $1.1T
📊 Source: Forbes, Bloomberg Billionaires Index, Reuters, SEC Filings

54
413
3,009
475,432
Elon Musk's networth is like rocket no one even appears close to him right now?
Do you think anyone could surpass him in the future?
Here are top 20 Richest People in the World:
1. 🇺🇸 Elon Musk ⟶ 💵 $1.1T
2. 🇺🇸 Larry Page ⟶ 💵 $294B
3. 🇺🇸 Sergey Brin ⟶ 💵 $271B
4. 🇺🇸 Jeff Bezos ⟶ 💵 $248B
5. 🇺🇸 Larry Ellison ⟶ 💵 $231B
6. 🇺🇸 Michael Dell ⟶ 💵 $225B
7. 🇺🇸 Mark Zuckerberg ⟶ 💵 $194B
8. 🇺🇸 Jensen Huang ⟶ 💵 $177B
9. 🇫🇷 Bernard Arnault ⟶ 💵 $156B
10. 🇺🇸 Warren Buffett ⟶ 💵 $144B
11. 🇪🇸 Amancio Ortega ⟶ 💵 $142B
12. 🇺🇸 Rob Walton ⟶ 💵 $139B
13. 🇺🇸 Jim Walton ⟶ 💵 $137B
14. 🇺🇸 Alice Walton ⟶ 💵 $128B
15. 🇲🇽 Carlos Slim ⟶ 💵 $127B
16. 🇺🇸 Steve Ballmer ⟶ 💵 $125B
17. 🇨🇦 Changpeng Zhao ⟶ 💵 $109B
18. 🇺🇸 Michael Bloomberg ⟶ 💵 $109B
19. 🇺🇸 Thomas Peterffy ⟶ 💵 $104B
20. 🇺🇸 Bill Gates ⟶ 💵 $104B
📊 Source: Forbes Real-Time Billionaires Index (June 2026)

11
22
141
14,398
World Insights retweeted
Jun 13
🚀 The Rise of Elon Musk
• Born in South Africa 🇿🇦
• Moved to North America with big ambitions
• Built Zip2 and sold it for $300M
• Helped create PayPal and sold it to eBay
• Risked nearly all his fortune on Tesla and SpaceX
People said:
❌ Electric cars would never work
❌ Reusable rockets were impossible
❌ SpaceX would fail
❌ Tesla would go bankrupt
❌ Twitter was a disaster purchase
What happened next?
⚡ Tesla helped make EVs mainstream
🚀 SpaceX transformed the space industry
🛰️ Starlink connected millions worldwide
📱 X remained one of the world's most influential platforms
🤖 xAI became a major AI competitor
Along the way:
• Nearly went bankrupt in 2008
• Slept in factories and offices
• Worked extreme hours
• Faced constant criticism and skepticism
• Kept building despite repeated setbacks
Today:
👑 World's richest person
🚀 Founder of multiple industry-defining companies
🌍 Influenced payments, transportation, energy, space, communications, social media and AI
💼 Created hundreds of thousands of jobs directly and indirectly
📈 Built companies worth trillions of dollars combined
Whether admired or criticized, Elon Musk has had an extraordinary impact across multiple industries, making him one of the most influential entrepreneurs of the 21st century.
@elonmusk

8
32
132
10,921
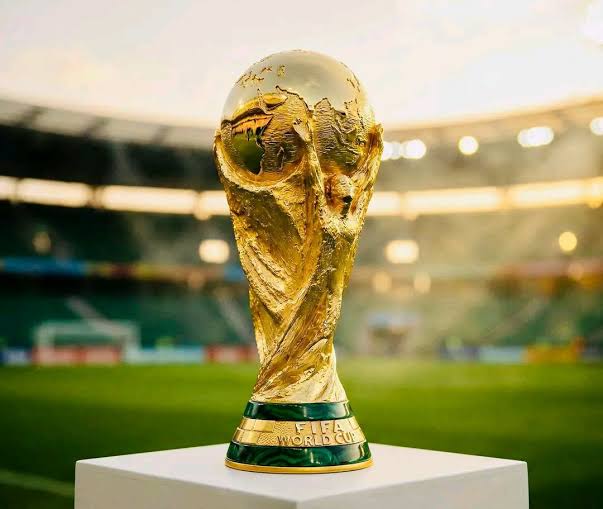
🏆 FIFA World Cup Winners Since 1930
1930 ⟶ 🇺🇾 Uruguay
1934 ⟶ 🇮🇹 Italy
1938 ⟶ 🇮🇹 Italy
1950 ⟶ 🇺🇾 Uruguay
1954 ⟶ 🇩🇪 West Germany
1958 ⟶ 🇧🇷 Brazil
1962 ⟶ 🇧🇷 Brazil
1966 ⟶ 🏴 England
1970 ⟶ 🇧🇷 Brazil
1974 ⟶ 🇩🇪 West Germany
1978 ⟶ 🇦🇷 Argentina
1982 ⟶ 🇮🇹 Italy
1986 ⟶ 🇦🇷 Argentina
1990 ⟶ 🇩🇪 West Germany
1994 ⟶ 🇧🇷 Brazil
1998 ⟶ 🇫🇷 France
2002 ⟶ 🇧🇷 Brazil
2006 ⟶ 🇮🇹 Italy
2010 ⟶ 🇪🇸 Spain
2014 ⟶ 🇩🇪 Germany
2018 ⟶ 🇫🇷 France
2022 ⟶ 🇦🇷 Argentina
🏆 Most Titles
1. 🇧🇷 Brazil ⟶ 5
2. 🇩🇪 Germany ⟶ 4
3. 🇮🇹 Italy ⟶ 4
4. 🇦🇷 Argentina ⟶ 3
5. 🇫🇷 France ⟶ 2
6. 🇺🇾 Uruguay ⟶ 2
7. 🏴 England ⟶ 1
8. 🇪🇸 Spain ⟶ 1
📊 Source: FIFA

2
15
118
8,854
Jun 13
Countries Elon Musk Is Wealthier Than
(Estimated Net Worth: 💵 $1.1T )
1. 🇨🇭 Switzerland ⟶ 💵 ~$1.15T GDP
2. 🇵🇱 Poland ⟶ 💵 ~$1.13T GDP
3. 🇮🇪 Ireland ⟶ 💵 ~$0.78T GDP
4. 🇧🇪 Belgium ⟶ 💵 ~$0.78T GDP
5. 🇸🇪 Sweden ⟶ 💵 ~$0.76T GDP
6. 🇦🇷 Argentina ⟶ 💵 ~$0.69T GDP
7. 🇸🇬 Singapore ⟶ 💵 ~$0.66T GDP
8. 🇦🇪 UAE ⟶ 💵 ~$0.62T GDP
9. 🇳🇴 Norway ⟶ 💵 ~$0.60T GDP
10. 🇨🇴 Colombia ⟶ 💵 ~$0.54T GDP
11. 🇻🇳 Vietnam ⟶ 💵 ~$0.53T GDP
12. 🇵🇭 Philippines ⟶ 💵 ~$0.51T GDP
13. 🇩🇰 Denmark ⟶ 💵 ~$0.50T GDP
14. 🇨🇱 Chile ⟶ 💵 ~$0.41T GDP
15. 🇵🇹 Portugal ⟶ 💵 ~$0.38T GDP
16. 🇫🇮 Finland ⟶ 💵 ~$0.34T GDP
17. 🇳🇿 New Zealand ⟶ 💵 ~$0.28T GDP
📊 Source: IMF GDP Estimates (2026) & Elon Musk Net Worth Estimates (~💵 $1.1T after SpaceX IPO)

18
68
622
63,417
Jun 13
Artificial intelligence and semiconductor firms are reshaping the corporate landscape, with tech companies occupying 8 of the world's top 10 spots.
Top 10 Most Valuable Companies (2026)
1. 🇺🇸 NVIDIA ⟶ 💵 $4.85T
2. 🇺🇸 Alphabet (Google) ⟶ 💵 $4.35T
3. 🇺🇸 Apple ⟶ 💵 $3.82T
4. 🇺🇸 Microsoft ⟶ 💵 $3.11T
5. 🇺🇸 Amazon ⟶ 💵 $2.56T
6. 🇹🇼 TSMC ⟶ 💵 $2.12T
7. 🇺🇸 Broadcom ⟶ 💵 $1.77T
8. 🇸🇦 Saudi Aramco ⟶ 💵 $1.76T
9. 🇺🇸 Meta ⟶ 💵 $1.45T
10. 🇺🇸 Tesla ⟶ 💵 $1.43T
📊 Source: CompaniesMarketCap, StockTitan, Reuters (June 2026)

14
48
3,889
Jun 12
Largest IPOs in U.S. History 💰🇺🇸
(By funds raised)
🇺🇸 SpaceX — $75.0B (2026)
🇺🇸 Alibaba — $21.8B (2014)
🇺🇸 Visa — $17.9B (2008)
🇺🇸 ENEL SpA — $16.5B (1999)
🇺🇸 Facebook (Meta) — $16.0B (2012)
🇺🇸 General Motors — $15.8B (2010)
🇺🇸 Deutsche Telekom — $13.0B (1996)
🇺🇸 Rivian — $11.9B (2021)
🇺🇸 AT&T Wireless — $10.6B (2000)
🇺🇸 Kraft Foods — $8.7B (2001)
🇺🇸 Uber — $8.1B (2019)
🇺🇸 ARM Holdings — $4.9B (2023)
🇺🇸 DoorDash — $3.4B (2020)
🇺🇸 Robinhood — $2.1B (2021)
🇺🇸 Coinbase — Direct Listing (2021)
1
7
21
2,342
Jun 12
💰 Richest Person in the World Since 2000
2000 ⟶ 🇺🇸 Bill Gates
2001 ⟶ 🇺🇸 Bill Gates
2002 ⟶ 🇺🇸 Bill Gates
2003 ⟶ 🇺🇸 Bill Gates
2004 ⟶ 🇺🇸 Bill Gates
2005 ⟶ 🇺🇸 Bill Gates
2006 ⟶ 🇺🇸 Bill Gates
2007 ⟶ 🇺🇸 Bill Gates
2008 ⟶ 🇺🇸 Warren Buffett
2009 ⟶ 🇺🇸 Bill Gates
2010 ⟶ 🇲🇽 Carlos Slim
2011 ⟶ 🇲🇽 Carlos Slim
2012 ⟶ 🇲🇽 Carlos Slim
2013 ⟶ 🇲🇽 Carlos Slim
2014 ⟶ 🇲🇽 Carlos Slim
2015 ⟶ 🇺🇸 Bill Gates
2016 ⟶ 🇺🇸 Bill Gates
2017 ⟶ 🇺🇸 Bill Gates
2018 ⟶ 🇺🇸 Jeff Bezos
2019 ⟶ 🇺🇸 Jeff Bezos
2020 ⟶ 🇺🇸 Jeff Bezos
2021 ⟶ 🇺🇸 Jeff Bezos
2022 ⟶ 🇺🇸 Elon Musk
2023 ⟶ 🇺🇸 Elon Musk
2024 ⟶ 🇺🇸 Elon Musk
2025 ⟶ 🇺🇸 Elon Musk
2026 ⟶ 🇺🇸 Elon Musk
📊 Source: Forbes World's Billionaires List

16
48
410
53,145
Jun 12
🇦🇷 Ethnically European Population in Argentina
2000 ⟶ 🇦🇷 ~85.0%
2001 ⟶ 🇦🇷 ~84.8%
2002 ⟶ 🇦🇷 ~84.6%
2003 ⟶ 🇦🇷 ~84.4%
2004 ⟶ 🇦🇷 ~84.2%
2005 ⟶ 🇦🇷 ~84.0%
2006 ⟶ 🇦🇷 ~83.8%
2007 ⟶ 🇦🇷 ~83.6%
2008 ⟶ 🇦🇷 ~83.4%
2009 ⟶ 🇦🇷 ~83.2%
2010 ⟶ 🇦🇷 ~83.0%
2011 ⟶ 🇦🇷 ~82.8%
2012 ⟶ 🇦🇷 ~82.6%
2013 ⟶ 🇦🇷 ~82.4%
2014 ⟶ 🇦🇷 ~82.2%
2015 ⟶ 🇦🇷 ~82.0%
2016 ⟶ 🇦🇷 ~81.8%
2017 ⟶ 🇦🇷 ~81.6%
2018 ⟶ 🇦🇷 ~81.4%
2019 ⟶ 🇦🇷 ~81.2%
2020 ⟶ 🇦🇷 ~81.0%
2021 ⟶ 🇦🇷 ~80.8%
2022 ⟶ 🇦🇷 ~80.6%
2023 ⟶ 🇦🇷 ~80.4%
2024 ⟶ 🇦🇷 ~80.2%
2025 ⟶ 🇦🇷 ~80.0%
2026 ⟶ 🇦🇷 ~79.8%
Source: INDEC census data, migration statistics, genetic ancestry studies, and demographic research. Argentina does not officially classify citizens by race. Figures are estimates based on ancestry, self-identification, immigration patterns, and demographic studies. "Ethnically European" includes people primarily of Spanish, Italian, German, French, Eastern European, and other European ancestries.
30
23
322
26,006
Jun 12
🇵🇱 Ethnically European Population in Poland
2000 ⟶ 🇵🇱 ~99.4%
2001 ⟶ 🇵🇱 ~99.4%
2002 ⟶ 🇵🇱 ~99.3%
2003 ⟶ 🇵🇱 ~99.3%
2004 ⟶ 🇵🇱 ~99.3%
2005 ⟶ 🇵🇱 ~99.2%
2006 ⟶ 🇵🇱 ~99.2%
2007 ⟶ 🇵🇱 ~99.2%
2008 ⟶ 🇵🇱 ~99.1%
2009 ⟶ 🇵🇱 ~99.1%
2010 ⟶ 🇵🇱 ~99.0%
2011 ⟶ 🇵🇱 ~99.0%
2012 ⟶ 🇵🇱 ~98.9%
2013 ⟶ 🇵🇱 ~98.9%
2014 ⟶ 🇵🇱 ~98.8%
2015 ⟶ 🇵🇱 ~98.8%
2016 ⟶ 🇵🇱 ~98.7%
2017 ⟶ 🇵🇱 ~98.6%
2018 ⟶ 🇵🇱 ~98.5%
2019 ⟶ 🇵🇱 ~98.4%
2020 ⟶ 🇵🇱 ~98.3%
2021 ⟶ 🇵🇱 ~98.1%
2022 ⟶ 🇵🇱 ~97.9%
2023 ⟶ 🇵🇱 ~97.7%
2024 ⟶ 🇵🇱 ~97.5%
2025 ⟶ 🇵🇱 ~97.3%
2026 ⟶ 🇵🇱 ~97.1%
Source: (GUS), Polish Census data, residence permit statistics, migration reports, and demographic studies. Poland does not officially collect racial data; figures are demographic estimates based on nationality, ancestry, country of birth, and migration patterns. "Ethnically European" includes native Poles and other European-origin populations (e.g., Ukrainians, Belarusians, Germans, Lithuanians, and other Europeans).

3
11
199
15,216
Jun 12
🎓 Universities Producing the Most Startup Founders (2014–2025)
1. 🇺🇸 UC Berkeley ⟶ 1,804
2. 🇺🇸 Stanford University ⟶ 1,519
3. 🇺🇸 Harvard University ⟶ 1,355
4. 🇺🇸 University of Pennsylvania (UPenn) ⟶ 1,206
5. 🇺🇸 MIT ⟶ 1,131
6. 🇺🇸 Cornell University ⟶ 944
7. 🇮🇱 Tel Aviv University ⟶ 865
8. 🇺🇸 University of Texas at Austin ⟶ 850
9. 🇺🇸 University of Michigan ⟶ 845
10. 🇮🇱 Technion – Israel Institute of Technology ⟶ 783
11. 🇺🇸 UIUC ⟶ 751
12. 🇺🇸 Yale University ⟶ 710
13. 🇺🇸 UCLA ⟶ 679
14. 🇺🇸 Columbia University ⟶ 671
15. 🇺🇸 Princeton University ⟶ 656
16. 🇺🇸 USC ⟶ 644
17. 🇨🇦 University of Toronto ⟶ 643
18. 🇨🇦 University of Waterloo ⟶ 639
19. 🇮🇳 IIT Bombay ⟶ 627
20. 🇺🇸 Duke University ⟶ 625
📊 Source: PitchBook (Undergraduate founders with venture funding, 2014–2025)

3
14
2,331
Jun 12
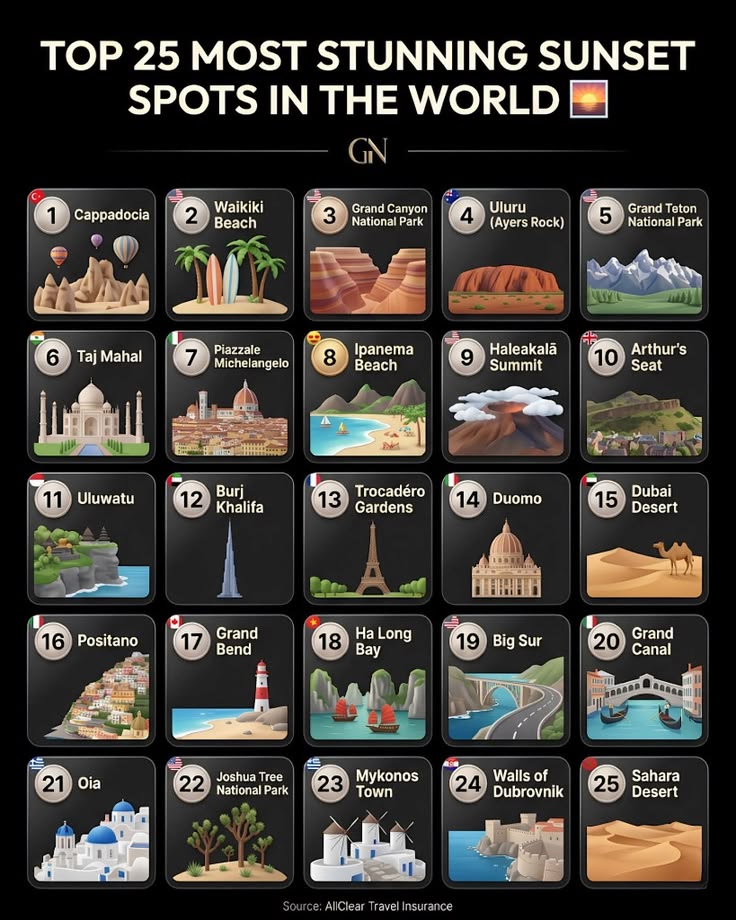
🌅 Top 25 Most Stunning Sunset Spots in the World
1. 🇹🇷 Cappadocia
2. 🇺🇸 Waikiki Beach
3. 🇺🇸 Grand Canyon National Park
4. 🇦🇺 Uluru (Ayers Rock)
5. 🇺🇸 Grand Teton National Park
6. 🇮🇳 Taj Mahal
7. 🇮🇹 Piazzale Michelangelo
8. 🇧🇷 Ipanema Beach
9. 🇺🇸 Haleakalā Summit
10. 🇬🇧 Arthur's Seat
11. 🇮🇩 Uluwatu
12. 🇦🇪 Burj Khalifa
13. 🇫🇷 Trocadéro Gardens
14. 🇮🇹 Duomo Florence
15. 🇦🇪 Dubai Desert
16. 🇮🇹 Positano
17. 🇨🇦 Grand Bend
18. 🇻🇳 Ha Long Bay
19. 🇺🇸 Big Sur
20. 🇮🇹 Grand Canal Venice
21. 🇬🇷 Oia Santorini
22. 🇺🇸 Joshua Tree National Park
23. 🇬🇷 Mykonos Town
24. 🇭🇷 Walls of Dubrovnik
25. 🇲🇦 Sahara Desert
📊 Source: AllClear Travel Insurance
1
7
34
2,410