
276 Photos and videos


For many people, the bitcoin:native chart looks chaotic and manipulated. But now take a look at how beautiful the chart becomes when the geometry of coefficients and data falls into the right places and with the right periodicity.
Now the chart no longer looks so chaotic, and the price movement begins to gain meaning and understanding.
This is the chart you need to sit down and study in as much detail as possible so that you can understand why we saw certain movements in the market and how they are interconnected.
The situation currently looks good. The news backdrop is also aligning itself to deliver the trigger at the right moment. (No, the news is not aligning itself for BTC specifically, but for the markets as a whole. You simply do not see the reactions that various news events create outside of crypto. Crypto is just one piece of a much larger game, and at the moment, far from the largest one.)
Overlay stablecoin dominance onto this chart—you can find my post about it below—and you will see where price is heading right now and why it should stop there.
Data does not lie. Your thoughts do.
So what are the data telling you about BTC right now?
2
1
10
6,655
After the first press conference by the new Fed Chair, Kevin Warsh, DXY has defined its direction.
The next target is 102 — exactly what I was talking about earlier.
And you can be a brilliant fundamental analyst, but there is one fact:
The person who knows how to read a chart will always be ahead of the person who only knows how to read fundamentals, because news always chases price.
The current Fed policy suggests that we are likely to see at least two rate hikes this year. And if that is combined with a breakdown of the Iran deal, we could see DXY move significantly higher.
As a consequence, that is not particularly good for the cryptocurrency market as a whole, because large pools of capital are currently sitting in defensive assets and, given the current macroeconomic backdrop, are not especially eager to move into risk assets.
Overlay that reality onto the chart, and the picture of what may come next becomes much clearer.
Convince me otherwise if you can.

The Dollar Will Absorb Liquidity!
The DXY has been consolidating for a long time, and I expect the current or upcoming week to provide a logical breakout toward the 102 level. Such a move would likely pull liquidity from other markets, creating pressure across risk assets.
In my view, this could happen against the backdrop of escalating tensions involving Iran. No matter how much Trump may want to secure another deal that primarily benefits the United States, I don't believe Iran will accept the terms currently being offered.
That said, from a longer-term perspective, I still expect the DXY to eventually move down toward the 80–85 range. In my opinion, the U.S. economy remains in a weak position structurally, and the probability of higher interest rates becoming the baseline scenario is increasing. The Federal Reserve is generally more willing to tolerate elevated inflation than a deep recession, which will continue to shape monetary policy decisions going forward.
This is my personal market view and should not be considered financial advice.

1
883
The new consolidation boundaries for bitcoin:native have been defined.
We now have two clean sets of data supporting the same concept: accumulation before the next major move.
The new Fed rhetoric suggests that we are likely facing at least two more rate hikes this year, which does not align particularly well with a sustained rally in risk assets.
And that tells us one thing:
As long as the rhetoric remains unchanged, and there is no clear signal of market stimulus or a new round of monetary expansion, the environment remains restrictive for risk-taking.
A new wave of liquidity injections and money printing will likely come only after one of those future rate hikes forces a response from policymakers.
Therefore, unless we see a significant economic shock—such as a breakdown of the agreement between Iran and the United States—price is likely to continue trading within this range for the time being.
3
14
10
599
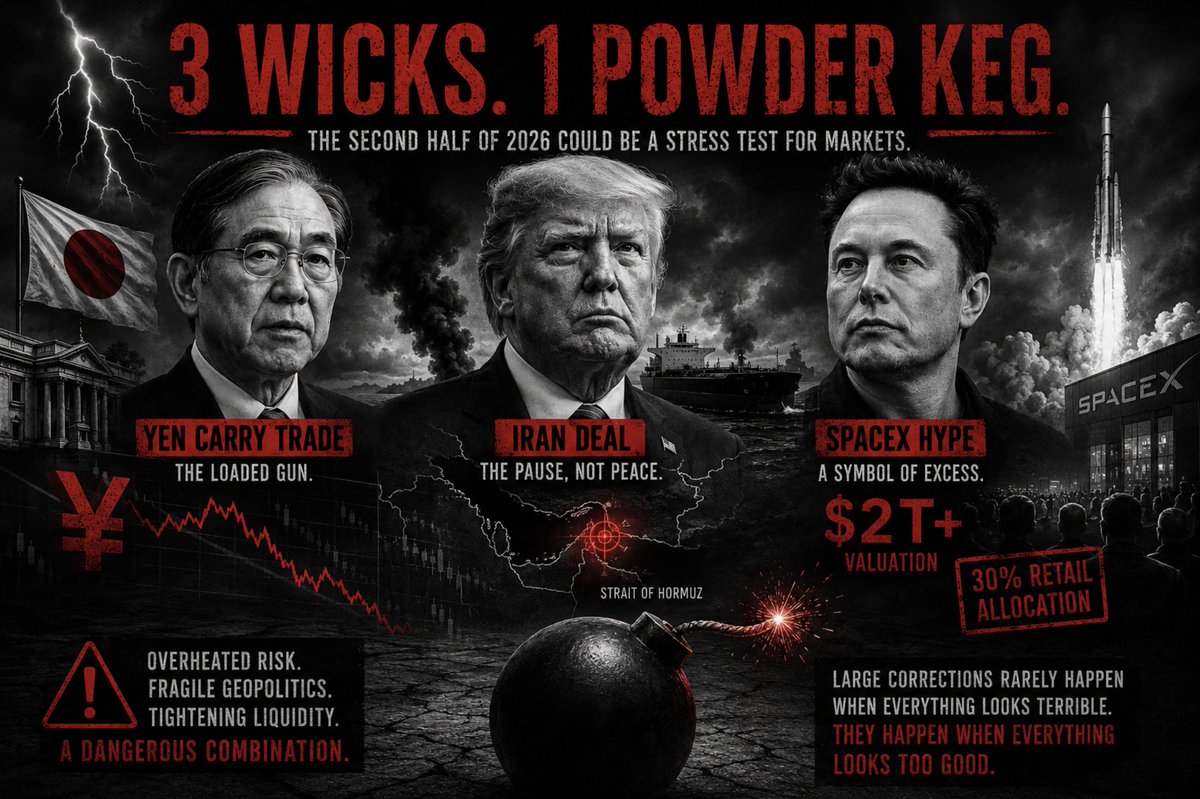
Why the Second Half of 2026 Could Be a Stress Test for Markets and Crypto
Markets are currently celebrating two major events at the same time — the US–Iran framework agreement and SpaceX's trillion-dollar debut. But beneath the surface of this optimism, three risks are building that have historically rhymed with major corrections. Let's break them down.
1️⃣ The Yen Carry Trade — A Loaded Gun on the Wall
On June 16, the BoJ raised rates to 1% — the highest level since 1995.
That may sound modest, but context matters.
Short positions on the yen remain near multi-year extremes, while the yield spread versus US Treasuries is still substantial (US 10Y ~4.4% vs. JGB ~2.6%).
As long as the spread remains wide, the carry trade survives and continues to support risk assets.
The problem is reflexivity.
Any sharp appreciation in the yen forces short sellers to cover positions, which pushes the yen even higher and creates a cascade effect.
We've already seen this before.
On August 5, 2024, a carry trade reversal sent BTC from $64K to $49K within 48 hours and dragged global equities lower along with it.
Today, the setup appears even more heavily loaded.
2️⃣ The Iran Deal — "Sell the News"
Yes, there is a framework agreement.
Yes, there is a signing ceremony in Switzerland.
Yes, the Strait of Hormuz remains open.
And yes, oil dropped more than $4.
Markets responded accordingly.
But the critical questions — uranium enrichment, ballistic missile programs, and long-term guarantees — have all been postponed until later.
This is not peace. It is a pause.
Historically, markets tend to price in the perfect scenario, while reality arrives in stages.
Any disruption to the signing process or a new incident involving the Strait of Hormuz could instantly reintroduce a geopolitical premium into oil prices — precisely when Japan is already struggling with energy-driven stagflation pressures.
3️⃣ SpaceX as a Symbol of Excess
June 12 marked the largest IPO in history.
A valuation above $2 trillion on day one.
Retail allocation reaching 30% — roughly three times the historical norm.
When the most aggressively valued listing of the decade is being absorbed by retail investors driven by hype, while companies such as OpenAI and Anthropic are also lining up behind it, that is not necessarily a signal of strength.
It is often a sign of a late-cycle environment.
That is what peak risk appetite tends to look like.
Not the beginning of it.
What Happens When You Combine Them?
An overheated risk environment (SpaceX).
Geopolitics resting on fragile assumptions (Iran).
And tightening liquidity from one of the largest sources of global leverage (Japan).
Each factor individually is manageable.
Together, they become more dangerous.
If the yen strengthens sharply at the same moment that enthusiasm surrounding the Iran deal begins to fade, we could find ourselves facing a classic market storm: forced deleveraging in an environment where very few participants are willing to catch a falling knife.
This is not a prediction of a crash.
It is a map of risks.
The largest corrections rarely happen when everything looks terrible.
They tend to happen when everything looks too good and too many people are sitting on the same side of the boat.
DYOR.
2
3
7
2,682
The price action is clearly showing that the data we are receiving on BTC is highly accurate. What you are seeing right now is an excellent reaction to the level that we identified earlier.
At this point, we are looking at the following situation:
There is still a CME gap around the $64,000 level, which is currently the most important area for understanding the asset's next major move.
In an ideal scenario, it would be beneficial to see another test of the $60,000 region, evaluate the market's reaction there, and then make further decisions based on that response—whether to fully commit capital to the market or continue waiting for a deeper correction.
At the moment, considering all of the economic factors I am watching, I am leaning more toward the view that we will see a deeper correction.
That correction could be triggered either by the yen, or by cooling investor enthusiasm as participants begin exiting the SpaceX IPO. A move like that could put pressure on broader markets, creating a chain reaction that spills over into cryptocurrencies and triggers the same type of move there as well.
Stablecoin dominance is at a significant level, and BTC is also already within a zone of potential reaction.
All of this is happening on a Monday, ahead of what could be called the deal of the quarter.
BUT there are a few important caveats.
For some reason, the deal still hasn't been signed. Every time, the signing gets delayed for an extended period. And who knows what could happen before the final signing date—a revolt, an accident, or something else entirely. The probability that it falls through is, overall, still quite high.
And it doesn't matter what explanation they come up with this time. The scenario will be triggered exactly when it is supposed to be triggered, and near the levels that are most advantageous for them.
The current level is important, but with uncertainty remaining through the end of the week, price could still be pushed higher toward the next major level.
If we look at volume, accumulated positions, and capitulation metrics, this is not the bottom yet.
But we're getting close.
1
2
5
2,144
Stablecoin dominance is at a significant level, and BTC is also already within a zone of potential reaction.
All of this is happening on a Monday, ahead of what could be called the deal of the quarter.
BUT there are a few important caveats.
For some reason, the deal still hasn't been signed. Every time, the signing gets delayed for an extended period. And who knows what could happen before the final signing date—a revolt, an accident, or something else entirely. The probability that it falls through is, overall, still quite high.
And it doesn't matter what explanation they come up with this time. The scenario will be triggered exactly when it is supposed to be triggered, and near the levels that are most advantageous for them.
The current level is important, but with uncertainty remaining through the end of the week, price could still be pushed higher toward the next major level.
If we look at volume, accumulated positions, and capitulation metrics, this is not the bottom yet.
But we're getting close.
2
2
6
2,588
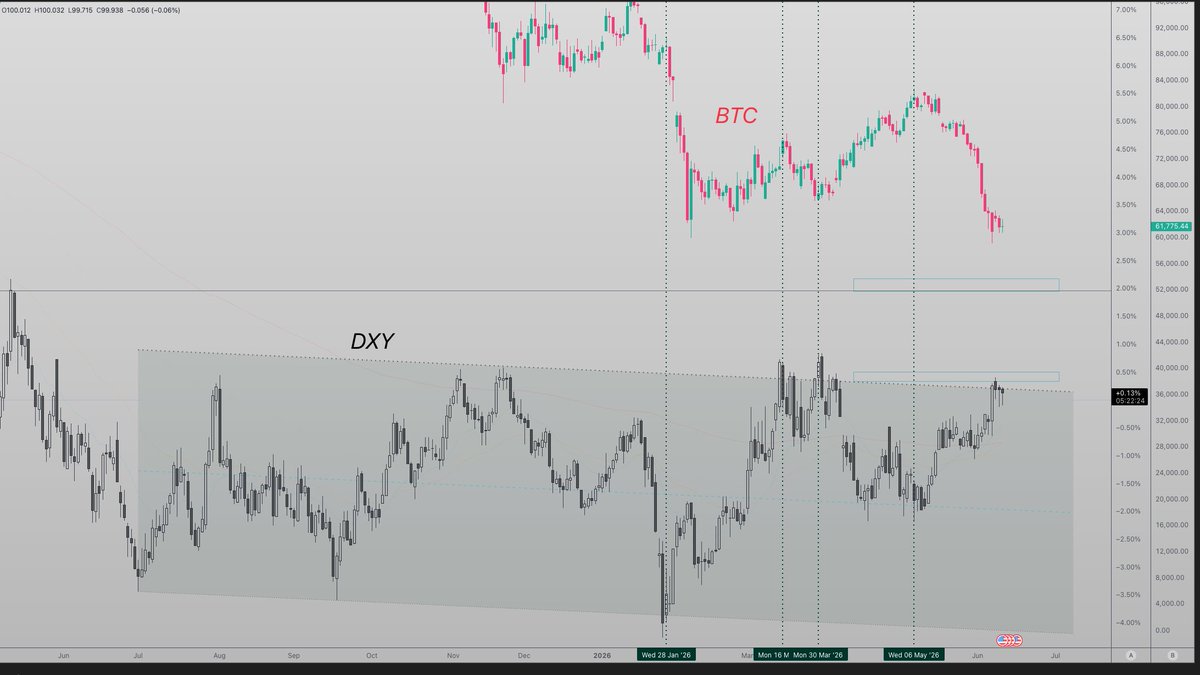
Why BTC Can't Grow Right Now, and What the DXY Has to Do With It
If you scroll through the major cryptocurrency charts right now, there isn't much you can see that clearly tells you what comes next. Will we get a reaction from current levels and a recovery, or is the decline going to continue?
And this is where DXY comes in and provides us with extra data.
Based on the DXY structure, we can clearly see that it has spent a long period trading inside a channel, and right now it is building what may be one of its strongest structures yet for a breakout to the upside.
Since bitcoin:native and DXY have historically shown a strong inverse correlation—which becomes quite obvious when comparing the charts—we can say one thing:
An escalation of the conflict involving Iran would likely accelerate the movement of capital into defensive assets. At the moment, those assets are the US dollar and bonds, which are offering attractive yields.
That would likely result in investors reducing exposure to risk assets even further.
And crypto is still a risk asset.
Based on all the pieces of the puzzle we currently have—CPI at 4.2%, record investment flows into IPOs, and many other factors—I see very little liquidity available for a strong crypto rally right now.
And if liquidity is not available to push the market higher, then it becomes much easier to push it lower, accumulate positions, fill the bags, and wait for the moment when that liquidity finally returns.
3
2
8
3,804
SpaceX Share Structure & Lock-Up Schedule
Total Shares: 13.08B
Class A (1 share = 1 vote): 7.38B
Class B (1 share = 10 votes): 5.70B
Shares sold in the IPO: 555.555.555
IPO price: $135
IPO proceeds: $75B
Trading Day 1 (June 12, 2026)
Tradable shares: 555,555,555
Circ. supply: 4.3%
Elon Musk Ownership
~6.2B shares:
~0.9B Class A shares
~5.3B Class B shares
~45% economic ownership
~85% of voting power
Investor Ownership
Non-Musk investors, employees, and insiders collectively hold approximately 6.3B shares.
Lock-Up Schedule
First Unlock - August 2026 (2 days after the Q2 2026 earnings)
20% unlock = 1.26B shares
Additional 10% unlock = 630M shares if SPCX trades at least 30% above the IPO price ($175.50 ) for 5 consecutive trading days
Linear Unlock Schedule
• Aug. 21, 2026 (Day 70): 7% = 441M shares
• Sept. 10, 2026 (Day 90): 7% = 441M
• Sep. 25, 2026 (Day 105): 7% = 441M
• Oct. 10, 2026 (Day 120): 7% = 441M
• Oct. 25, 2026 (Day 135): 7% = 441M
Q3 Unlock
Expected November 2026
~28% = 1.76B shares unlock (2 days after the Q3 earnings).
Final Lock-Up Expiration
Dec. 9, 2026 (Day 180): 7% or 17%
Elon Musk Lock-Up
June 13, 2027 (Day 366)
Elon Musk's shares become eligible for sale.
Any Class B shares sold by Musk automatically convert into Class A shares on a 1:1 basis.
Conclusio
#SpaceX begins trading with an ultrasmall free float of only 4.3%.
Only investors purchasing shares at the IPO have immediate liquidity.
If SPCX trades above $175.50 for 5 consecutive trading days, insiders gain access to an additional 10% of their holdings.
The first major supply event is expected in August 2026, when ~1.26B shares or 1.89B shares become eligible for sale.
3
4
6
5,037
🚨 A Massive Retail Dump Is Being Prepared
– Nearly $4 trillion in combined valuation from #SpaceX, #OpenAI, and Anthropic is expected to hit the public markets over the coming months.
– A total of $235 billion is planned to be raised between June and December 2026.
– Funds are already holding the lowest cash levels since the beginning of 2024. The only way to finance IPOs of this scale is by selling existing assets, which could trigger a broader market sell-off.
Financial risks:
– SpaceX: to trade at a more typical 20x sales multiple, the company would need to increase revenue from $18.67 billion to $87.5 billion.
– OpenAI: loses $1.22 for every $1 it earns and is reportedly going public without publicly audited financial statements.
– Anthropic: is reportedly preparing for an IPO at a $965 billion valuation while generating $4.8 billion in quarterly revenue.
2
7
13
5,806
SpaceX valuation…
2003 • 27M - Start
2010 • 1B - Falcon first flight
2016 • 10B
2026 • 1.75T - IPO
This is exactly the kind of IPO that will set multiple records — and potentially cost a lot of investors a lot of money.
There is no doubt that #SpaceX is one of the greatest companies of our time. However, the current level of hype surrounding this IPO and the widespread rush to gain exposure to it tells me one thing:
The market may be far more overheated than most people realize.
When everyone is talking about a once-in-a-generation opportunity and investors are willing to buy at almost any valuation just to participate, it is usually a sign that expectations have become detached from reality.
The company may continue to execute brilliantly, but that does not automatically mean the investment will be priced attractively.
The main thing to watch is whether this IPO becomes the first domino to fall. If expectations prove too optimistic and the market reacts poorly, it could expose broader weaknesses in risk assets and investor sentiment.
For now, the hype itself is one of the most interesting signals.
1
4
6
9,764
Saylor sold 32 BTC — the market dropped 20%.
Saylor bought $100 million worth of BTC — the market recovered 6%.
As I've been saying for a long time, stop listening to uninformed influencers.
It doesn't matter how much bitcoin:native Saylor buys or sells. What matters is the global macroeconomic environment and where liquidity is flowing.
What about the possibility of the largest IPO in history from #SpaceX? What about rising geopolitical tensions and increasing uncertainty in the oil market? What about investors rotating into defensive assets?
Crypto will begin its real bull market when the Federal Reserve turns the money printer back on.
Before that happens, the path may be painful. In fact, there's a high probability that the Fed keeps rates higher for longer, or even tightens further if inflation remains persistent.
Only after liquidity conditions improve will risk assets have the fuel for a sustained move higher.
The real question isn't whether Bitcoin will eventually go higher.
The real question is: how deep will prices go before that happens?
Stablecoin dominance is currently showing strong momentum. The next key area to watch is around 14%, which also aligns with the 38.2% Fibonacci level and previously acted as a major resistance zone.
At this stage, it would be interesting to see a retest of this area and potentially further upside. However, we'll assess the situation and incoming data once price approaches the zone before drawing any conclusions.
2
3
6
10,321
The Dollar Will Absorb Liquidity!
The DXY has been consolidating for a long time, and I expect the current or upcoming week to provide a logical breakout toward the 102 level. Such a move would likely pull liquidity from other markets, creating pressure across risk assets.
In my view, this could happen against the backdrop of escalating tensions involving Iran. No matter how much Trump may want to secure another deal that primarily benefits the United States, I don't believe Iran will accept the terms currently being offered.
That said, from a longer-term perspective, I still expect the DXY to eventually move down toward the 80–85 range. In my opinion, the U.S. economy remains in a weak position structurally, and the probability of higher interest rates becoming the baseline scenario is increasing. The Federal Reserve is generally more willing to tolerate elevated inflation than a deep recession, which will continue to shape monetary policy decisions going forward.
This is my personal market view and should not be considered financial advice.
1
1
3
984
🚨 One of the biggest multi-market crashes of the year
– Over $2.5 trillion wiped off the stock, metals and cryptocurrency markets in a single trading session.
– An absolute collapse that spanned multiple asset classes.
Now zoom out, and look how the entire cryptocurrency market's volume has vanished in just one session... This market is still so young, it's set to reach unprecedented heights. Just wait, buy, and forget about it for 5 years, and it will be the best decision you've ever made.

2
591
You're wrong about Bitcoin, and Michael Saylor has nothing to do with it!
It's not your fault that you're following influencers who make money from referral links. If they're really that good, then why doesn't a single one of them have their own fund? Something to think about, isn't it?
So what does bitcoin:native have to do with it?
Take a close look at this chart. Are you seriously trying to tell me that after the approval of ETFs—which allowed billions of quantitative dollars to enter the market—we're going to put in a bottom with only 2.58 million in volume? While the previous bottom, when quantitative funds weren't even involved, had 69.23 million in traded volume?
Wake up!
Quantitative funds operate using established frameworks layered on top of human psychology, and we've done the same thing hundreds of times. People simply don't see it because they're too busy watching the theater of events being played out around the world.
What is absolutely certain is that we are already in the final phase, but this is probably far from the bottom.
It could become the bottom if price starts ranging here and volume suddenly begins to rise sharply.
Because to move this train, you have to stoke the furnace to maximum capacity.
I don't use RSI or any other indicator in my analysis, but maybe most of you will at least be able to spot the pattern this way and see the behavior in the data, which shows an excellent correlation with the previous cycle.
But there is one difference: this cycle is running about a month behind the previous one, which makes sense. There are more large players now, and the scenarios need to be more complex in order to make them question their positions.
The only question is whether price accelerates and reaches its bottom faster than the previous cycle in terms of days while still aligning with the same overall timing, or whether the entire cycle shifts by one month.
We'll find that out later.
For now, the best thing you can do is divide your position size into multiple parts and begin accumulating gradually. That way, your average entry price will likely be better than that of those trying to catch the exact bottom.
Help me get this message out to everyone! Save it to your bookmarks and share it with others.
Good luck with your trading!

4
30
19
6,221
If we look at the Ethereum ethereum:native chart on higher timeframes, we can see that price is forming a compression pattern beneath the upper boundary of the channel. From a broader perspective, this correction is the final piece of that formation.
We may move toward the lower boundary from here, but that move would likely be a fast one, allowing large players to build the massive positions they intend to hold for the long term.
No matter how hard people try to scare you with narratives about a collapse in the cryptocurrency market, no matter what happens from here, and no matter how many Bitcoins Saylor sells, the major assets that are currently traded through ETFs—and those that will eventually be traded through ETFs—are likely to be significantly higher once large institutions complete the construction of their positions.
Your job as a trader is not to catch the exact bottom. Your job is to recognize when a particular phase of the market has completed its purpose and then position yourself for the longer-term opportunity.
Most short-term traders using excessive leverage will be forced out of the market.
What may lie ahead is the most painful dump before the strongest advance in major cryptocurrencies, because this cycle may be the last one in which speculative and low-quality projects receive the same level of attention and capital.

2
11
17
5,149
⚠️Important news! My fund bought the 32 bitcoin:native that Saylor sold.
It's now or never.
Let's make the bull market great again!
PS. Thank you for your attention to this matter!


1
2
11
553