
Afro-Carolinian Archivist of Black Culture 🖤📁 #FreePalestine #FreeSudan
Joined July 2010
- Tweets 80,346
- Following 2,184
- Followers 2,191
- Likes 39,072
1,628 Photos and videos


Pinned Tweet

6 Aug 2021
I accidentally signed my email “Bet,”instead of “Best,” and now the tone of this email is combative 😪😪😪
71
1,372
17,874
zakiya 🇵🇸 🇸🇩 🇨🇩 retweeted

24 Feb 2025
*Linking Lost Jazz Shrines, a linked open data project documenting Central Brooklyn’s cultural legacy of jazz, directed by Zakiya Collier and Sarah Ann Adams, and reviewed by Kesla Elmore reviewsindh.pubpub.org/pub/l… #ReviewsInDH @ZZcollier @_sarahannadams @semlabteam
1
2
1
115
zakiya 🇵🇸 🇸🇩 🇨🇩 retweeted

16 Dec 2024
We are now accepting applications for our WARC School (Web Archiving School) Fellows, Instructors and Teaching Assistants- Deadline 1/31/2025: archivingtheblackweb.org/war…
#atbw #webarchiving
3
3
283
7 Jan 2025
We're still accepting applications for fellows, instructors and TA's! Join us at WARC school! Applications close Jan 31st!
17 Dec 2024

WARC School is a paid ($5K) year-long online training program in web archiving, beginning with a grounding in-person orientation, workshops, knowledge and skill building activities.
Follow the link for more details on participation archivingtheblackweb.org/war…
1
182
zakiya 🇵🇸 🇸🇩 🇨🇩 retweeted

In the digital world, there’s nothing more disheartening than losing access to a website you’ve poured time and effort into building. ✨👉OPEN CALL: Resilience grant. Get your website back, reclaim your history 👈✨ Apply until Jan 13th here: sutty.nl/en/recovery-form/


2
8
8
989
17 Dec 2024
UnitedHealthcare just approved my prior authorization request in less than an hour. It usually takes weeks if not months.
They shook!! Lemme gon put some money on Luigi books!
3
108
zakiya 🇵🇸 🇸🇩 🇨🇩 retweeted

16 Dec 2024
PMC COVID-19 Dashboard, Dec 16, 2024
🧵1 of 8
🔹1 in 64 (1.6%) actively infectious in the U.S.
🔹750,000 new daily infections and rising
🔹Highest % increase in transmission in nearly 3 years
🔹10th wave is the "silent surge," coming on late out of nowhere
The video will walk you through each of the graphs on the dashboard and covered in this thread.
Info for new readers:
For those unfamiliar with the PMC model, find full weekly reports for the past 14 months at pmc19.com/data
The models combine data from IHME, Biobot, and CDC to use wastewater to estimate case levels (r = .93 to .96) and forecast levels the next month based on typical levels for that date and recent patterns of changes in transmission the past 4 weeks.
Our work has been cited in top scientific journals and media outlets, which are fully sourced in a detailed technical appendix at pmc19.com/data/PMC_COVID_For…
Examples include JAMA Onc, JAMA-NO, BMC Public Health, Time, People, TODAY, the Washington Post, the Institute for New Economic Thinking, Salon, Forbes, the New Republic, Fox, CBS, and NBC. See pgs 11-13 at the above link.
We will have a pre-print out in the next month documenting very compelling evidence for the validity of using wastewater to estimate case rates. Forecasting is challenging in the context of the current viral evolution, but the real-time estimates of cases are impressively accurate to the best we can evaluate it.
47
477
1,124
95,151
zakiya 🇵🇸 🇸🇩 🇨🇩 retweeted

14 Dec 2024
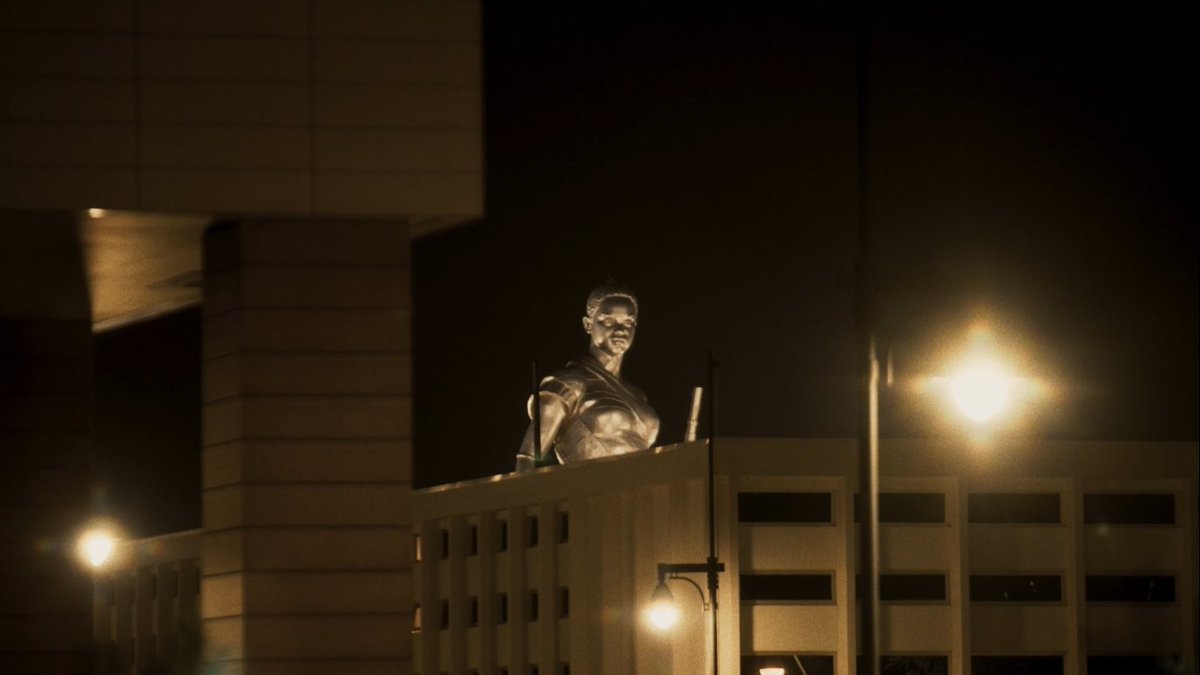
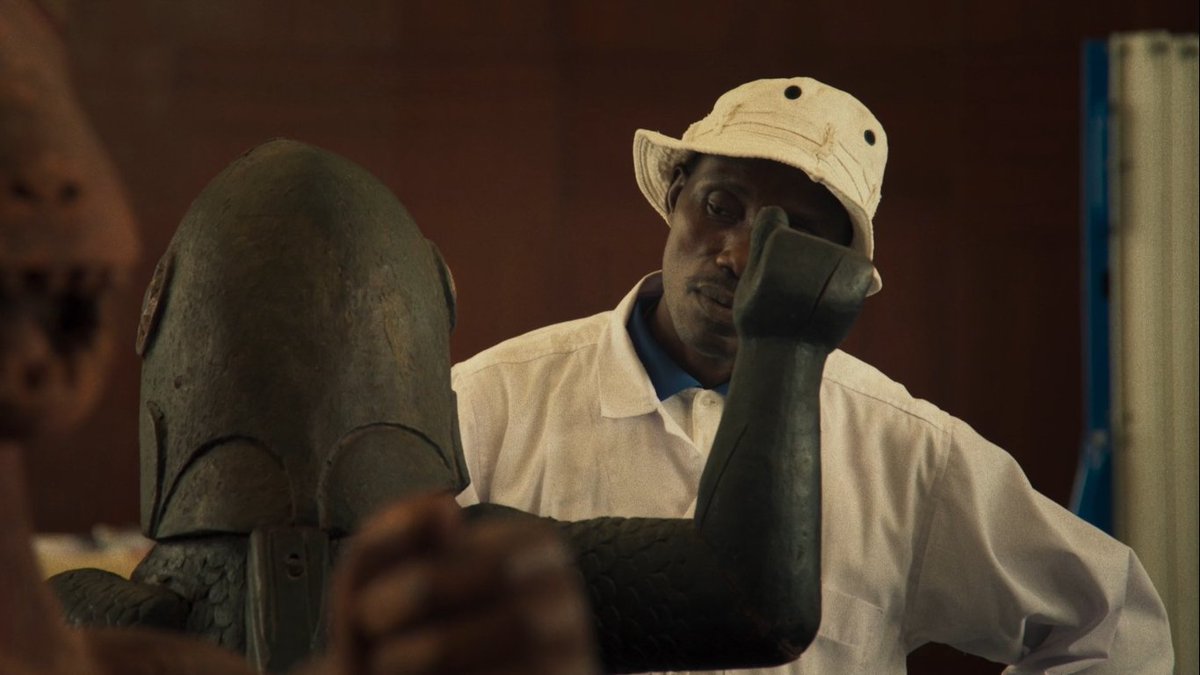
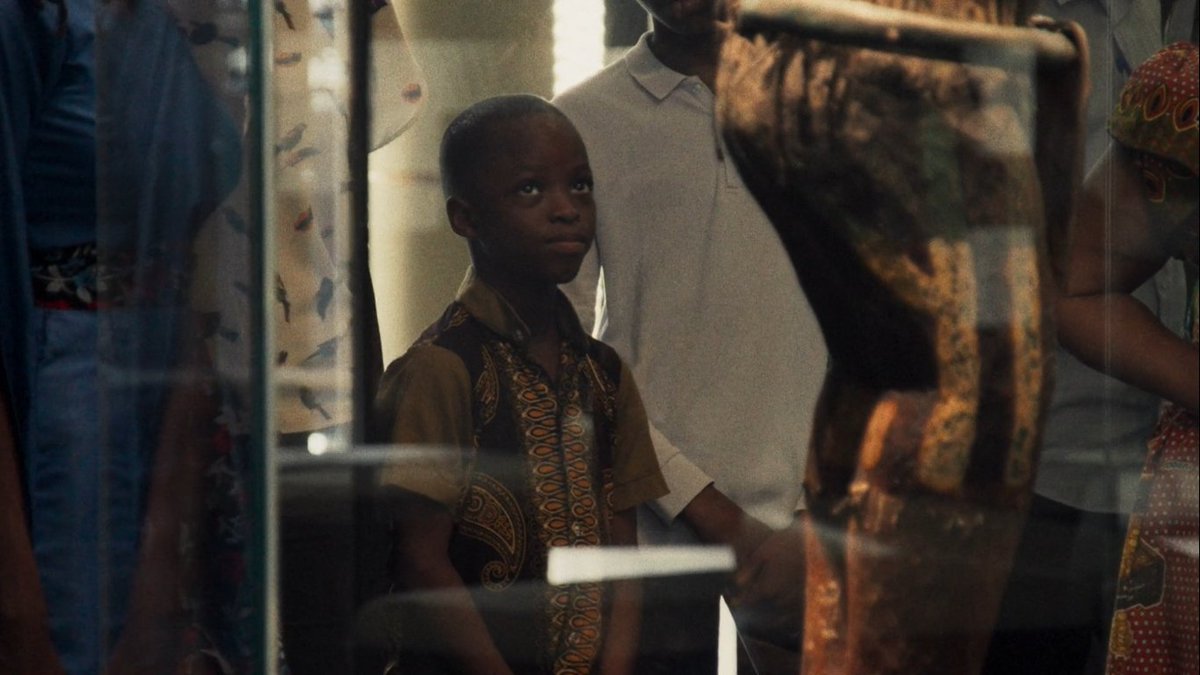
Archive Africa has partnered with Mubi to stream Dahomey for free for 30 days only.


9
842
4,027
286,768
zakiya 🇵🇸 🇸🇩 🇨🇩 retweeted

1 Dec 2024

ALT Graphic reads I wear an n95 more than I wear a bra and it's more comfortable too.
23
309
2,171
44,873
22 Nov 2024
Listen!! “EVERYBODY OUT THE MUTHAFUCKIN DRESSING ROOM, PLEASE!’”
21 Nov 2024

The cameras would’ve been CUT
2
166
7 Nov 2024
Hello!
6 Nov 2024

I’ve seen dead people on my timeline everyday for over a year and last night is what was supposed to bring me to tears?
4
247
7 Nov 2024
I can’t say that I do.
6 Nov 2024

Every Black woman in America empathizes with Kamala right now.
Overwhelming qualified. Still doubted.
1
102
zakiya 🇵🇸 🇸🇩 🇨🇩 retweeted

6 Nov 2024
No we do not.
6 Nov 2024
Every Black woman in America empathizes with Kamala right now.
Overwhelming qualified. Still doubted.
181
1,741
19,103
503,588
7 Nov 2024
Nigga what??
7 Nov 2024

Black federal employees in the DMV who work for agencies that may be on the chopping block, I hate to say this but you all should look to agencies like ICE or CBP for work. You all have families to feed and that should be the most important thing…
1
277
zakiya 🇵🇸 🇸🇩 🇨🇩 retweeted

When I say “hey sucka man” this the voice I’m always channeling 😭😭😂

Throwback to Katt Williams stealing the show in one of the classic My Wife And Kids episodes😂
4
2
566
zakiya 🇵🇸 🇸🇩 🇨🇩 retweeted

24 Jul 2024
Touch and agree.
23 Jul 2024

Hoping VP Kamala Harris skips the Breakfast Club on her media tour.
In Jesus' name.
11
24
184
5,520
zakiya 🇵🇸 🇸🇩 🇨🇩 retweeted

23 Jul 2024
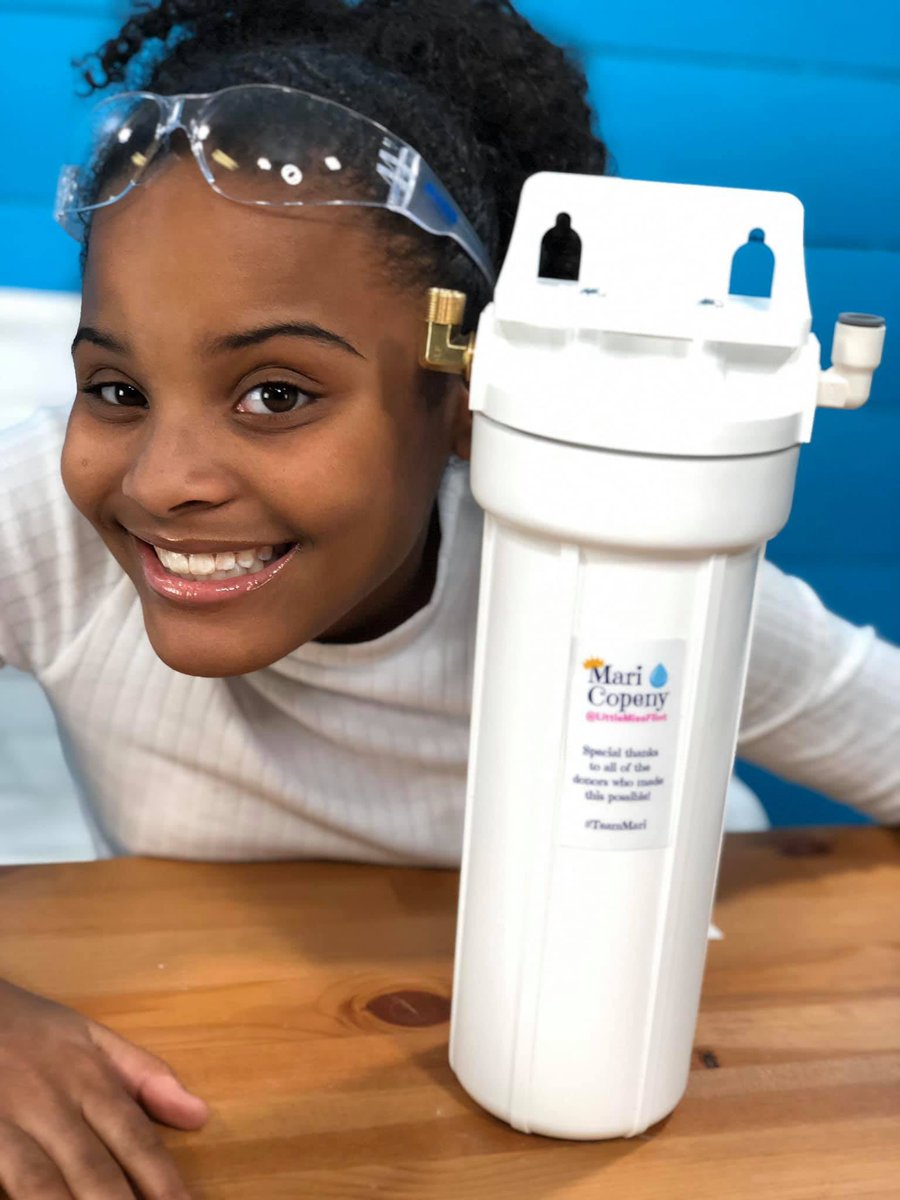
She's been trying to get clean water for the people of Flint since she was 12.
Please stop giving money to political campaigns. Start giving directly to the people in need and the people working to meet those needs.
6 Jul 2024

It’s my 17th birthday!!!
My wish is to raise $17k on my filter fund that I started when I was 12.
To hit that goal I need to raise around $7k
gofund.me/016e1bc5
You can also donate via cash app $LittleMissFlint
paypal.me/LittleMissFlint810
(Just note its for filters)
20
19,434
37,233
762,860