
The most powerful and intuitive #datavisualisation technology for Microsoft's #PowerBI, #Excel, and #PowerPoint!
Joined January 2014
- Tweets 4,176
- Following 850
- Followers 5,357
- Likes 2,623
1,971 Photos and videos


Open any Power BI report. Start a timer.
→ 3 seconds: did the headline land?
→ 30 seconds: do you know what's driving it?
→ 300 seconds: can you act on it?
If the answer is no at any stage, the report has a structure problem, not a data problem.
That's the 3-30-300 rule. A quick test for whether a report works as a decision tool, or just a wall of charts people scroll past.
In a well-structured report:
→ 3s → clear KPIs with variance vs plan or last year. The story at a glance.
→ 30s → the drivers. What's moving the number, and where?
→ 300s → structured drill-downs. Enough depth to decide the next move.
That's why we built Zebra BI templates around this exact structure. Sales, finance, HR, and more. Variance built in, drill-downs ready, IBCS visuals out of the box.
The templates are free to download: bit.ly/4uHvzRs
The point isn't prettier reports. It's reports your CFO reads.
#PowerBITemplates #PowerBI #IBCS #ZebraBI
2
125
Operational reports that color every variance equally make it harder to spot what actually needs attention.
Tracking Days Inventory Outstanding (DIO) month-to-month is a good example. The problem?
A 1-day fluctuation looks the same as a 10-day swing. With Zebra BI Charts, you can now use neutral variance color to set a tolerance in days, not just percentages.
For example, in a DIO trend chart teams can set a ±2 day tolerance band. Routine adjustments go quiet.
The months where inventory genuinely moved materially are immediately visible. The result?
Attention shifts only to where it's really needed. And the best part: no additional DAX or extra measures. Configured directly on the visual.
Stop treating a 1-day slip the same as a 10-day problem.
#ZebraBI #PowerBI #BusinessIntelligence
76
TÜV NORD GROUP scaled finance reporting from 10 to 500 users after solving the one thing Power BI couldn't do: render a clean income statement.
"With native Power BI visuals, you have no chance of getting a nice income statement." — Stefan Mahler, Group Controller, 24 years in the role.
Before Zebra BI, monthly reporting ran out of Excel. Large tables, complex joins, PDFs by email. Every business unit walked into the room with a slightly different version of the truth.
Power BI consolidated the data. Zebra BI made it legible:
🌟 Variance columns,
🌟 IBCS-structured statements,
🌟The format finance leaders already think in.
300 to 400 people are now in those dashboards every month. C-suite executives engage with live numbers instead of arguing about whose spreadsheet is right.
The shift isn't from Excel to Power BI. It's from reconciling data to discussing the business.
🔎 Read their success story here: bit.ly/4uJdJNT
#CustomerWins #ZebraBI #FinancialReporting #PowerBI
94
Why build the same #PowerBI dashboard from scratch when somebody else already solved it?
50 free Zebra BI templates, ready to drop into your report:
→ P&L and Income Statement
→ Variance analysis and budget vs actual
→ Sales pipeline and funnel
→ Executive KPI cockpit
→ Operational and HR dashboards
Each one comes IBCS-formatted by default, with variance columns, proper hierarchies, and the design choices already made. Open it, point at your data, ship.
Upgrade your reports with one click → bit.ly/4ahOTwf
#ZebraBI #BusinessIntelligence #PowerBITemplates
1
5
126
What does reporting look like when it just works?
For @Helvetia Switzerland, it stopped looking like report-building at all.
"Now it's instant: there's no time required for building reports anymore. Everything updates automatically, so users just open the dashboard and it's there." — Lari Hrabar, Head of Performance Management, Helvetia Switzerland
That's the shift Finance teams talk about once they've moved past the formatting sprint and into actual analysis.
One report structure, every cost center owner sees what's relevant to them, leadership sees the full picture, no rebuilds at month-end.
Read their success story here: bit.ly/49wxMXo
Try Zebra BI for free: bit.ly/4u39VG6
#CustomerWins #PowerBI #ZebraBI #Finance #IBCS
1
1
87
Our June 4 webinar:
Filter to Novo Nordisk. AI writes the P&L narrative. Seconds.
Filter to Pfizer. Different story. Same seconds.
Live analysis. 100 real companies. Join us!
Free 👉 bit.ly/49RuA8I
#PowerBI #ZebraBI #Webinar #DataAnalytics
ALT Zebra BI Webinar
115
You want to see the full variance picture and quickly spot what matters most.
When all variances carry the same visual weight, relevance is harder to judge.
New in Zebra BI Tables and Charts: Conditional Variance with Neutral Color.
You define a tolerance band on any variance column.
All values remain visible.
Larger deviations naturally stand out.
How teams use it:
• Revenue vs. plan
±5% directional band to highlight material wins and misses.
• Inventory changes
1 to 3% symmetrical band to surface the largest movements, whether overstock or shortage.
No DAX.
No extra measures.
Configured directly on the visual.
Update Zebra BI and apply it in your next month‑end report.
#PowerBI #FPandA #ZebraBI
122
Abbott's finance team used to spend days formatting reports that still didn't drive decisions.
Ivana Meier, Senior Financial Analyst, changed that with a gradual rollout of Zebra BI across teams and leadership. The goal wasn't prettier charts. It was a shared reporting language that everyone could act on.
✨Now reports are executive-ready without the formatting struggle.
✨Plan vs. actual views are clear at a glance.
✨Teams comment and align inside the report itself instead of chasing answers over email.
✨And from local teams to global HQ, everyone is looking at the same thing.
Less time on formatting. More time on the decisions that actually move the business.
Try it for free: bit.ly/4dgg9fu
#ZebraBI #PowerBI #FinancialReporting #FPandA #DataVisualization
1
155
📖 Read the full case study: zebrabi.com/customer_stories…
83
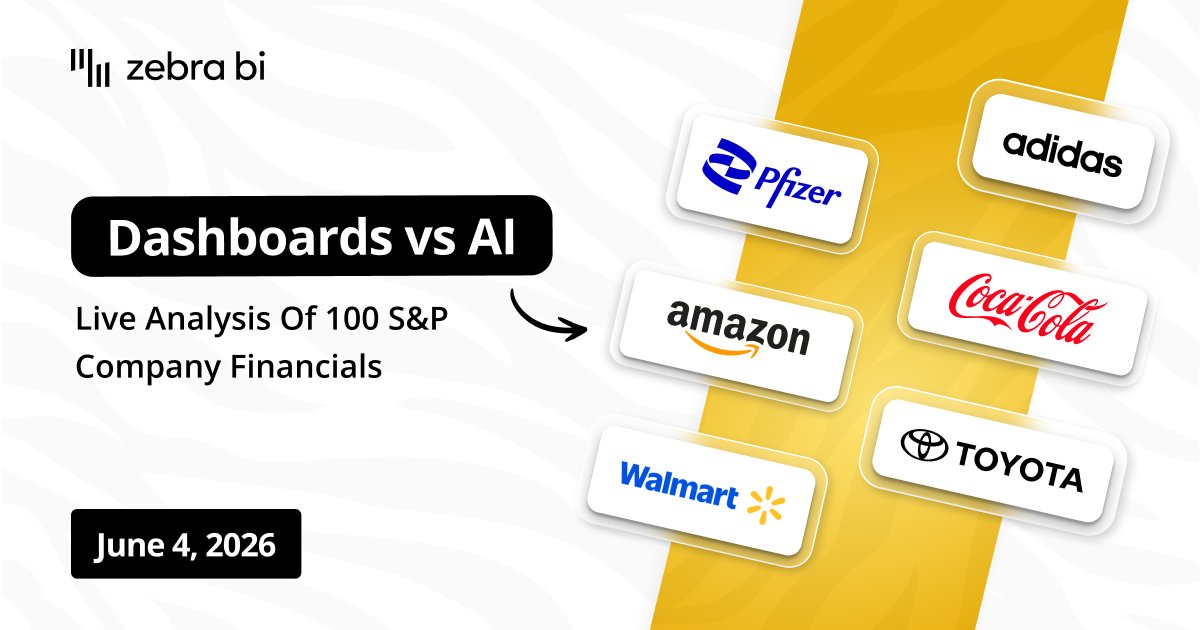
What's in the June 4 dataset:
100 companies. 6 industries.
Nike vs Adidas. Tesla vs Toyota.
Pfizer vs Eli Lilly. Walmart vs Amazon.
6 years. 18 KPIs. All public data. All in one report.
Running it live on June 4.
Free 👉 bit.ly/4eJ32Wu
#ZebraBI #PowerBI #Webinar #DataAnalytics
ALT Zebra BI Webinar
1
3
199
Most BI failures don't happen in the data layer.
They happen in the four steps after the dashboard goes live.
Our Head of BI, Tine, calls this the Last Mile framework. Four places where the pipeline from insight to decision can break:
1️⃣ Decision design
Build the report around how decisions actually get made, not around what data you have.
Who decides? On what signal? What's the threshold that triggers action?
If you don't know, your report will answer the wrong question.
2️⃣ Insights and drivers
A variance without context is just a number.
The report needs to show what changed AND why, before anyone has to ask.
3️⃣ Decision framing
Every insight should point to one of four responses: act, adjust, monitor, or escalate.
If the report doesn't frame the decision, the meeting will.
And the meeting will run out of time.
4️⃣ Execution ownership
A decision without an owner is a conversation.
Someone needs to leave the room with their name on it, and a deadline.
Most orgs have the data to do all four.
Very few have reports built to support all four.
Which step is the weakest in your organization right now?
Full breakdown → bit.ly/4uiWUZm
#ZebraBI #BusinessIntelligence #LastMileAnalytics #PowerBI
1
114
When every patient counts, faster insights aren't just good reporting. They're the point.
Robert Anschütz, Business Excellence Lead at Ipsen and his team, built a single decision layer across the entire company.
Sales, marketing, leadership, every function from intern to C-suite now reads the same data in the same language.
Before, Robert would walk into a marketing meeting and see one dashboard. A leadership meeting, another. Six thousand people, all telling a slightly different story.
Now there's one story. And everyone can read it.
This is what the business intelligence looks like in practice.
👉 Try it yourself for free: bit.ly/4cZHbsw
Robert explains how he solved it for Ipsen in a chat with us, link in comments 👇
#ZebraBI #PowerBI #CustomerWins #BusinessIntelligence
1
131
Most finance teams report in a vacuum. No benchmark. No context. Just their own numbers.
We loaded 100 global companies into one Power BI report and we're running it live on June 4. 📊
Nike. Tesla. Pfizer. Walmart. All in the same report.
Free to join 👇
bit.ly/4uK2UKT
1
1
140
One BI team. 6.5 million customers' worth of data. And a steady stream of small dashboard requests from every department.
That was KPN before they rebuilt the model with Zebra BI.
✅ Business users now build and adjust their own dashboards
✅ IBCS standards keep every report consistent
✅ Interactive board chambers replaced static slides
✅ The BI team is back to strategic work, not formatting requests
A faster, more data-driven KPN. And a self-service model that other enterprises are getting inspiration from.
Read the full story 👉 bit.ly/48u5qwi
#CustomerWins #ZebraBI #BusinessIntelligence
1
168
What actually turns data into a decision?
Today, we are at the 50th Congress of Controllers, the conversations will span AI in practice, early crisis detection, and controlling as a true performance driver.
But they all circle back to one core challenge: bridging the gap between insight and action.
📍 Meet Zebra BI in Munich, 27–28 April | The Westin Grand
At our booth, we’ll be talking about the last mile of analytics, where data becomes actionable for leaders.
👋 Who you’ll meet:
✨Dilyana Penchovska, VP of Growth, Zebra AI: Showing what Zebra AI‑generated narratives inside Microsoft Fabric look like in the real world
✨Oliver Dreier, Senior Partner Manager: Practical conversations on partner‑led BI workflows
✨Andreas Roehl, Director of Enterprise Accounts: Connecting enterprise strategy with finance reality
If you’re wrestling with reporting, performance, or decision‑making at scale, stop by.
See you in Munich.
#ZebraBI #ZebraAI #BusinessIntelligence #FinancialReporting
1
97
Your Power BI dashboards tell you what happened.
They don't tell you what to do about it.
That gap is worth $2M to $20M a year, depending on company size.
Tonight, 6 pm CET, we show you how to close it. Live rebuild, real companies, real numbers.
Sign up here: bit.ly/4tr4oJL
#ZebraBI #PowerBI #Webinar
ALT Zebra BI
92
Most reporting meetings aren't decision meetings. They're number audits with a conference room.
Run this quick check:
- Do you spend more than 50% of the meeting debating whether the numbers are correct?
- Do decisions get made without an assigned owner?
- Do your reports lack variance analysis and driver decomposition?
- Are action items tracked anywhere after the meeting ends?
- Are your reports standardized across teams and regions?
2 or more? The last mile is broken.
Not because your data is bad. Because the report was never designed to drive a decision.
What does a good decision meeting actually look like to you? Tell us in comments below. 👇
#ZebraBI #BusinessIntelligence #PowerBI
ALT Last Mile Checklist Zebra BI
1
2
107
What does a report that drives a decision actually look like?
Come see it built live this April 15th at our monthly Zebra BI Zebra AI demo.
Bring your hardest question. 45 minutes. Free.
Save your spot: bit.ly/4udQE6g
#ZebraBI #LastMileAnalytics #PowerBI #LiveDemo

110
Your dashboards are missing the one thing executives actually want.
We asked. They told us.
Comments are the single most important thing they miss in their dashboards.
Not more charts.
Not fancier visuals.
Not AI-generated insights.
Just simple, to-the-point explanations of WHY the numbers look the way they do.
Yet 30% of dashboards have zero comments.
The gap between what leaders need and what analysts deliver is massive.
Close it.
→ We show you three different ways of doing this here: bit.ly/3Pmhfhm
#ZebraBI #PowerBI #BusinessIntelligence
2
89