
A powerful #JavaScript charting library. Tweet at us for help with your #charts!
Joined December 2009
- Tweets 6,680
- Following 745
- Followers 2,506
- Likes 7,426
608 Photos and videos


Pinned Tweet

1 Jun 2021
We're kicking this twitter into high gear, just in time for summer! We've been hard at work upgrading our products and can't wait to show them off to you. Demos incoming. Check us out for awesome charts and grids!
#dataviz #Analytics #charts #chart
18 Apr 2020

This #JavaScript chart may be overkill, but it does a good job of showing off many of the features that make ZingChart useful for web devs and their end users 🤓 Explore the details of this interactive #JS chart in our gallery 🖼 buff.ly/2Tm51ob
#dataviz #analytics
19 Oct 2022
🚀New ZingChart Release🚀
ZingChart v2.9.10 is here! New features available such as a new map, hoverEffect attribute, math operations support and several key bug fixes! Check out our changelogs for all the details!🙌 #dataviz #webdev #SaaS #javascript
zingchart.com/docs/change-lo…
ALT New ZingChart Version 2.9.10!! Check out our changelogs for all the new features and fixes!!
1
13 Oct 2022
🤫How to Hide Context Menu Options🤫
In this blog post, we teach you how to hide the "View Data Table" option from the context menu as an example. Just a small piece of extensibility with ZingChart! 👊 #dataviz #javascript #webdevelopment #Tutorials
blog.zingsoft.com/how-to-hid…
2
13 Oct 2022
✨New Tutorials✨
In this article we'll see how to get started with ZingChart and Svelte and look at tapping into some ZingChart features from within a Svelte app. We've written a wrapper to provide easy access!🙌 #dataviz #svelte #programming #Developer
blog.zingsoft.com/using-zing…
12 Oct 2022
✨New Tutorials✨
ZingChart can be used in any web application, with or without a framework. Check out our new detailed article about using ZingChart with React 17! #dataviz #javascript #ReactJS #webdevelopment
blog.zingsoft.com/using-zing…
1
7 Oct 2022
👉New ZingChart Tutorial👈
Check out our new post below about how to extend your `zingchart-angular` wrapper Type Definition File to include your own properties on the chart configuration object.🙌#dataviz #webdevelopment #Analytics #DataScience #bigdata
blog.zingsoft.com/zingchart-…
1
3 Jun 2021
This family tree demo we did for Game of Thrones was fun. Check out our #NetworkDiagram to make your own family tree!
#ZingChart #dataviz #ZingGrid #chartoftheday #webdevelopment #datavisualization #chart #charts
1 May 2020
Winter may be over for #GameOfThrones, but the story lives on! This family tree can be easily broken down with a #NetworkDiagram.
Checkout this demo ➡️ buff.ly/2uiHWdk
#ZingChart #dataviz #ZingGrid #chartoftheday #webdev #datavisualization #chart
11 May 2020
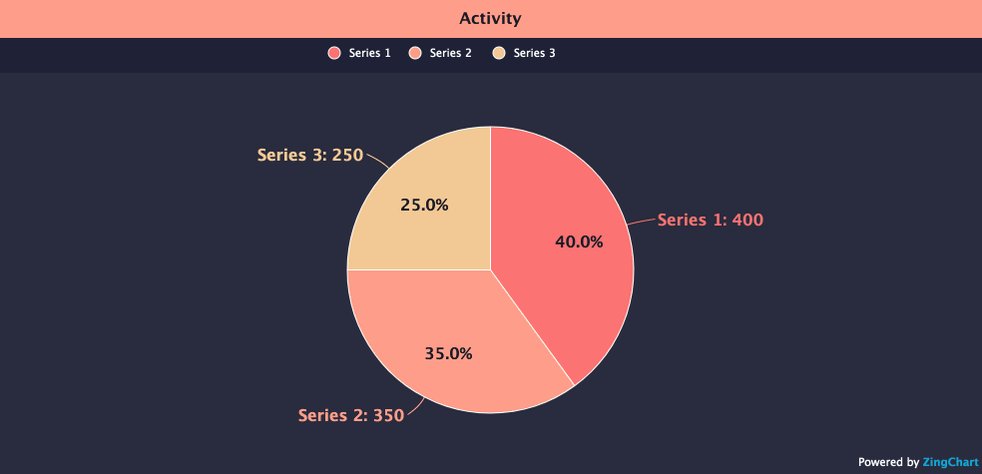
Ever wish your pie #charts had a little more info to clarify your data? ZingChart has you covered with features like legends, labels, tooltips, and more! Curious to see what those features look like in action?
View demo 👉🏽 buff.ly/32zb11l
#JavaScript #dataviz
1
9 May 2020
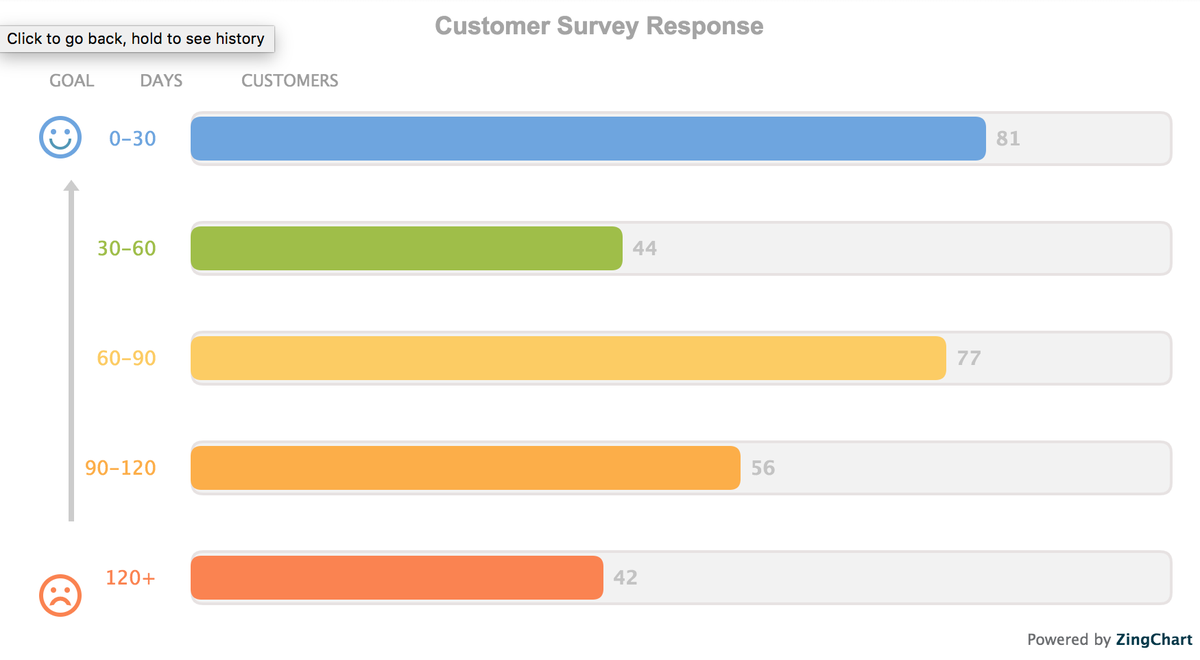
In this horizontal #barchart, we use a simple combination of color and icons to add another level of information to this data.
View the live demo in our gallery 👉🏽 buff.ly/2HYP9D1
#dataviz #charts #chartoftheday #javascript #typescript #webdev #datavisualization
1
1
8 May 2020
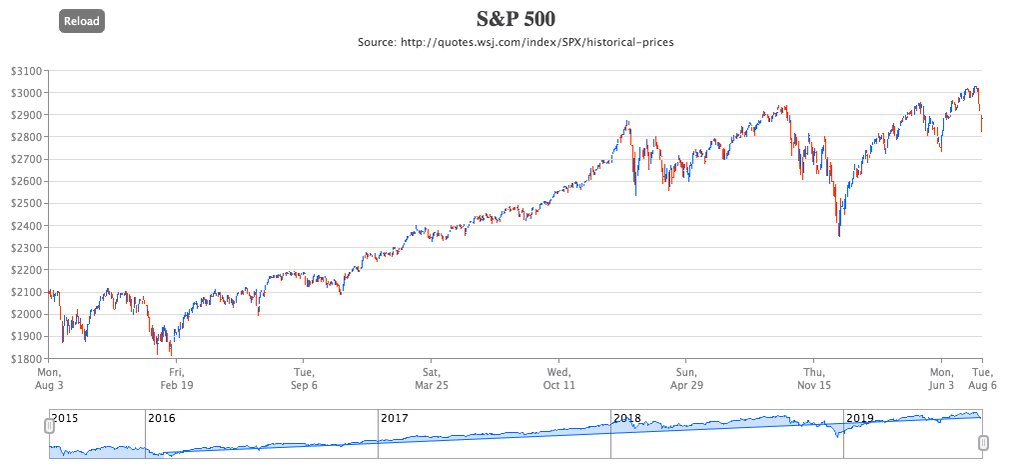
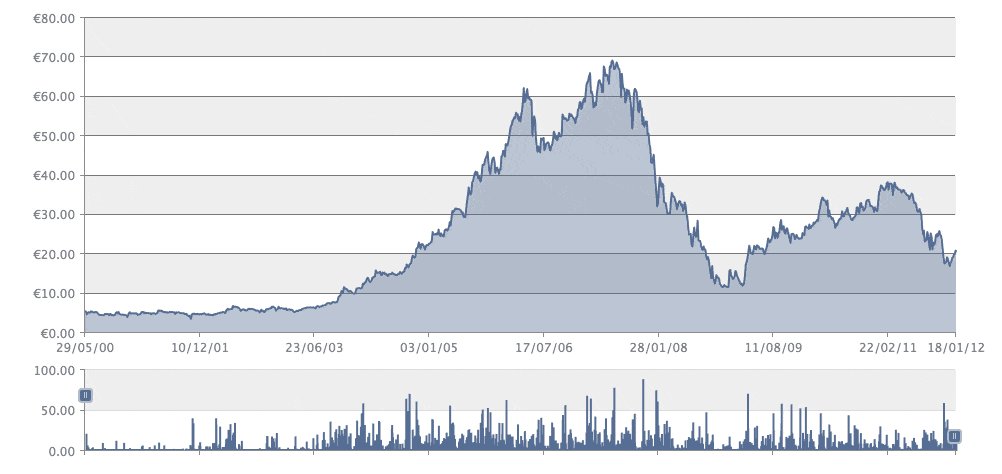
We added #chart preview, zooming, crosshair & tooltip functionality to this #OHLC #infographic to make it easier to explore 4 years worth of S&P 500 financial stock #data 📉
View the live demo 💻 buff.ly/398BODQ
#chartoftheday #dataviz #javascript #webdev #typescript
1
1
7 May 2020
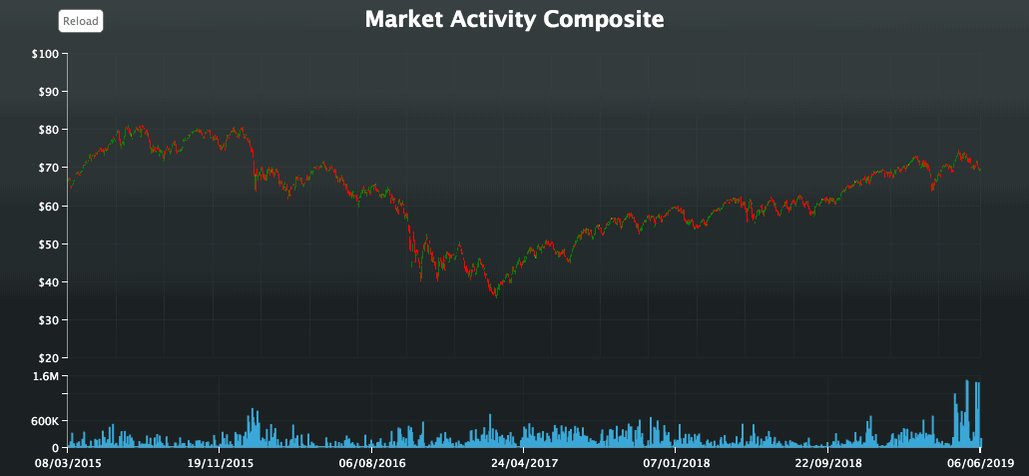
Combine bar & stock #chart types 📊📈 to visualize composited financial market activity in one place using ZingChart's mixed charts feature 👋🏽
View the live demo ➡️ buff.ly/2PtmaLO
#chartoftheday #dataviz #javascript #finance #infographic
2
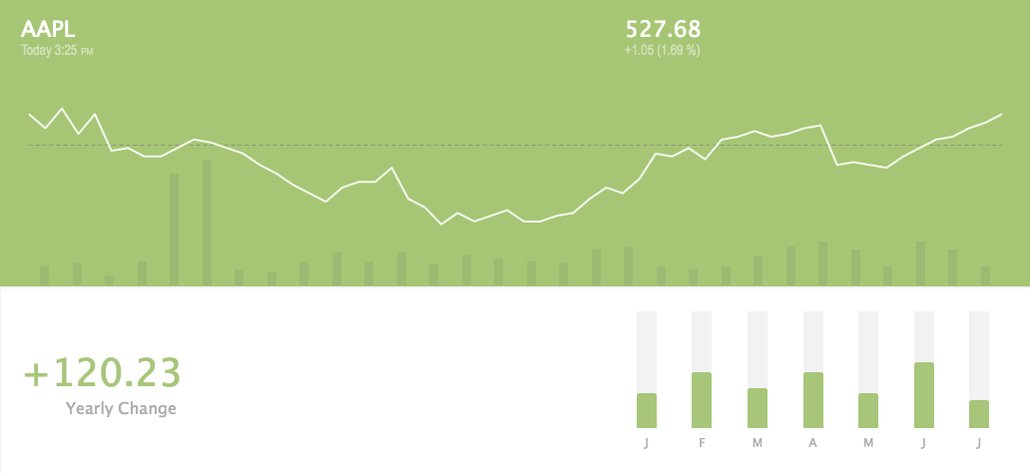
6 May 2020
Need more interactivity out of your #JS #charts? Check out how we used ZingChart's custom tokens to visualize #finance #data in this zoomable #stock chart 🔎
View the live demo 👉 buff.ly/2wOGlgw
#javascipt #typescript #webdev #dataviz #webdeveloper #datavisualization
5 May 2020
Curious to know how we built this #interactive angular gauge #chart with range input? 🤔 Turns out it wasn't too difficult with ZingChart! Explore the live demo #code to see how we did it 👉🏽 buff.ly/3aaBXqx
#dataviz #webdev #javascript #typescript #chartoftheday
1
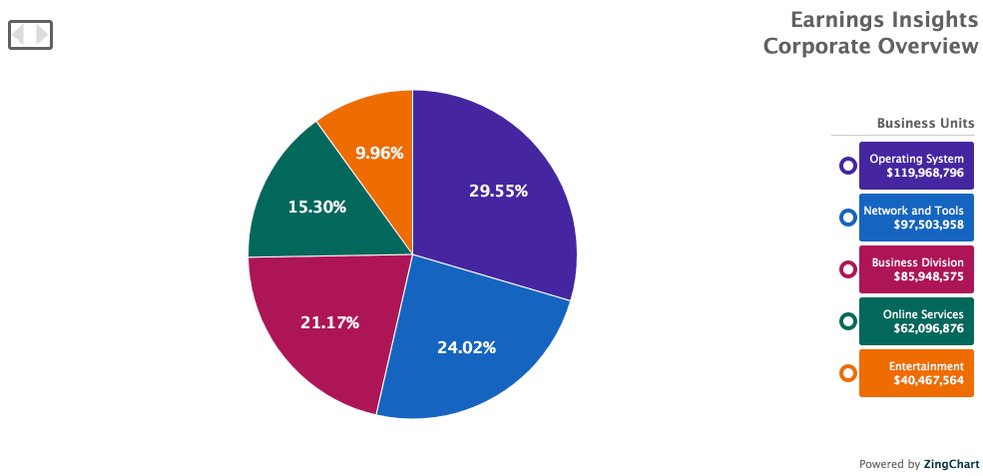
4 May 2020
Drilldown is a type of interactivity that can help lighten the information density of your charts. In this demo, we created a drilldown pie #chart that reveals a second level of information when a pie slice is clicked 👉🏽 buff.ly/2T4n9UE
#analytics #javascript #dataviz
2
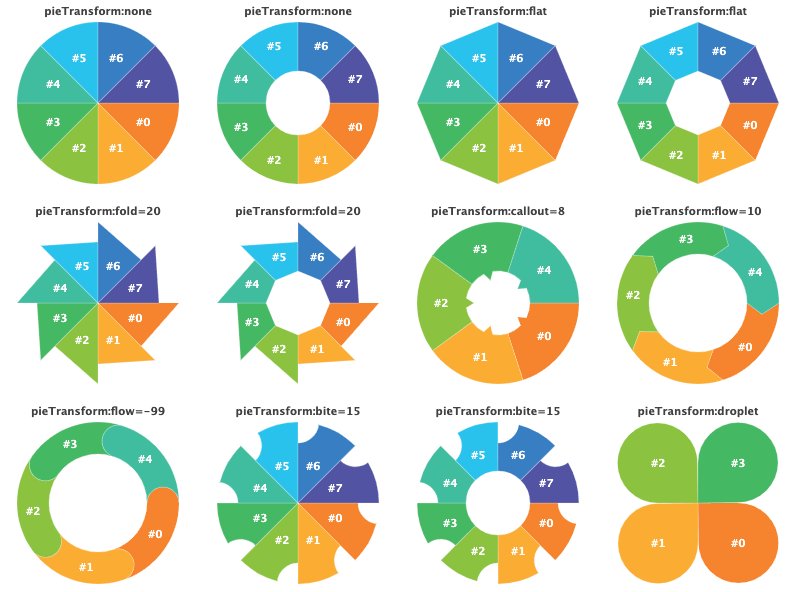
2 May 2020
Give your pie charts some character with a single line of #code! Transform the shape of your pie chart using any of the properties shown in this demo. 🥧
Check out this demo 👉🏽 buff.ly/2I2Bkna
#javscript #typescript #dataviz #webdev #datavisualization #webdeveloper
1
1
1 May 2020
Winter may be over for #GameOfThrones, but the story lives on! This family tree can be easily broken down with a #NetworkDiagram.
Checkout this demo ➡️ buff.ly/2uiHWdk
#ZingChart #dataviz #ZingGrid #chartoftheday #webdev #datavisualization #chart
1
30 Apr 2020
Looking for a #dataviz library that will transform your #JavaScript gauge charts from Bad to Excellent? Look no further than ZingChart, we've got you covered 😎 View the live demo ➡️ buff.ly/3982pRt
#infographic #webdev #chartoftheday
3
1
29 Apr 2020
Visualize flows & connections in your #analytics data using ZingChart's chord chart type! In our live demo, we use a chord diagram to visualize call center escalation paths across major US cities in a sample data set 📞 buff.ly/2vmD73y
#JavaScript #chartoftheday #dataviz
2
1
28 Apr 2020
#ZingChart gives web devs many ways to visualize data in #JavaScript charts – even if they're using the less common #chart types! For example, this interactive vertical treemap features sample annual expenditure data within a country during a given year 💵 buff.ly/2T4NrWN
1
27 Apr 2020
This animated #PopulationPyramid shows the beginning and end result of the data set with dotted lines. With tons of #animations to choose from, this is one of our favorite!
Check out this demo ➡️ buff.ly/2waiPu7
#javascript #typescript #webdev #dataviz #webdeveloper
2
1