
Joined August 2022
- Tweets 3,443
- Following 324
- Followers 5,507
- Likes 7,463
1,242 Photos and videos


Pinned Tweet

20 May 2025
My view on trading 📈
Some people ask for daytrading tips, but here’s my take:
I don’t chase every candle or stare at micro-charts. I focus on weekly/monthly setups that spark major moves.
I spot macro trend reversals so I trade less, profit more.
Time is our most valuable asset, so I refuse to be glued to the screen 24/7.
🎯 My mission: Build freedom, not another 9–5.
⚡ Trade smarter, not harder: Spot the macro trends that matter.
Ready to catch the next big wave? 🌊
#CrypFlow #Crypto #FinancialFreedom
16
6
131
23,635
13h
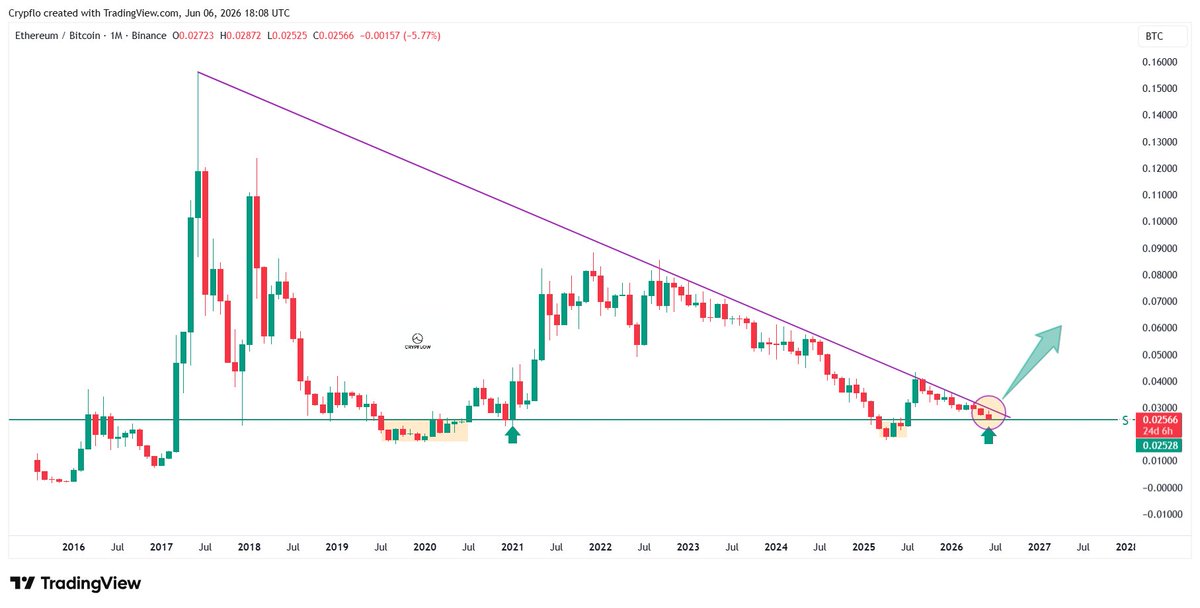
$ETH/BTC (1W) - At the launchpad
Back in 2020, ETH/BTC reclaimed 0.026, retested it and then exploded higher.
Today we're back at that exact same level.
✅ Support holding
✅ Stoch RSI oversold and crossing bullish
✅ Retest in progress
At the same time, ETH/BTC is still being compressed below the multi-year downtrend.
The longer price gets squeezed between support and resistance, the more powerful the move tends to be once the breakout finally comes.
As long as 0.026 holds, the setup remains intact.
ETH may be getting ready to outperform Bitcoin again.
2
8
32
1,015
13h
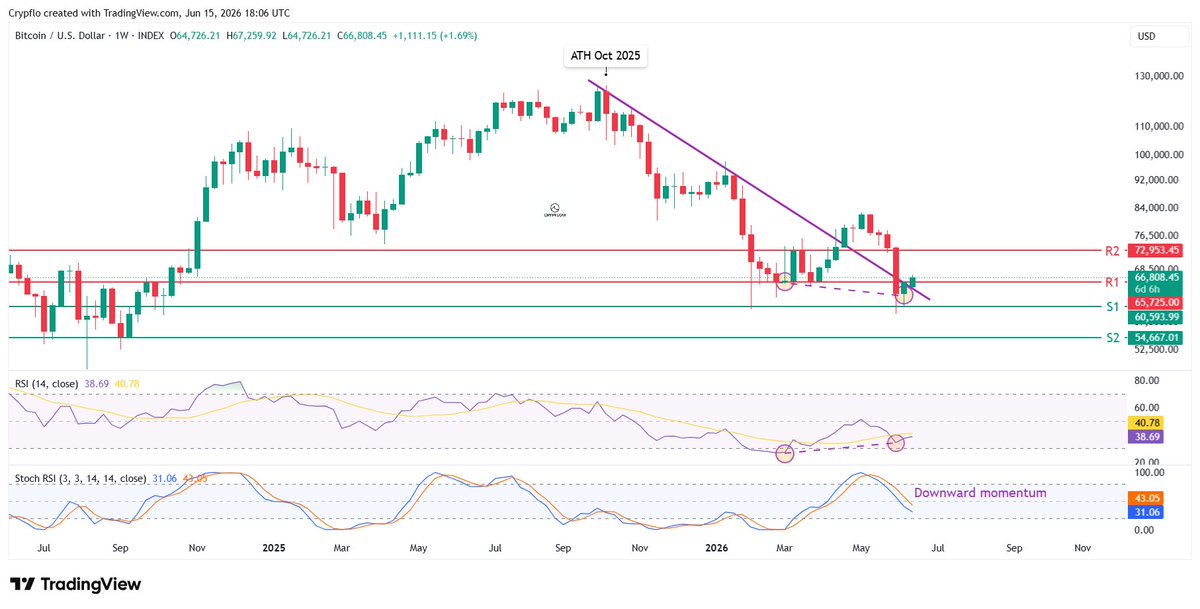
$BTC (1W) - A reclaim or another trap?
Last week, Bitcoin closed below both the multi-month downtrend and the R1 resistance level.
But at the start of this week, BTC is already pushing back above both levels.
And there's something else worth paying attention to.
While price made a lower low...
the weekly RSI made a higher low.
That's a bullish divergence on the weekly chart and not something to ignore. This means downside momentum is weakening.
However, the weekly Stochastic RSI is still pointing lower and momentum hasn't turned yet.
Reclaim the downtrend and R1 on the weekly close and the door opens for a move back towards R2 around 73K.
Fail here...
and this may end up being nothing more than another rejection at resistance before the next leg lower.
2
5
27
1,000
Jun 12
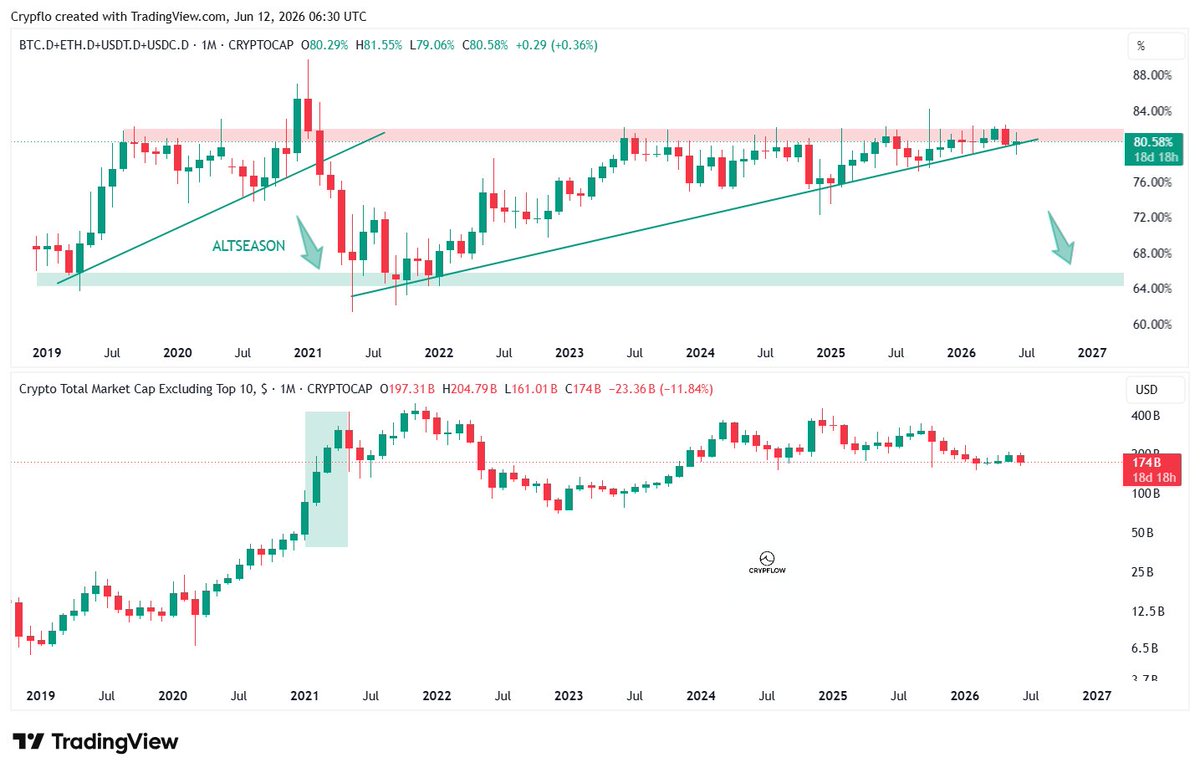
BTC.D_ETH.D_STABLES.D vs $OTHERS (1M) - The setup that preceded the 2021 altcoin rotation. 👀
Right now, more than 80% of the crypto market is concentrated in:
→ Bitcoin
→ Ethereum
→ Stablecoins
Since June 2023, this metric has remained above 75%.
But something interesting is happening.
Dominance is being compressed between the 80% resistance zone and a rising multi-year uptrend.
The market is getting squeezed.
When dominance peaked at these levels 2021, capital eventually rotated into altcoins and the biggest expansion phase followed.
But there's an important difference.
Back in 2021, altcoins were already trending higher.
Today, we're still sitting in a BTC bear market.
Sentiment is weak.
Confidence is low.
And many investors have already written altcoins off.
That's what makes this setup so interesting.
If Bitcoin eventually finds its bottom and confidence returns to the market, capital won't stay parked in BTC, ETH and stablecoins forever.
It will start rotating.
And if this multi-year dominance uptrend finally breaks...
we could see the rotation we have been waiting for.
The biggest moves usually begin long before the majority believes they're possible.
6
16
65
1,867
Jun 11
$BTC (2W) - The signal failed.
Back in May I highlighted something unusual.
Bitcoin had reclaimed the 45 level on the 2W RSI.
Historically, that level marked the transition out of the bear market environment.
There was only one exception:
➡️ July 2015
Back then, Bitcoin briefly reclaimed 45...
before falling back below it and forming a lower low months later.
Fast forward to today.
Bitcoin did exactly what I warned was possible.
✅ RSI moved back above 45
❌ Failed to hold it
❌ Dropped back below 45 again
For now, the signal has failed.
And as long as the 2W RSI remains below 45, Bitcoin remains in a bear market environment.
The good news?
This never happened twice in a row, so the next time BTC reclaims the 45 RSI level chances are high it will mark the start of the bull.
The bad news?
That previous case (July 2015) still needed one final washout before the real bottom was in.
Now we wait and see whether history decides to rhyme again.
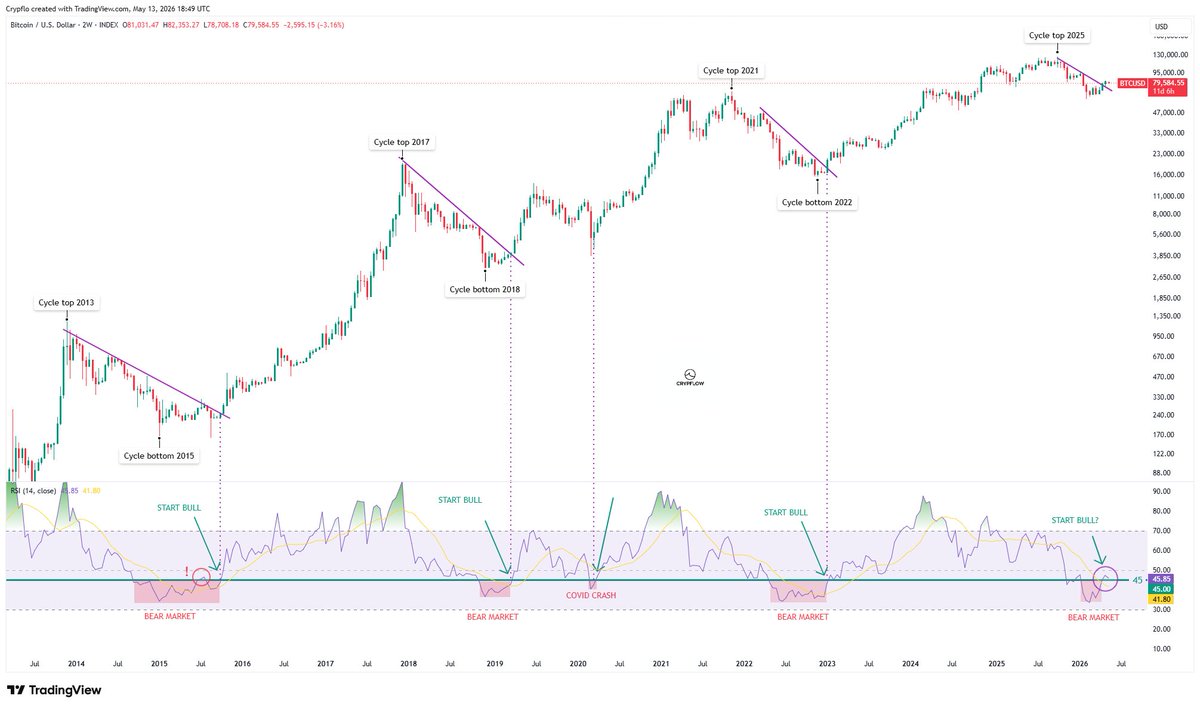
May 13

$BTC (2W) - A major signal just triggered.
Bitcoin just triggered a signal rarely seen this early in a bear market.
The 2W RSI just closed back above 45 again.
Historically, reclaiming that level marked the transition out of the bear market environment.
There was only ONE time where BTC reclaimed 45 during a bear market… and then lost it again.
That was in July 2015.
Back then, Bitcoin failed to break the multi-month downtrend and eventually formed a double bottom.
This time, BTC already broke the downtrend.
A few months ago, several higher timeframe signals were pointing toward the possibility of a lower cycle bottom.
And to be clear, that’s still possible.
But this cycle is also starting to show signals we’ve never seen this early during a bear market before.
If the bottom is already in…
it would surprise a lot of people.
This alone doesn’t confirm the transition into the bull.
We have to wait for confirmation from other higher timeframe charts as well.
5
11
61
3,373
Jun 10
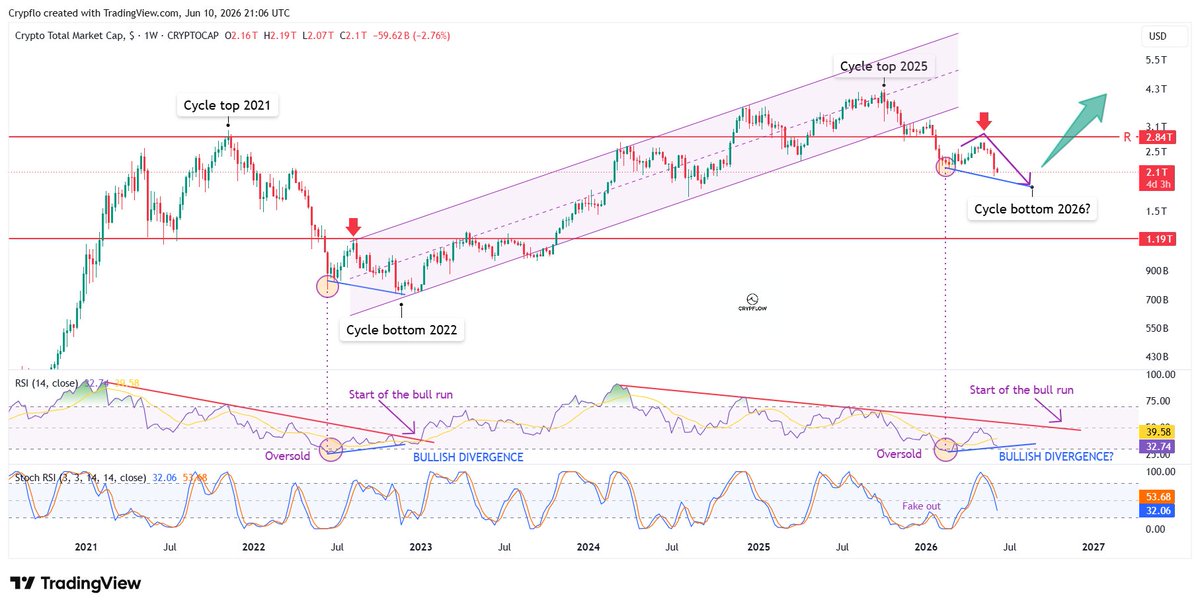
$TOTAL (1W) - Three months ago I shared this path.
Back in March I pointed out a setup that looked very similar to the 2022 bottom.
The idea was simple:
1. Rally from oversold conditions.
2. Get everyone excited again.
3. Then get rejected and make one final lower low while RSI holds up.
That final lower low is what created the bullish divergence at the 2022 bottom.
Now look where we are.
✅ We rallied first.
✅ The market turned bullish again.
✅ TOTAL got rejected and is now testing lower levels.
Almost exactly the path I mapped out three months ago.
The big question now:
Will RSI continue holding up while price makes a lower low?
Because that's what marked the 2022 bottom.
If it happens again...
the biggest opportunity won't be buying the breakout.
It'll be buying the fear before it.
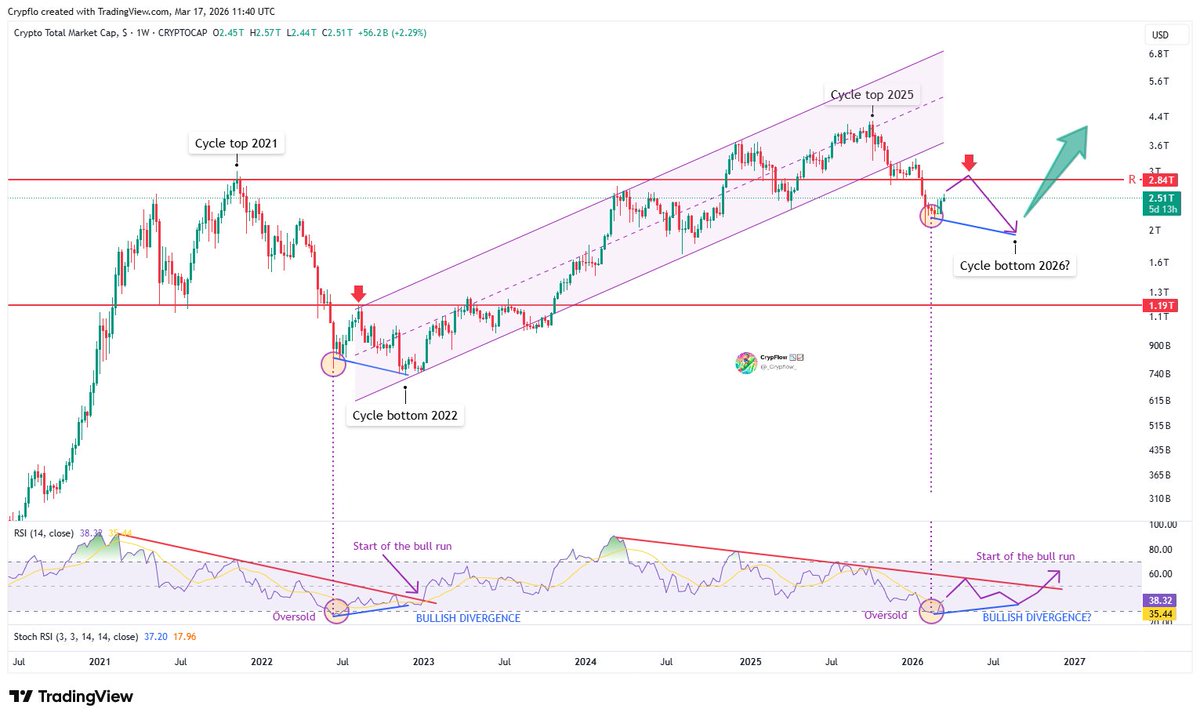
Mar 17
$TOTAL (1W) - Bottom forming?
In 2022, the crypto market bottomed when three things happened:
🔹RSI reached oversold
🔹Compression below RSI downtrend
🔹A bullish divergence formed
🔹Momentum started turning up
That marked the start of the next expansion phase.
Now look at the current setup:
🔹RSI just bounced from oversold
🔹Compression below RSI downtrend
If history repeats we might reject at the previous cycle top resistance, create a lower low in market cap while the RSI creates a higher low. → bullish divergence
If this structure confirms, the real bottom would form later this year.
Invalidation is a break above 3.3T, this would signal a trend reversal which means the bull run might have already started..
1
8
45
2,805
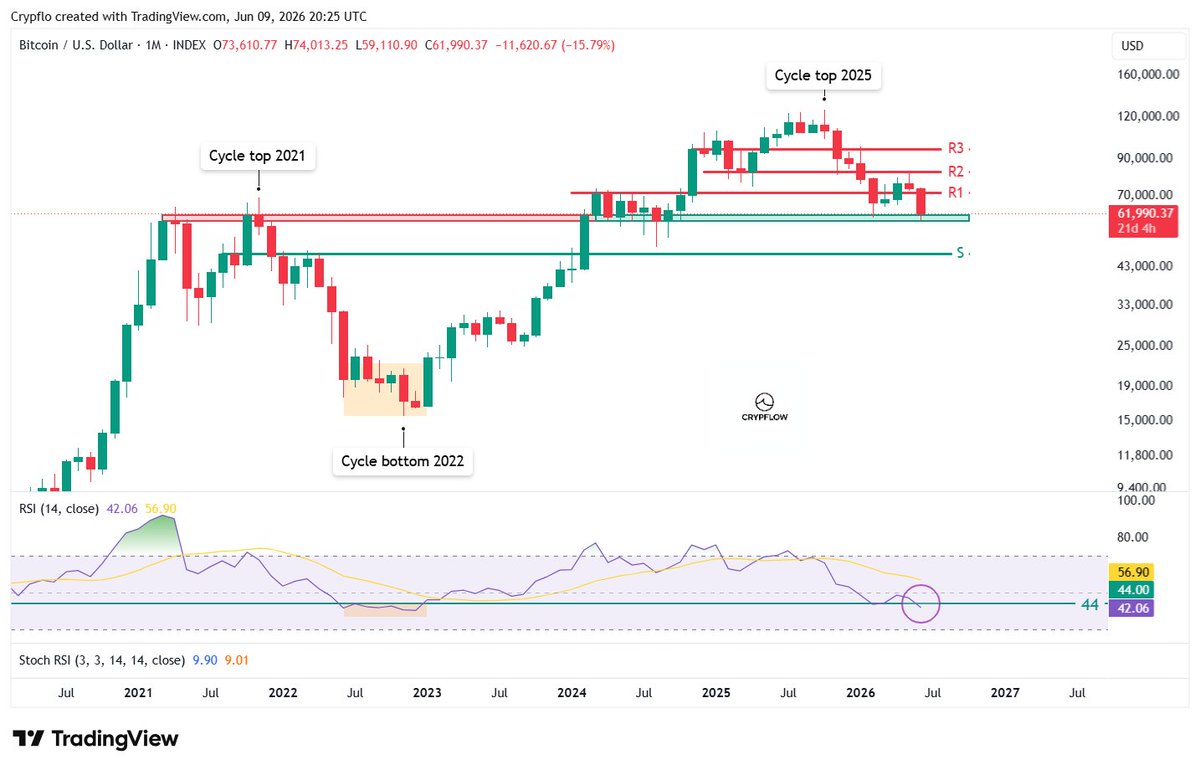
Jun 9
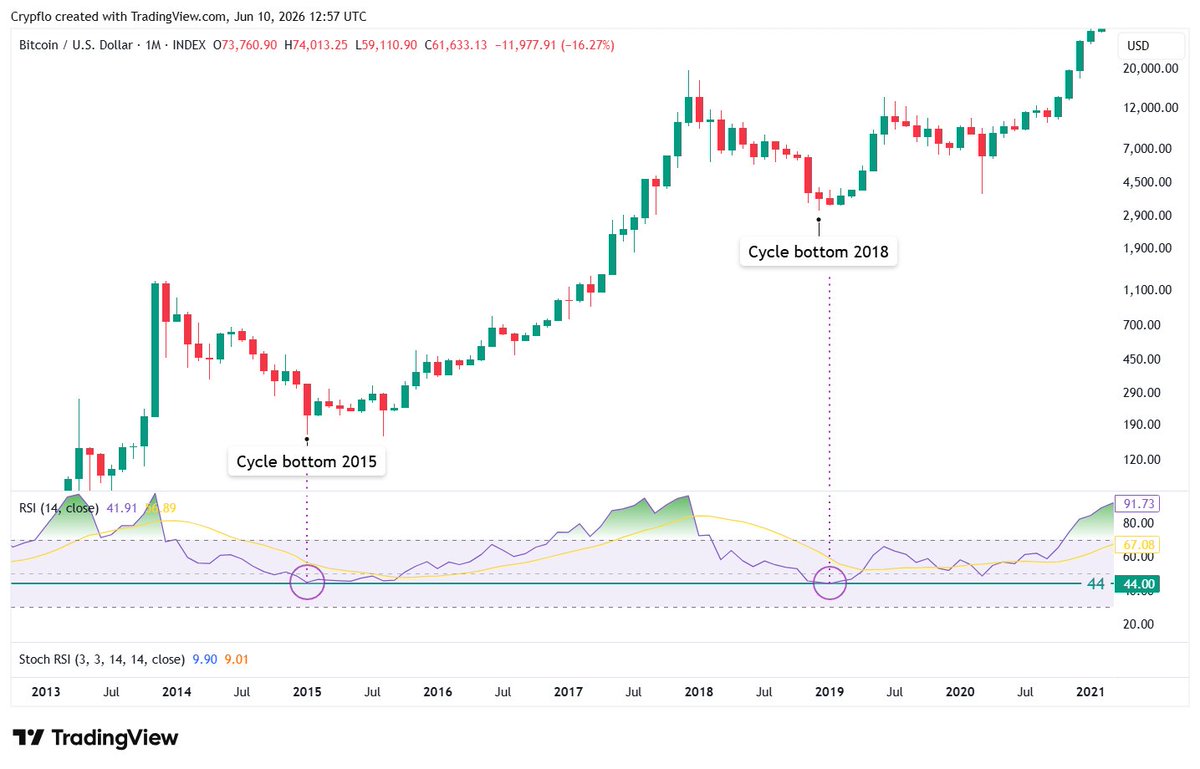
$BTC (1M) - Bitcoin just entered the zone where previous cycle bottoms formed.
The monthly RSI just dropped below 44.
Why does that matter?
Every major cycle bottom formed at or below this level.
✅ 2015 → RSI 44
✅ 2019 → RSI 44
✅ 2022 → RSI 40
Now we're back there again with the RSI sitting at 42.
Could Bitcoin still go lower?
Absolutely.
In 2020, price continued lower even after entering this zone.
But if you're waiting to buy the exact bottom...
you're probably looking at it the wrong way.
The goal isn't to nail the bottom.
The goal is to accumulate when Bitcoin is trading in historically attractive zones.
That's why I prefer scaling in.
DCA now.
And if price goes lower, buy more.
5
11
49
2,513
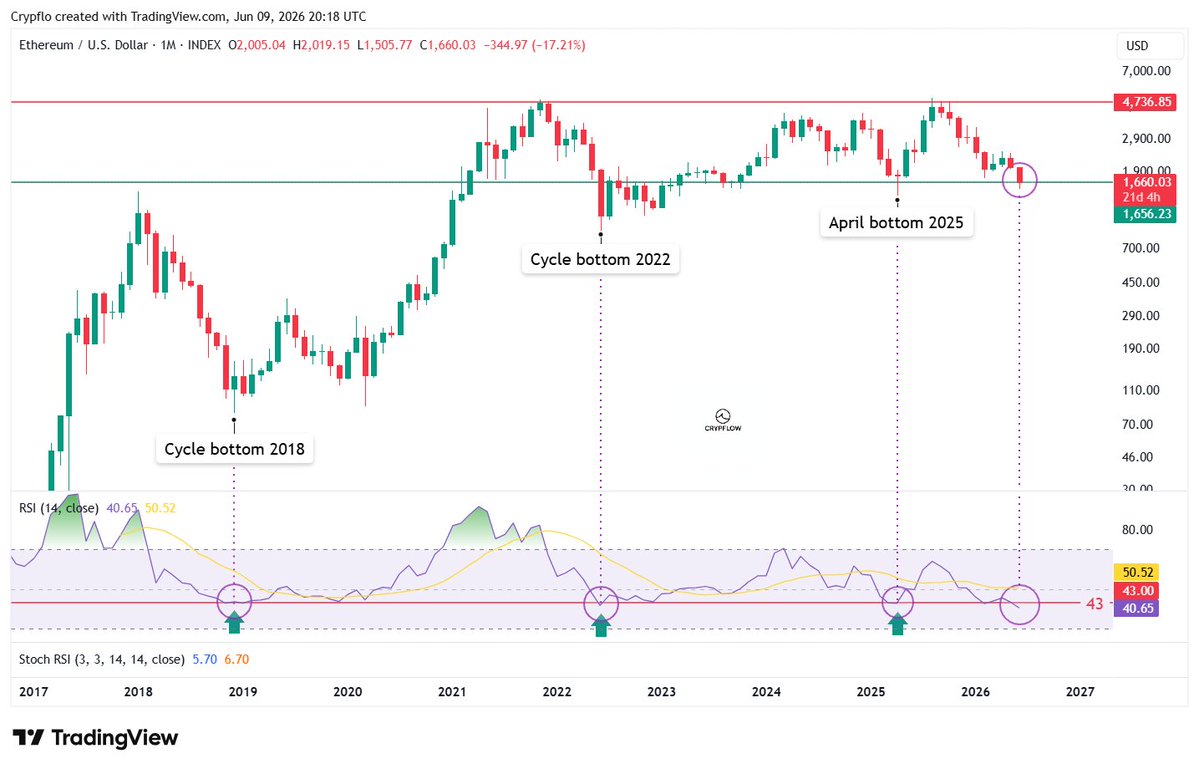
Jun 9
$ETH (1M) - Ethereum has never been this oversold on the monthly. 👀
The monthly RSI just dropped below 43.
Every previous time ETH reached this zone, a major bottom was either forming or already in.
✅ 2018 cycle bottom
✅ 2022 cycle bottom
✅ April 2025 local bottom
And now we're back there again with the RSI reaching levels never seen before.
Historically, these are the moments when risk/reward is shifted heavily in favor of long-term buyers.
6
11
81
3,833
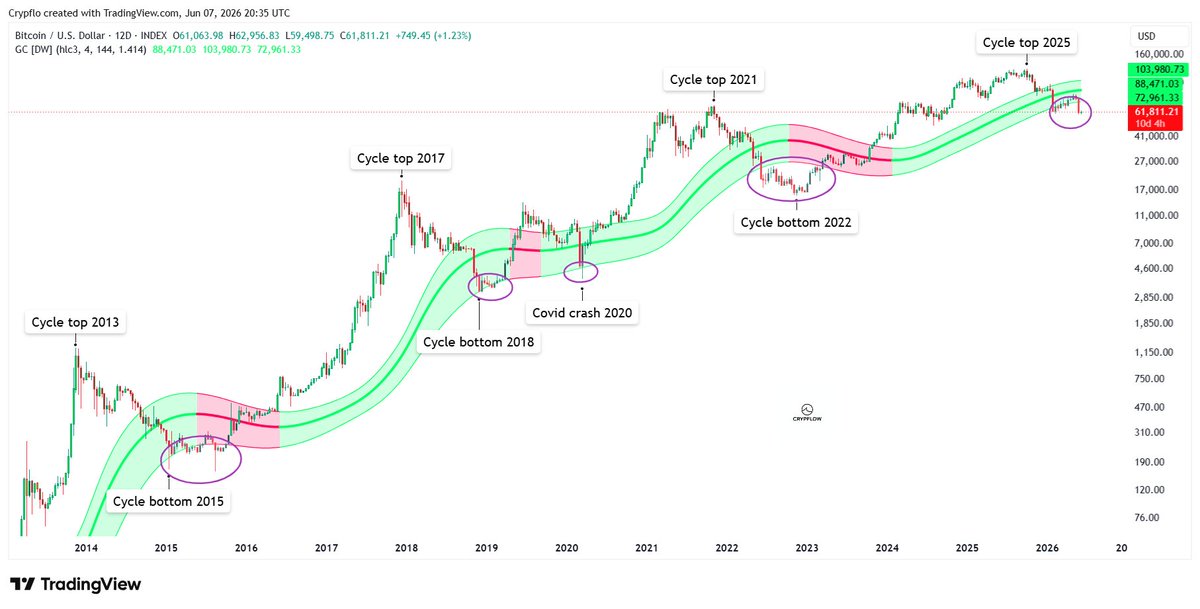
Jun 7
$BTC (12D) - Bitcoin is back in its historical buy zone.
For more than a decade, Bitcoin has repeatedly found major bottoms below the 12D Gaussian Channel.
✅ 2015 bottom
✅ 2018 bottom
✅ 2020 Covid crash
✅ 2022 bottom
Every time Bitcoin entered this zone, it was either forming or sitting very close to a major bottom.
Bitcoin is currently trading below the Gaussian Channel once again.
Does that guarantee a bottom?
Of course not.
But historically, DCA'ing Bitcoin below this channel has been a very smart move in the long run.
5
18
76
3,167
Jun 7
$TOTAL3 (2W) - Is most of the downside behind us for altcoins? 👀
Back in 2022, the 2W RSI lost the 50 level.
Altcoins entered a bear market and it took roughly 550 days before the RSI reclaimed 50 again.
That reclaim marked the start of the next altcoin bull run.
Now fast forward to today.
Back in November 2025, the same signal triggered again.
→ RSI fell below 50
→ Major support was lost
→ Altcoins entered a new bear market
Since then, TOTAL3 found support around 645B.
What followed was months of consolidation and a breakout above the multi-month downtrend.
Interestingly...
this structure looks very similar to the previous cycle where we also saw a breakout and retest before the real recovery started.
But there's one major difference.
The previous bear market spent 475 days below the 50 RSI before retesting the downtrend.
This time, we've only spent around 200 days below it.
So the question is:
Are altcoins already building a base?
Or is this just another bear market rally before lower prices?
Support around 645B needs to hold.
Lose it, and the odds of another leg lower increase significantly.
4
12
48
2,243
Jun 6
$BTC (1M) - The signal that marked every Bitcoin bottom.
One of the most reliable signals in Bitcoin's history:
The monthly MFI dropping below 35.
The Money Flow Index measures buying and selling pressure entering the market.
And every cycle tells the same story.
When the monthly MFI dropped below 35,
Bitcoin was either forming or sitting extremely close to its cycle bottom.
✅ 2015
✅ 2018
✅ 2022
Three cycles in a row.
Now we're approaching that level again.
Could this time be different?
Of course.
But if history continues to rhyme,
the biggest opportunities are usually found when the monthly MFI enters this zone.
And if this signal triggers again...
don't ignore it.
These opportunities only come around once every four years.
Bookmark this.
Your future self will thank you.
11
35
177
9,215
Jun 6
$BTC (1W) - Decision time.
Bitcoin is currently holding the 60K support zone.
This level acted as support during the february bottom and is now being tested again.
As long as 60K holds, bulls still have a chance to stabilize price, build a base and reclaim the downtrend.
Lose it, and the next major support sits around 54K.
4
3
41
2,057
Jun 6
$ETH/BTC (1M) - This is where ETH woke up last cycle. 👀
Back in 2020, ETH/BTC bottomed in this zone.
What followed was one of the strongest periods of ETH outperformance in history.
Today:
→ ETH/BTC is back at the same support level
→ Price is being squeezed inside the apex
A breakout from this structure could mark the start of a major rotation back into ETH.
This is one of the most interesting ETH charts I've seen in years.
The risk/reward here is becoming very interesting.
Especially if you're thinking in years, not weeks.
13
21
110
5,668
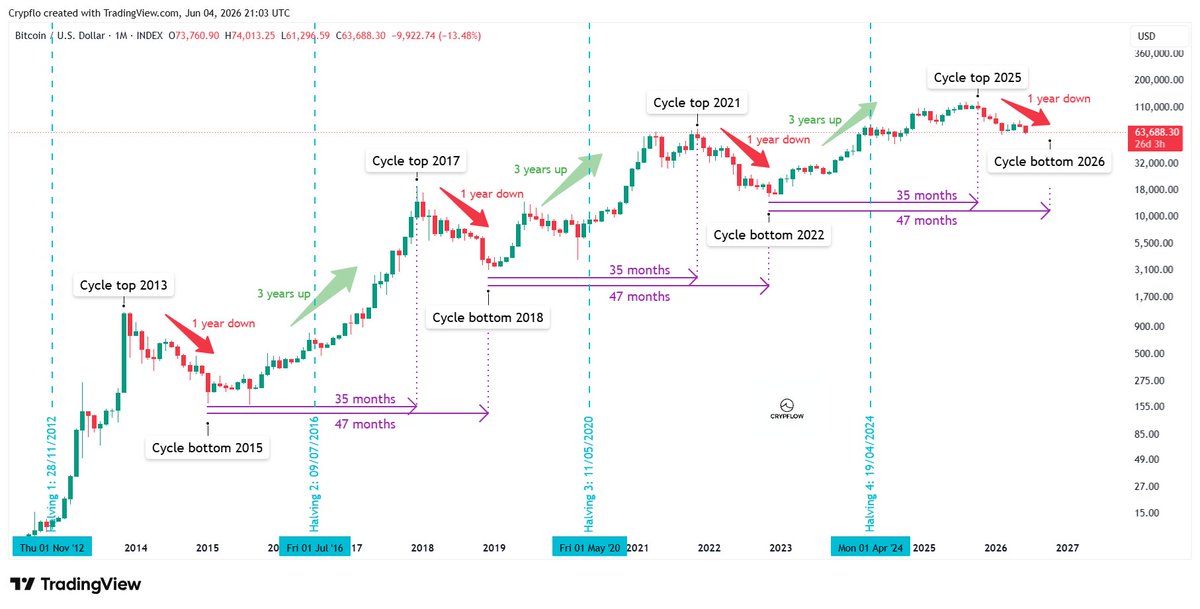
Jun 4
$BTC (1M) - Will the simulation continue?
Every prior Bitcoin cycle followed this pattern:
~1 year down
~3 years up
But here's the interesting part.
The timing was almost identical every cycle:
- Bottom → Top = 35 months
- Bottom → Bottom = 47 months
Not once.
Not twice.
Three cycles in a row.
If that rhythm continues, October 2026 would be the most likely window for the next cycle bottom.
Of course, history never repeats perfectly.
But after seeing the same pattern play out for over a decade, it's hard to ignore.
2
9
56
2,930
Jun 4
$SOL (1W) - Copying previous cycle
Back in March, I pointed out that the structure was starting to look very similar to the one that formed before the 2022 cycle bottom:
1. RSI breaking its downtrend
2. Bullish Stoch RSI cross
And just like previous cycle SOL got rejected on this first bounce.
If the pattern continues there is still more downside to come.
But here's the interesting part..
We're now entering the discount zone between $76 and $44 that I highlighted back then.
If history rhymes, this is where longer-term opportunities start appearing.
The question is:
Will SOL find support in this zone...
Or does it need one final flush before the next major wave begins?

Mar 19
$SOL (1W) - The same setup appeared before the last cycle bottom
Before the 2022 bottom, Solana printed a similar momentum structure:
🔹RSI breaking its downtrend
🔹Stoch RSI bullish cross in oversold territory
But the market didn’t bottom immediately.
SOL got rejected after a relief bounce and still moved lower before the final cycle low formed.
Now look at the current structure.
RSI is once again attempting to break its downtrend while Stoch RSI prints another bullish cross.
Market structure also looking very similar.
The key question:
Is the bottom already in…
or will SOL first revisit the discount zone between $76 and $44?
That area could become an important accumulation zone if history rhymes.

4
17
1,679
Jun 4
$BTC (2M) - The reason I stayed cautious.
Back on May 2nd, I shared this chart.
At the time, I was actually starting to lean bullish again.
Bitcoin had reclaimed the downtrend.
The Wave Trend had reclaimed -14.
And the market was showing the first signs of a potential reversal.
But there was one thing that kept me cautious:
The 2M Stochastic RSI was sitting below 20.
Historically, every time that happened...
more downside was next.
That's why I said it was my biggest reason for caution.
A few weeks later:
❌ The weekly Stoch RSI confirmed bearish
❌ BTC lost 74K
And now we're testing the exact area where that warning starts to matter.
This is why I always pay attention to higher timeframes.
Sometimes a single chart can outweigh ten bullish ones.
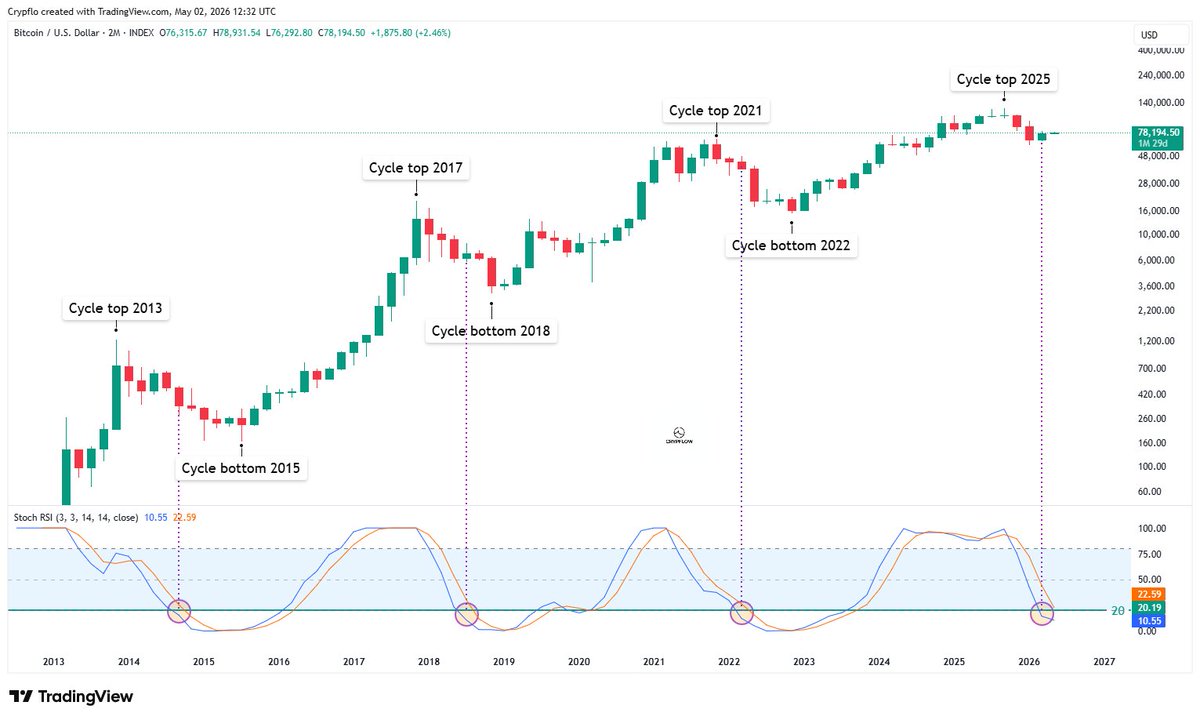
May 2
$BTC (2M)
Every single time the 2M Stoch RSI has gone below 20 in past cycles, the real cycle bottom was still ahead.
We’re sitting just below 20 again right now.
This is my biggest reason for caution.
3
17
1,255
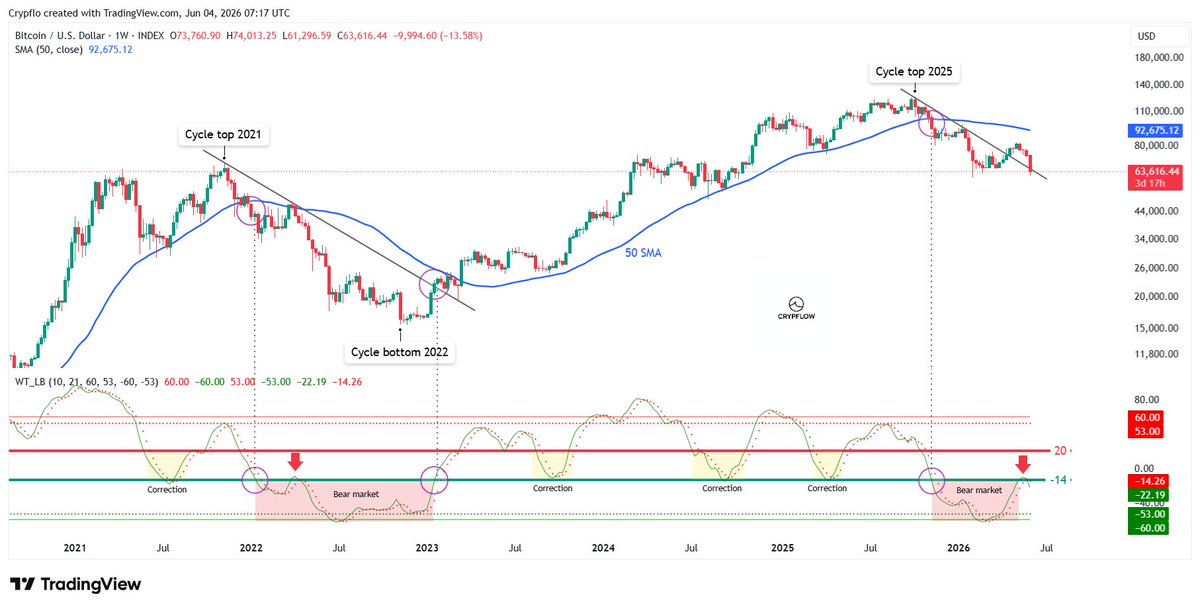
Jun 4
$BTC (1W) - One signal left... and now it's gone.
On May 13th I shared this chart.
At the time, Bitcoin had already completed 2 of the 3 confirmations that marked previous bear market reversals:
✅ Reclaimed -14 on the Wave Trend
✅ Broke the multi-month downtrend
❌ Reclaim the 50 SMA
Now here's what happened next:
Bitcoin failed to reclaim the 50 SMA.
And more importantly...
The Wave Trend lost the -14 level again.
In previous cycles, reclaiming -14 was one of the earliest signs that the bear market was ending.
Losing it again tells us the reversal attempt failed.
We saw it happen in the previous cycle as well. (red arrow)
That's why I always focus on confirmation rather than prediction.
The market was trying to reverse.
The market failed and needed more time.
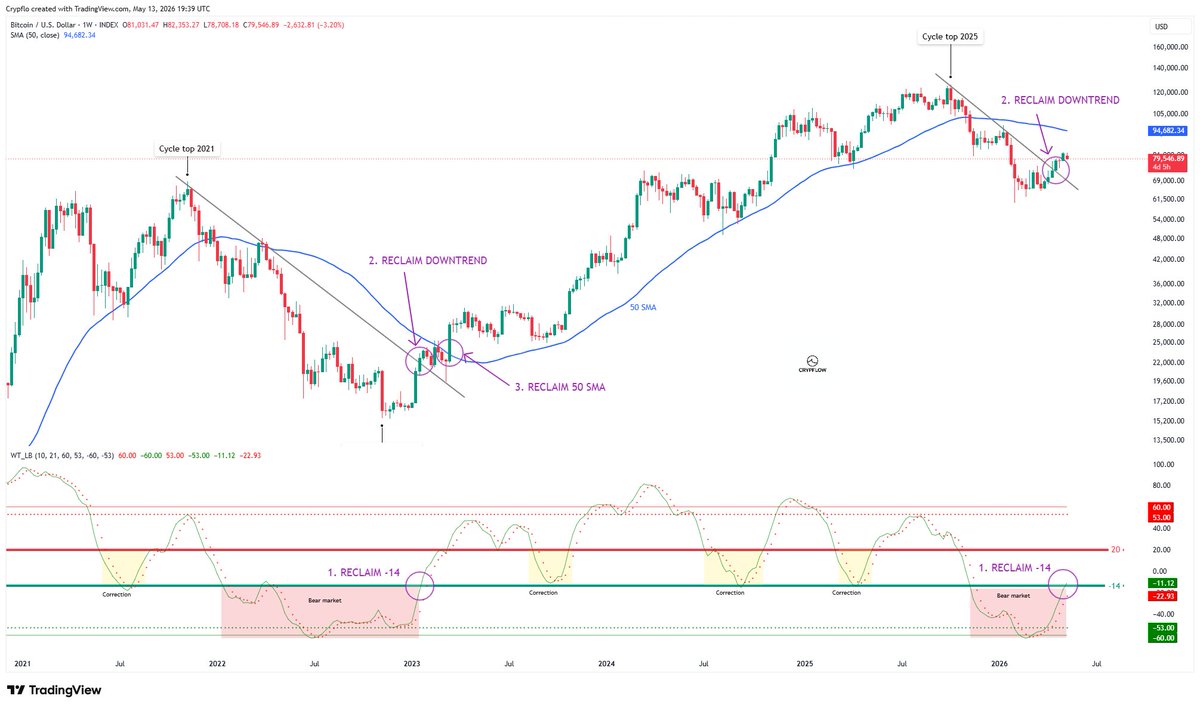
May 13
$BTC (1W) - One signal left.
Every previous cycle, Bitcoin needed 3 things to transition from a bear market back into a bullish environment:
→ reclaim -14 on the wave trend
→ break the long-term downtrend
→ reclaim the 50 SMA
Right now, 2 out of 3 already happened.
1. The wave trend reclaimed -14 again.
2. BTC broke back above the multi-month downtrend.
That’s exactly how previous cycle reversals started building.
Now only one major confirmation is left:
the 50 SMA.
And historically… after reclaiming the 50 SMA, Bitcoin never made a lower low again.
One signal left.
1
4
30
2,398
Jun 4
$BTC (1W) - Back in the DCA zone.
Bitcoin is back below the weekly 200 EMA.
Fear is rising.
Sentiment is deteriorating.
But my view hasn't changed.
Historically, losing the weekly 200 EMA has often been painful in the short term...
but it has also marked the best long-term accumulation zones of the cycle.

1
8
30
1,048