
Investing Journal, Global Stocks, No Financial Advice
Joined January 2010
- Tweets 65
- Following 815
- Followers 155
- Likes 457
10 Photos and videos


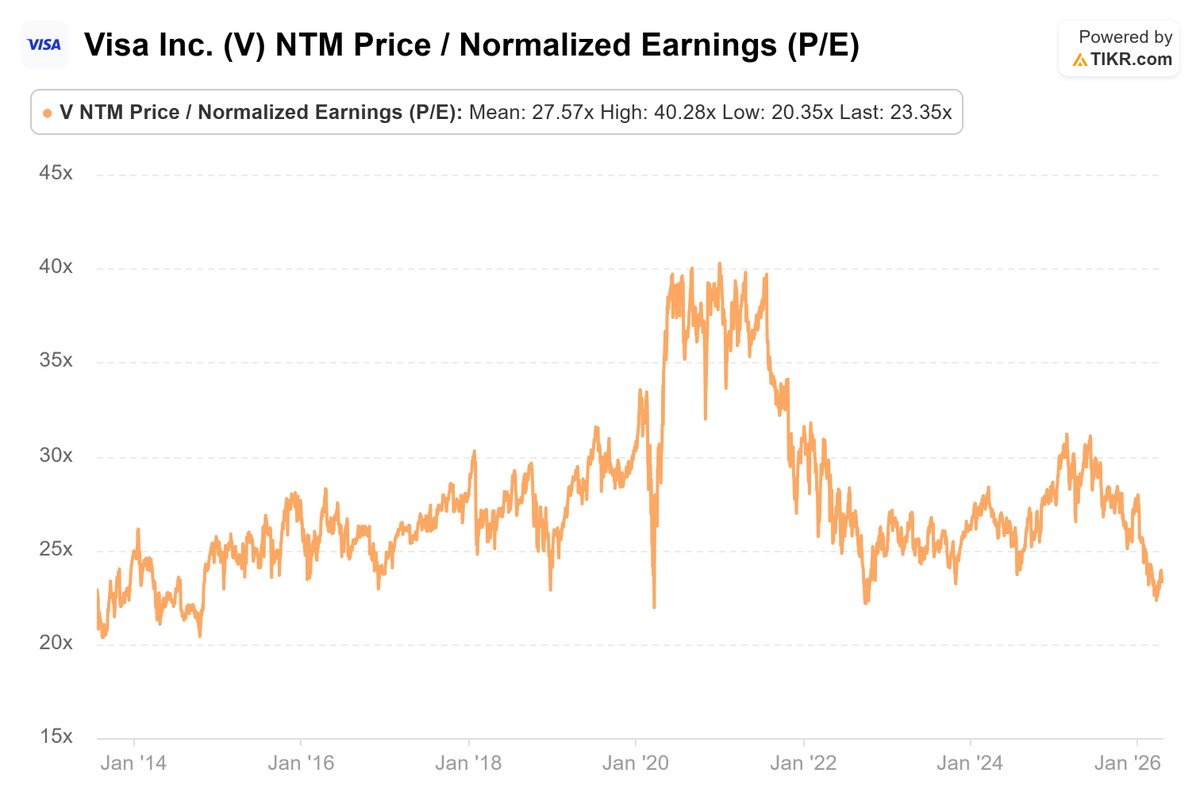


Jun 4
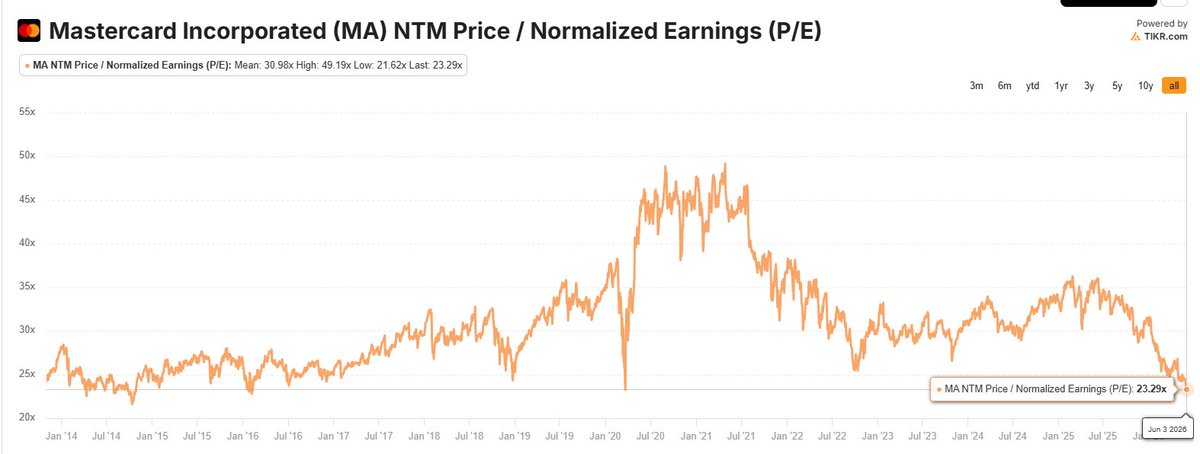
Mastercard now trades where it did at the COVID bottom, except this time the world isn’t locked indoors.
$MA
44
May 31
Entero Healthcare Q4FY26 Deep Dive
#EnteroHealthcare #ENTERO
Entero Healthcare reported a strong Q4FY26, but this is not a simple “revenue up, EBITDA up, PAT up” story. The real question is whether Entero is slowly evolving from a low-margin pharma distributor into a higher-margin healthcare distribution platform, or whether it remains a complicated, acquisition-led distribution roll-up.
Q4 revenue grew 42.6% YoY to ₹1,910 cr. The growth mix was important: organic growth was ~17%, and acquisition-led growth contributed ~26%. For FY26, revenue grew 29.3% to ₹6,591 cr. Entero continues to grow faster than the Indian Pharma Market, but the outperformance multiplier has moderated. Management clarified that underlying like-for-like organic growth is still around 15%, or roughly 1.5x industry growth, but reported growth is affected by some businesses moving to net-margin accounting and the conscious exit from some low-margin / low-ROIC revenue.
The most important operating metric this quarter was gross margin. Q4 gross margin expanded to 10.9%, up around 110 bps YoY, while FY26 gross margin improved to 10.3%, up around 78 bps YoY. For a distributor, this is meaningful. Management attributed this to two factors: procurement benefits from scale and a higher contribution from commercial distribution roles, including demand generation. Management said 10–15% of sales currently comes from such full commercial roles, and margins in these contracts can be at least double normal distribution margins. That said, I think the main reason for margin improvement is likely product mix, because MedTech carries much higher gross margins than pharmaceutical distribution.
This is the crux of the thesis. Plain pharma distribution is not a very exciting business. It is low margin, working-capital heavy and does not usually have much pricing power. But if Entero can steadily increase the share of higher-margin commercial distribution, MedTech, diagnostics, cold-chain and value-added manufacturer partnerships, then the business starts looking less like a plain distributor and more like a scaled healthcare distribution platform.
MedTech has become quite meaningful to this story. Entero closed 7 acquisitions in FY26, including 3 in MedTech. Management said MedTech is already 15% of revenue and can move towards 20% over the next 2–3 years. FY27 MedTech revenue should cross ₹1,000 cr based on the current platform itself. This is important because MedTech carries better margins than pharma distribution, especially where Entero plays a commercial role. But it also makes the business more complex. In IVD, for example, Entero places machines at labs under reagent-rental type models. This creates sticky revenue, but also increases depreciation. So EBITDA margin improvement is good, but investors need to track depreciation, finance cost, minority interest and owner earnings carefully.
EBITDA performance was strong. Q4 EBITDA grew 76% YoY to ₹86 cr, and EBITDA margin expanded to 4.5% versus 3.7% YoY. FY26 EBITDA grew 55% to ₹266 cr, with EBITDA margin improving to 4.0%. Management has guided for 5.0% EBITDA margin in FY27, which means they expect another ~100 bps margin expansion. The bridge is higher MedTech mix, gross margin improvement, procurement benefits, operating leverage, exit from low-margin business and more commercial distribution contracts. This is ambitious, but not impossible if the mix shift continues.
The biggest issue in Q4 was NCI / minority interest. Consolidated PAT grew 44% YoY to ₹45 cr, but PAT attributable to owners was only ₹28 cr, up just 9% YoY. That is a very big difference. For shareholders, owner PAT matters more than consolidated PAT. Management explained that one partly owned subsidiary had an abnormally strong quarter, which led to minority interest being almost 38% of PAT in Q4. They expect NCI to normalize to 25–27% of pre-NCI PAT in FY27. This clarification was important, but honestly, it should have been part of the opening remarks. If consolidated PAT is 44% but owner PAT is only 9%, management should proactively explain why.
This is part of a broader communication issue. I like the company and the operating direction, but communication could be sharper. The NCI issue was clarified only after an analyst asked. The flattish net worth issue was also clarified only after a question, with the CFO explaining that it was due to first-time recognition of put-option liabilities for subsidiaries where Entero is not a 100% shareholder. Similarly, the FY27 revenue growth guidance initially looked low given the FY26 acquisitions, but management later clarified that it includes some businesses being recognized on a net-margin basis and conscious exit from low-margin / low-ROIC business. These are important points and should ideally be explained upfront because the business is becoming more complex.
Cash flow was the biggest positive in FY26. FY25 operating cash flow was negative ₹77 cr. FY26 operating cash flow turned positive to ₹96 cr. Q4 alone generated ₹105 cr of operating cash flow. Net working-capital days improved to 59 days in Q4 versus 64 days QoQ and 66 days YoY. For a distributor, this is extremely important. Revenue growth without cash conversion is low-quality growth. Management has guided for FY27 operating cash flow conversion of at least 50% of EBITDA. Given FY27 EBITDA guidance of roughly ₹405 cr, this implies OCF of ₹200 cr if delivered. This will be one of the most important monitorables.
Management’s working-capital explanation was also interesting. Q4 revenue was already ₹1,910 cr, which annualizes to roughly ₹7,600–8,000 cr. FY27 revenue guidance is around ₹8,100 cr. So management is saying most of the working capital required for FY27 revenue is already sitting in the March balance sheet, and incremental working capital requirement should not be very high unless growth is much higher than guidance. This makes sense, but it has to show up in FY27 cash flow.
FY27 guidance is clear: 23% revenue growth, 5% EBITDA margin, at least 50% EBITDA-to-OCF conversion, and no new acquisitions included. On FY26 revenue of ₹6,591 cr, 23% growth implies FY27 revenue of around ₹8,100 cr. At 5% EBITDA margin, that implies EBITDA of around ₹405 cr. Assuming D&A of ~₹60 cr, gross finance cost of ~₹80 cr, some other income / interest income, 22–23% tax rate and NCI at 25–27% of pre-NCI PAT, I get rough FY27 PAT attributable to owners of around ₹155–160 cr, or EPS of roughly ₹35–37 after NCI. This is my estimate, not company guidance.
At a market cap of around ₹5,200 cr, the stock trades at roughly 45x FY26 owner PAT of ₹115 cr. On rough FY27 owner PAT of ₹155–160 cr, the stock trades at around 33x FY27E earnings. So valuation is neither cheap nor crazy. It is reasonable only if Entero delivers 5% EBITDA margin, ₹200 cr OCF, and clean owner-level earnings growth.
The bull case is that Entero is building a scaled healthcare distribution platform: 1 lakh pharmacies, 3,600 hospitals, 97,500 SKUs, 3,300 manufacturers, 136 warehouses and presence across 523 districts. Manufacturers come to Entero because it has customers. Customers come to Entero because it has product breadth. This two-sided network has value. Scale, procurement, cold-chain, SKU breadth and commercial distribution relationships matter.
But I would not over-romanticize the moat. Simply moving boxes is not a great business. The moat improves only if higher-margin commercial distribution and MedTech keep scaling, and if cash conversion improves. Otherwise, this can become a complicated roll-up with rising goodwill, NCI leakage, put-option liabilities and owner PAT diverging from consolidated PAT.
My view: decent company, good quarter, right strategic direction. Gross margin expansion and cash flow improvement were the biggest positives. The main concerns are owner PAT quality and communication around NCI, put-option liabilities and guidance adjustments. At around 33x FY27E owner PAT, valuation is neither cheap nor crazy. If the company can sustain mid-teens organic growth, improve margins, convert EBITDA into cash, and keep scaling MedTech/commercial distribution, it could become an attractive long-term healthcare distribution platform. But FY27 execution and communication quality will matter a lot from here.
2
757
May 28
Trying to make sense of $QXO valuation post Beacon Kodiak proposed TopBuild $BLD.
Rough math:
QXO diluted shares: ~869m
CMP: ~$17.4
Equity value: ~$15bn
Net debt as of Q1: ~zero
Add Kodiak deal value: ~$2.25bn
Add TopBuild deal value: ~$17bn
Pro forma EV: ~$34bn
Pro forma EBITDA: ~$2.1bn
That’s ~16.3x EV/EBITDA before synergies.
Clearly not cheap for what is ultimately a building products distribution / installation platform.
And this is where the TopBuild deal becomes important. BLD is a high-quality asset, but the multiple paid looks quite full to me. So going forward, it won’t just matter how many deals QXO does — it will matter what valuation they pay for those deals.
The real question is:
Can Brad Jacobs use this platform to add a lot more EBITDA over the next 5–10 years through M&A, procurement scale, branch density, tech, working capital discipline and margin improvement?
If EBITDA compounds to $4–5bn over time, maybe the premium is justified.
What do you think — classic “pay up for the jockey” setup, or is the market already giving too much credit upfront?
4
1,447
May 25
Will Ollie’s post an impressive quarter?
$OLLI
After seeing the $ROST blowout, I’m curious about Ollie’s.
The stock is at ~$82. Using the midpoint of FY26 adjusted EPS guidance of $4.45, $OLLI trades at roughly 18.4x FY26 EPS.
$ROST $TJX $OLLI
May 25

$ROST valuation:
Using the high end of FY26 EPS guidance, the stock at ~$235 trades at roughly 30.4x FY26 EPS.
Great quarter, great business — but at this multiple, I don’t see much IRR from here.
Let’s see!
101
May 25
$ROST valuation:
Using the high end of FY26 EPS guidance, the stock at ~$235 trades at roughly 30.4x FY26 EPS.
Great quarter, great business — but at this multiple, I don’t see much IRR from here.
Let’s see!
May 25
Ross Stores Q1 FY26: A monster quarter!
$ROST
Ross Stores delivered one of the strongest quarters in its history.
Sales grew 21% YoY (17% comps, 3.5% store growth)to $6.0bn, operating margin expanded 120 bps to 13.4%, and EPS grew 37% YoY to $2.02. This was miles ahead of management’s original EPS guidance of $1.60–$1.67. The company also raised FY26 guidance to 6–7% comp growth and $7.50–$7.74 EPS, implying 13–17% EPS growth for the year.
17% comp was driven by transactions (customer count went up) aided by tax refunds. Management repeatedly talked about better connecting merchandising, marketing, and stores. Every major merchandise category posted comps in the teens or higher. Ladies and cosmetics were the strongest businesses, but the strength was broad across merchandise and geographies. dd’s DISCOUNTS also delivered solid top-line performance.
Management said closeout availability remains outstanding, but the more interesting comment was that the market is noticing Ross’ growth rate. When vendors have good closeout opportunities, Ross is increasingly getting calls because it can take the goods, move volume, and act as a low-friction partner.
COGS improved by 145 bps, helped by 85 bps of merchandise margin improvement, 60 bps of occupancy leverage, 15 bps of distribution leverage, and 10 bps of domestic freight leverage. This was partly offset by 25 bps of higher buying costs and 25 bps of SG&A deleverage, both due to higher incentives after the earnings outperformance.
For Q2, Ross guided to 6–7% comparable sales growth, 9–11% total sales growth, 12.8–13.0% operating margin, and $1.85–$1.93 EPS.
For FY26, guidance was raised to 6–7% comp growth and $7.50–$7.74 EPS.
277
May 25
Ross Stores Q1 FY26: A monster quarter!
$ROST
Ross Stores delivered one of the strongest quarters in its history.
Sales grew 21% YoY (17% comps, 3.5% store growth)to $6.0bn, operating margin expanded 120 bps to 13.4%, and EPS grew 37% YoY to $2.02. This was miles ahead of management’s original EPS guidance of $1.60–$1.67. The company also raised FY26 guidance to 6–7% comp growth and $7.50–$7.74 EPS, implying 13–17% EPS growth for the year.
17% comp was driven by transactions (customer count went up) aided by tax refunds. Management repeatedly talked about better connecting merchandising, marketing, and stores. Every major merchandise category posted comps in the teens or higher. Ladies and cosmetics were the strongest businesses, but the strength was broad across merchandise and geographies. dd’s DISCOUNTS also delivered solid top-line performance.
Management said closeout availability remains outstanding, but the more interesting comment was that the market is noticing Ross’ growth rate. When vendors have good closeout opportunities, Ross is increasingly getting calls because it can take the goods, move volume, and act as a low-friction partner.
COGS improved by 145 bps, helped by 85 bps of merchandise margin improvement, 60 bps of occupancy leverage, 15 bps of distribution leverage, and 10 bps of domestic freight leverage. This was partly offset by 25 bps of higher buying costs and 25 bps of SG&A deleverage, both due to higher incentives after the earnings outperformance.
For Q2, Ross guided to 6–7% comparable sales growth, 9–11% total sales growth, 12.8–13.0% operating margin, and $1.85–$1.93 EPS.
For FY26, guidance was raised to 6–7% comp growth and $7.50–$7.74 EPS.
256
May 22
$DECK
FY27 revenue guide for $DECK is fine at 7–8%, but EBIT/PAT growth is basically ~0%.
EPS still grows ~5%, but essentially all of that is buyback-led.
At ~$100, stock is ~13.5x FY27 EPS.
May 22
Deckers Q4/FY26 Deep Dive
$DECK
Deckers ended FY26 with a better-than-guidance Q4. Currency also provided some tailwind to the reported numbers. International continued to carry almost all the growth, while reported U.S. sales were flattish at the group level.
The revenue guide for FY27 looks decent, but margins look soft. Similar to $ONON, Deckers is stepping up investments in marketing, people, technology and DTC. So FY27 operating profit is likely broadly flat, with most/all of the guided EPS growth coming from buybacks.
One important context: Q4 is a smaller quarter for Deckers. It was only ~20% of FY26 sales. UGG is still heavily fall/winter/holiday skewed, so the biggest quarter is not Q4. That said, Q4 still matters because it gives us a cleaner read on HOKA, international growth, gross margins and the FY27 setup.
Q4 revenue grew 9.6% YoY to $1.12bn, but constant-currency growth was 7.7%, so FX helped by ~190 bps at the company level.
HOKA, now 47% of FY26 sales, grew 14.5% to $671m. UGG, ~50% of sales, grew 9.2% to $409m. Other brands fell 35.6%, mainly due to portfolio cleanup.
By channel, DTC grew 13.2%, faster than wholesale at 7.1%. DTC is now ~41% of FY26 sales.
By geography, the divergence remained sharp: Domestic sales were almost flat at 0.3%, while International grew 25.5% (probably 20%-21% ex-FX). Management did clarify that both HOKA and UGG grew in the U.S., and the reported Domestic number was muted by discontinued brands like Sanuk/Koolaburra. Still, the main point stands: the U.S. is no longer the growth engine at the group level. International is doing the heavy lifting (most of the lifting).
Gross margin was good: 90 bps YoY to 57.6%. Drivers were full-price selling across HOKA and UGG, favourable FX, lower freight and some product/channel mix benefit, partly offset by tariffs.
SG&A grew ~20% YoY to 43.6% of sales versus 39.7% last year, broadly in line with guidance. The increase was driven by marketing, technology and brand-building expenses, with some expenses pulled forward to set up FY27.
Since SG&A grew much faster than gross profit and sales, EBIT was down ~10% YoY. Net income was also down ~10%. EPS was down only 4%, from $1.00 to $0.96, because of buybacks.
I would not read the EPS decline as demand weakness. The quarter was: decent revenue, very good gross margin, but elevated expense timing.
HOKA delivered its largest quarter ever at $671m and grew 14.5% YoY. Deckers did not disclose HOKA constant-currency growth separately, but since company-level growth went from 9.6% reported to 7.7% constant currency, FX clearly helped the reported number.
The brand is now growing closer to the company’s long-term HOKA framework of low-double-digit growth.
Management said HOKA saw “continued healthy gains in the U.S.”, but the bigger picture is that HOKA is now a more mature U.S. brand and a faster-growing international brand. The company expects mid-single-digit HOKA growth in the U.S. versus double-digit growth internationally.
Deckers also said six HOKA franchise families now generate over $100m of annual revenue, with three more close to that level. That is important because it reduces single-shoe dependency and gives the brand more segmentation: performance, lifestyle, premium/pro versions and channel-specific assortment.
The comparison with $ONON is interesting. HOKA is now a $2.6bn sales brand, while ONON is roughly ~$3.9bn. Yet ONON is growing 2x (ex-fx) despite being 50% larger than Hoka.
On said U.S. awareness crossed 30% for the first time. HOKA, by comparison, is already around 60% awareness in the U.S., 40% in Europe and 30% in China. So HOKA has a much more mature U.S. awareness base, while ONON still has a longer U.S. awareness runway.
So HOKA is doing fine, but it needs to maintain low-double-digit growth through international expansion, better lifestyle penetration and deeper franchise segmentation.
UGG grew 9% in Q4 to $409m, above expectations, helped by extended selling of fall products, especially in DTC.
This brand keeps surprising positively and continues to grow faster than the company’s long-term guidance. But it is still a fashion/lifestyle brand, so one has to be careful. UGG has historically gone through phases of high growth and no growth.
The company’s long-term outlook for UGG is mid-single-digit growth.
The key thing Deckers is trying to do is make UGG less seasonal. It is no longer just a winter boot brand. Management is pushing sneakers, sandals, clogs, slippers, apparel and accessories. Lowmel and Golden were major growth drivers in FY26, and men’s also contributed meaningfully. But despite all of it, it does remain a low growth brand.
FY26: very good year, but clear international skew
For FY26, Deckers revenue grew ~10% (Hoka 16%, UGG 8%) to $5.47bn, or 9.0% constant currency. EBIT grew 7%, lower than sales growth because of higher marketing and brand investments. EPS grew 11% to $7.02, helped by a lower diluted share count.
Wholesale grew 12.3%, faster than DTC at 6.3%. Domestic revenue was 0.2%, while International grew 26.8%.
Again, the domestic/international split is the main point. U.S. is clearly no longer the same engine it was during the early HOKA ramp. The incremental growth story is now international.
Gross margin for the year was 57.7%, down just 20 bps. That is impressive because tariffs were an ~80 bps headwind, mostly offset by underlying margin expansion from product mix and lower freight.
FY26 operating margin was 23.1%, still best-in-class for a footwear/apparel company.
Deckers also generated over $900m of FCF for the third consecutive year, ended with $1.9bn cash, had no borrowings, and repurchased $1.075bn of stock during the year. The board also increased the buyback authorization by $3.5bn, taking the total outstanding authorization to around $5bn.
FY27 guide: revenue okay, margins not so much
FY27 revenue guidance is $5.86–5.91bn, implying 7–8% growth. HOKA is expected to grow low-double-digit, UGG mid-single-digit.
Gross margin is guided to ~56.5%, down from 57.7%, mainly due to higher freight, Middle East shipping disruption, material upgrades, inflation and tariffs.
SG&A is also guided to delever to ~35% of sales. The investment areas are marketing, people, technology and DTC, including global HOKA retail expansion.
Operating margin guidance is 21.5% versus 23.1% in FY26. On the guided revenue base, that implies operating profit is broadly flat YoY.
EPS guidance is $7.30–7.45, implying ~5% growth. Given operating profit is likely flat, all of this EPS growth comes from buybacks. The company said FY27 EPS guidance assumes repurchases equal to around 80% of projected FCF.
Comparing with $ONON, gross margin guidance was much stronger for ONON and was upgraded, while Deckers’ gross margin is guided down. Deckers still has much higher operating profitability today, but the margin gap should narrow a bit as ONON scales and Deckers absorbs FY27 investment/cost pressure.
FY28–30 framework
Deckers also provided a medium-term framework: high-single-digit revenue growth, low-double-digit HOKA growth, mid-single-digit UGG growth, low-20s operating margin and low-double-digit EPS growth with continued buybacks.
The revenue framework is comforting because it suggests the company still sees durable growth across both brands. But I do not see a lot of margin expansion from here. A meaningful part of EPS growth can come from buybacks, so the real debate is whether HOKA can sustain low-double-digit growth and whether UGG avoids a fashion rollover.
Valuation
At ~$100, Deckers trades at ~13.5x FY27 EPS. That looks quite attractive for a business with two scaled premium brands, high gross margins, net cash, strong FCF and large buybacks.
Assuming ~12% EPS growth in the medium term, the PEG is around 1.1x.
Multiple re-rating probably requires the company to keep outperforming estimates, especially on HOKA growth and gross margins. But at this valuation, downside does not look very high unless HOKA slows materially or UGG rolls over.
1
1
483
May 22
Deckers Q4/FY26 Deep Dive
$DECK
Deckers ended FY26 with a better-than-guidance Q4. Currency also provided some tailwind to the reported numbers. International continued to carry almost all the growth, while reported U.S. sales were flattish at the group level.
The revenue guide for FY27 looks decent, but margins look soft. Similar to $ONON, Deckers is stepping up investments in marketing, people, technology and DTC. So FY27 operating profit is likely broadly flat, with most/all of the guided EPS growth coming from buybacks.
One important context: Q4 is a smaller quarter for Deckers. It was only ~20% of FY26 sales. UGG is still heavily fall/winter/holiday skewed, so the biggest quarter is not Q4. That said, Q4 still matters because it gives us a cleaner read on HOKA, international growth, gross margins and the FY27 setup.
Q4 revenue grew 9.6% YoY to $1.12bn, but constant-currency growth was 7.7%, so FX helped by ~190 bps at the company level.
HOKA, now 47% of FY26 sales, grew 14.5% to $671m. UGG, ~50% of sales, grew 9.2% to $409m. Other brands fell 35.6%, mainly due to portfolio cleanup.
By channel, DTC grew 13.2%, faster than wholesale at 7.1%. DTC is now ~41% of FY26 sales.
By geography, the divergence remained sharp: Domestic sales were almost flat at 0.3%, while International grew 25.5% (probably 20%-21% ex-FX). Management did clarify that both HOKA and UGG grew in the U.S., and the reported Domestic number was muted by discontinued brands like Sanuk/Koolaburra. Still, the main point stands: the U.S. is no longer the growth engine at the group level. International is doing the heavy lifting (most of the lifting).
Gross margin was good: 90 bps YoY to 57.6%. Drivers were full-price selling across HOKA and UGG, favourable FX, lower freight and some product/channel mix benefit, partly offset by tariffs.
SG&A grew ~20% YoY to 43.6% of sales versus 39.7% last year, broadly in line with guidance. The increase was driven by marketing, technology and brand-building expenses, with some expenses pulled forward to set up FY27.
Since SG&A grew much faster than gross profit and sales, EBIT was down ~10% YoY. Net income was also down ~10%. EPS was down only 4%, from $1.00 to $0.96, because of buybacks.
I would not read the EPS decline as demand weakness. The quarter was: decent revenue, very good gross margin, but elevated expense timing.
HOKA delivered its largest quarter ever at $671m and grew 14.5% YoY. Deckers did not disclose HOKA constant-currency growth separately, but since company-level growth went from 9.6% reported to 7.7% constant currency, FX clearly helped the reported number.
The brand is now growing closer to the company’s long-term HOKA framework of low-double-digit growth.
Management said HOKA saw “continued healthy gains in the U.S.”, but the bigger picture is that HOKA is now a more mature U.S. brand and a faster-growing international brand. The company expects mid-single-digit HOKA growth in the U.S. versus double-digit growth internationally.
Deckers also said six HOKA franchise families now generate over $100m of annual revenue, with three more close to that level. That is important because it reduces single-shoe dependency and gives the brand more segmentation: performance, lifestyle, premium/pro versions and channel-specific assortment.
The comparison with $ONON is interesting. HOKA is now a $2.6bn sales brand, while ONON is roughly ~$3.9bn. Yet ONON is growing 2x (ex-fx) despite being 50% larger than Hoka.
On said U.S. awareness crossed 30% for the first time. HOKA, by comparison, is already around 60% awareness in the U.S., 40% in Europe and 30% in China. So HOKA has a much more mature U.S. awareness base, while ONON still has a longer U.S. awareness runway.
So HOKA is doing fine, but it needs to maintain low-double-digit growth through international expansion, better lifestyle penetration and deeper franchise segmentation.
UGG grew 9% in Q4 to $409m, above expectations, helped by extended selling of fall products, especially in DTC.
This brand keeps surprising positively and continues to grow faster than the company’s long-term guidance. But it is still a fashion/lifestyle brand, so one has to be careful. UGG has historically gone through phases of high growth and no growth.
The company’s long-term outlook for UGG is mid-single-digit growth.
The key thing Deckers is trying to do is make UGG less seasonal. It is no longer just a winter boot brand. Management is pushing sneakers, sandals, clogs, slippers, apparel and accessories. Lowmel and Golden were major growth drivers in FY26, and men’s also contributed meaningfully. But despite all of it, it does remain a low growth brand.
FY26: very good year, but clear international skew
For FY26, Deckers revenue grew ~10% (Hoka 16%, UGG 8%) to $5.47bn, or 9.0% constant currency. EBIT grew 7%, lower than sales growth because of higher marketing and brand investments. EPS grew 11% to $7.02, helped by a lower diluted share count.
Wholesale grew 12.3%, faster than DTC at 6.3%. Domestic revenue was 0.2%, while International grew 26.8%.
Again, the domestic/international split is the main point. U.S. is clearly no longer the same engine it was during the early HOKA ramp. The incremental growth story is now international.
Gross margin for the year was 57.7%, down just 20 bps. That is impressive because tariffs were an ~80 bps headwind, mostly offset by underlying margin expansion from product mix and lower freight.
FY26 operating margin was 23.1%, still best-in-class for a footwear/apparel company.
Deckers also generated over $900m of FCF for the third consecutive year, ended with $1.9bn cash, had no borrowings, and repurchased $1.075bn of stock during the year. The board also increased the buyback authorization by $3.5bn, taking the total outstanding authorization to around $5bn.
FY27 guide: revenue okay, margins not so much
FY27 revenue guidance is $5.86–5.91bn, implying 7–8% growth. HOKA is expected to grow low-double-digit, UGG mid-single-digit.
Gross margin is guided to ~56.5%, down from 57.7%, mainly due to higher freight, Middle East shipping disruption, material upgrades, inflation and tariffs.
SG&A is also guided to delever to ~35% of sales. The investment areas are marketing, people, technology and DTC, including global HOKA retail expansion.
Operating margin guidance is 21.5% versus 23.1% in FY26. On the guided revenue base, that implies operating profit is broadly flat YoY.
EPS guidance is $7.30–7.45, implying ~5% growth. Given operating profit is likely flat, all of this EPS growth comes from buybacks. The company said FY27 EPS guidance assumes repurchases equal to around 80% of projected FCF.
Comparing with $ONON, gross margin guidance was much stronger for ONON and was upgraded, while Deckers’ gross margin is guided down. Deckers still has much higher operating profitability today, but the margin gap should narrow a bit as ONON scales and Deckers absorbs FY27 investment/cost pressure.
FY28–30 framework
Deckers also provided a medium-term framework: high-single-digit revenue growth, low-double-digit HOKA growth, mid-single-digit UGG growth, low-20s operating margin and low-double-digit EPS growth with continued buybacks.
The revenue framework is comforting because it suggests the company still sees durable growth across both brands. But I do not see a lot of margin expansion from here. A meaningful part of EPS growth can come from buybacks, so the real debate is whether HOKA can sustain low-double-digit growth and whether UGG avoids a fashion rollover.
Valuation
At ~$100, Deckers trades at ~13.5x FY27 EPS. That looks quite attractive for a business with two scaled premium brands, high gross margins, net cash, strong FCF and large buybacks.
Assuming ~12% EPS growth in the medium term, the PEG is around 1.1x.
Multiple re-rating probably requires the company to keep outperforming estimates, especially on HOKA growth and gross margins. But at this valuation, downside does not look very high unless HOKA slows materially or UGG rolls over.
2
616
May 20
Diploma PLC H1 FY26 deep dive:
$DPLM $DPLM.L
Great business, great result!
Excellent H1 '26 print. Peerless continues to drive a large part of the upside.
Diploma reported a very strong H1.
Revenue grew 17% to £851m, organic growth was 15%, adjusted operating profit grew 33% to £209m, adjusted margin expanded 300 bps to 24.5%, and adjusted EPS grew 36% to 109p.
Guidance was upgraded again: FY26 organic growth is now expected at 12% vs 9% earlier, acquisitions add 6% vs 3% earlier, helped by the post-Q1 acquisition burst including CDM, which has not closed yet, and margin guidance remains c.25%.
So headline: very good results.
But the deeper point is that this is increasingly a Controls / Peerless story.
Controls revenue grew 27% to £495m, with organic growth of 26%. Adjusted operating profit grew 45% to £166m, and margin expanded 430 bps to 33.5%.
Controls now represents ~58% of group sales in H1 FY26 vs 45% two years ago, and ~79% of group adjusted operating profit vs 56% two years ago.
This segment alone added ~£51m of incremental adjusted operating profit, versus group incremental adjusted operating profit of ~£52m. So almost the entire group profit growth came from Controls.
Now, Controls itself is not one business. The big platforms are Windy City Wire, Peerless, IS Group and Clarendon. These four are now the core of the division and represent ~90% of segment revenues, exposed to aerospace, defence, datacentres, energy and interconnects.
Peerless keeps growing very fast and at 50% margins. Management said the portfolio excluding Peerless still grew organically at high-single digits vs their general growth model of 5%. So the base business is healthy.
But a predominant portion of the margin enhancement is coming from Peerless. Ex-Peerless Controls also remains healthy, but Peerless is the big margin outlier.
Peerless was acquired as roughly a 30–35% margin business. Since then, it has been running at much higher levels. On the H1 FY26 call, management said Peerless has recently been running at 50% margins.
Peerless was ~£192m revenue in FY25.
For H1 FY26, using management’s ex-Peerless organic growth comment, Peerless revenue could be around £140–145m. At 50% margin, it could be ~43% of Controls adjusted EBIT in H1.
Controls margin has gone from 26% in FY24 to 30% in FY25 to 33.5% in H1 FY26. But ex-Peerless Controls is probably still a very good mid-20s margin business.
Management said the current Peerless margin should moderate over time, but settle structurally above where it was acquired.
Seals was okay, not great. Revenue was down 1% reported but 2% organic. North America continues to do well, but International Seals is still soft, although exit rates are improving. Adjusted EBIT margins were stable YoY.
Reported Seals EBIT looked ugly, but that was mostly an adjustment/base effect from last year’s disposal gain. Underlying profitability was broadly stable.
Life Sciences was fine. Revenue 18% reported, 4% organic, margin broadly stable. Not the reason for the upgrade, but not a problem either.
On M&A, Diploma is back in deployment mode.
The company talks about 15 deals in the LTM for c.£310m at an average 8x multiple, but this includes CDM, which is the largest one and has not closed yet.
The six acquisitions actually completed in H1 had gross cash/deferred consideration of ~£90m, but after deducting cash acquired, the EV / total investment number was £84.6m.
They had pro-forma H1 revenue of £30m and pro-forma H1 adjusted operating profit of £7m. Doubling that gives ~£60m revenue and ~£14m EBIT, implying roughly 1.4x sales / 6.0x EV/EBIT.
That is very attractive versus Diploma’s own multiple of ~24x TTM EV/EBIT. So the arb gap continues.
CDM is the more meaningful deal. It is a c.$80m revenue US interconnect / defence business being acquired for c.$170m. If CDM is a high-teens margin business, the acquisition is probably around low-double-digit EV/EBIT — still well below Diploma’s own trading multiple.
On EBIT, I prefer my own definition rather than the company’s. Diploma’s adjusted operating profit adds back all acquisition-related expenses. I add back amortisation of acquired intangibles, but not acquisition expenses.
On that basis, H1 EBIT is £198m, up 30% YoY after excluding last year’s disposal gain from the base.
Adjusted PAT is £129m, up 27% YoY. Adjusted EPS was 95p, up 27% YoY.
On FCF, I also use my own definition:
CFO – capex – deferred consideration paid – principal lease payments PPE sale proceeds
On that basis, FCF was £101m, up 25% YoY.
Valuation: the stock has done super well over the last year and is up ~40% over one year.
At around £67.4/share, TTM adjusted EPS is ~193p on my definition, adding back amortisation of intangibles but not acquisition expenses.
So the stock is around 35x TTM adjusted EPS.
My summary:
Diploma delivered an excellent H1. Controls is compounding strongly, the acquisition engine is working again, the balance sheet is underlevered, and the company continues to buy assets at materially lower multiples than its own trading multiple.
Great business, great result. Has the valuation caught up?
1
2
145
May 14
Thoughts from $CSU call:
Private SaaS valuations still haven’t reset. Bernie: “There’s a real disconnect between the ‘SaaSpocalypse’ publicly traded stuff and private markets.” High end maybe plateauing a bit.
Feels like private sellers are still anchored / in denial mode — and that likely explains why CSU is leaning more into PEMS.
Jamal also called CSU “a great buying opportunity” (his personal view). Would’ve hit harder if OG Leonard said it 😄
May 13
Constellation Software (CSU) Q1’26 deep dive 👇
$CSU $CSU.TO
IMPORTANT FRAMING (because CSU consolidates TOI LMN)
CSU consolidates 100% of both Topicus and Lumine (control via super voting). So CSU’s reported revenue / opex / cash / M&A includes TOI LMN fully, and economics are then split via NCI (and FCFA2S deducts NCI).
1) Growth: strong headline; “maintenance organic” is the clean signal
Revenue grew 20% YoY to $3,181m. Organic growth was 6% (or 2% FX-adjusted).
Cleanest read is maintenance & other recurring:
Maintenance 22% YoY and 9% organic (FX-adjusted 4%).
Licenses were -9% organic and hardware slightly negative organically, so don’t over-read those.
2) M&A: remember LMN TOI are inside CSU’s numbers
Total consideration for acquisitions in Q1 was $809m (cash at close $697m):
- Synchronoss (inside Lumine): total consideration $309m (contributed $22m revenue and ~$(2)m net loss in the partial quarter)
- “Additional acquisitions”: total consideration $500m = cash $388m holdbacks $91m contingent $21m
Cash flow bridge (to reconcile optics):
Cash paid at close was $697m, and then there was another ~$69m of post-acq settlement / holdback payments → “cash used in acquisitions” shows up as $766m.
CSU also acquired $77m of cash with the businesses.
Standalone CSU deployment (“ex TOI LMN” lens):
Topicus did €22.5m of total consideration in Q1 (~$25–26m), so standalone CSU consideration is roughly:
$809m – $309m – ~$26m ≈ ~$473m in Q1’26 (similar to Q4’25). TTM standalone consideration is ~ ~$1.5b → CSU is still chugging along on acquisitions.
Bonus: post-quarter pipeline
Subsequent to Mar 31, CSU completed / committed to $786m of acquisitions (cash $627m deferred $159m).
3) Operating leverage: roughly steady (Q1 staff is seasonally optically heavy)
Expenses grew 21% vs revenue 20% (expense ratio 75% → 76%).
Staff grew 19% YoY. CSU reminds Q1 staff % is seasonally higher due to payroll taxes tied to annual bonus payments in March.
Lumine had acquisition-related costs this quarter (not quantified at CSU level), so some staff-line noise is possible.
4) Below EBIT: lots of noise (don’t anchor on EPS without context)
- FX swung hard: $45m gain vs -$32m loss last year.
- IRGA liability revaluation swung from a $94m charge last year to a -$76m gain this year (non-cash).
Important nuance: the IRGA liability fell mainly because Topicus’ listed stakes (Asseco Sygnity) were lower, offset by Topicus’ trailing maintenance/recurring growth net profits.
- Asseco now shows up via equity-method income (~$10–11m this quarter, lagged).
- Finance costs were higher due to higher average debt outstanding.
5) Cash: CFO 9%;
my FCFAA math
My FCFAA variant: start from CFO, subtract interest/leases/capex, add acquired cash, deduct post-acq settlement cash.
In Q1’26:
CFO 897
less interest / leases / capex: 111
cash obtained from businesses: 77
– post-acq settlement payments: 69
FCFAA: ~795m in Q1 (up ~11% YoY)
On TTM basis (my calc):
OCF: 2,807m
less interest / leases / capex: 377m
FCF: 2,430m
cash obtained from businesses: 239m
– post-acq settlement payments: 339m
FCFAA: ~2,330m TTM
(Note: this includes 100% of Topicus Lumine, so be careful with valuation.)
6) Balance sheet / dry powder
Cash ~$3.01bn and total debt ~$3.99bn → net debt ~$0.98bn (ex leases).
Lease obligations are ~0.44bn → “incl leases” net debt ~1.44bn (~0.4x net debt / TTM EBITDA).
CSI Facility is $1.085bn and was undrawn at quarter-end (only ~$13m letters of credit).
Net-net: good organic (especially maintenance), steady M&A machine, and strong Q1 cash generation.
1
3
1,974
May 14
Samsonite Q1'26 Earnings Deep Dive
#Samsonite $1910 $1910.hk
Bottom line: this was not a sales collapse, but it was clearly a poor margin quarter.
Reported sales looked fine because FX helped. Underlying constant-currency growth was barely positive. EBITDA got hit by marketing, store investments, freight/inflation and weaker operating leverage.
The real debate is whether Q1 was the low point for margins and FY26 keeps recovering, or whether Samsonite now needs higher spending just to sustain low-single-digit growth.
1. Sales: reported growth was okay, underlying growth was weak
Samsonite reported Q1 revenue of $829.1m, up 4.1% reported but only 0.4% constant currency. Excluding Middle East and India, which management says were the markets most affected by the Middle East conflict, sales grew 1.6% cc. So the underlying business was better than headline cc growth, but still not exciting.
Asia, 38% of sales, grew 3.0% reported and 1.3% cc. Ex Middle East and India, Asia sales were 5.1% cc.
North America, 31% of sales, remained negative at -1.4% reported and -1.7% cc, though improved sequentially versus Q4. The U.S. was hurt by inventory reductions at a key wholesale e-retailer. Excluding wholesale e-retailers, North America would have grown 5.3% cc, so the U.S. is a little less bad than the headline. That said, TUMI's U.S. traffic weakness remains a real issue.
Europe, 24% of sales, had a big FX tailwind and grew 11.3% reported but only 0.8% cc. LatAm rebounded strongly at 13.5% reported and 4.7% cc, helped by Mexico.
2. Brands, products and channels: lifestyle bags and e-commerce did better
Samsonite, 52% of sales, was the best of the core brands on a reported basis: 5.8% reported, but only 1.3% cc. TUMI, 23% of sales, grew 2.7% reported and 0.5% cc. This was TUMI's third consecutive quarter of positive cc growth, but North America was weak due to softer U.S. retail traffic and a planned reduction in wholesale sales to off-price retailers.
American Tourister, 16% of sales, grew 1.1% reported but declined -1.6% cc, impacted by Middle East and India. Ex Middle East and India, American Tourister grew 3.9% cc.
Product-wise, travel luggage declined -2.0% cc, while lifestyle bags grew 4.8% cc. Lifestyle bags moved from 36.0% of sales in Q1'25 to 37.6% in Q1'26. So the growth driver right now is not core travel luggage; it is lifestyle bags.
Channel-wise, wholesale is still 60% of sales and declined -1.9% cc. DTC grew 4.2% cc and e-commerce grew 11.3% cc, making it the strongest channel by far. DTC mix moved from 38% to 40% YoY. Retail grew 1.4% cc, helped by 11 net new company-operated stores, but same-store sales were down -1.5% cc due to lower store traffic. So the DTC story is more e-commerce-led than store-comp-led.
3. Gross margin was fine; opex was the problem
Gross profit was $489m, up 3.4% YoY, while gross margin declined only 40 bps from 59.4% to 59.0%. I would not read too much into this. Management sounded comfortable and said 59% is roughly the low watermark, with improvement expected through the year.
The bigger issue was opex.
Distribution expenses were 34.3% of sales versus 32.2% last year, up 210 bps, driven by inflation, selective new store openings and higher outbound freight. Marketing rose to 5.7% of sales, up 40 bps, as management intentionally stepped up brand investment. G&A was controlled, down 20 bps to 7.5% of sales.
This is the quarter in one line: gross profit grew $15.9m, but distribution marketing G&A rose by roughly $34m. So operating profit fell $18m.
EBIT was $91m, down 17% YoY. Adjusted EBITDA fell from $127.6m to $109.0m, down 14.6%, and margin fell from 16.0% to 13.1%.
Management says Q2 will be the peak marketing quarter at about 8% of sales, and FY26 marketing should be about 6.5% of sales. So Q2 margin recovery may be modest; the real recovery has to come in H2 through seasonality, better sales growth, cost mitigation and operating leverage.
4. Net income, cash flow and capital allocation
Below EBIT, net finance cost was $31m versus $30m last year. Q1 adjusted effective tax rate was also higher at roughly 36% versus 30% last year.
Adjusted net income fell from $52.0m to $36.5m, down ~30%. Adjusted diluted EPS fell from $0.037 to $0.026, down ~29%-30%.
Balance sheet was fine. Cash was $670m, financial debt was around $1.7bn, net debt was $1.07bn and net leverage was 1.79x.
Cash flow was much better than the P&L. Operating cash flow was $85.4m versus only $8.5m last year. Adjusted free cash flow was $27m versus -$41m last year, mainly because working capital was much better.
Capital allocation: $140m dividend, roughly half of FY25 adjusted PAT, which works out to about US$0.10/share or HK$0.78/share, plus a new $50m buyback (wow quite a lot huh)
5. Guidance and FY26 math
Management expects low-single-digit constant-currency sales growth in FY26. Q2 growth should be approximately similar to Q1, so still roughly flat / low-single-digit rather than a sharp acceleration. They expect gross margin to remain strong, FY26 marketing to be around 6.5% of sales, Q2 marketing to be around 8% of sales, and adjusted EBITDA margin to improve through the year from Q1's 13.1%.
The implicit message: Q1 was weak on margins. Q2 will still have heavy marketing spend. H2 has to do the heavy lifting.
Where do we go from here?
Assuming 3% sales growth, FY26 revenue should be around $3.6bn. EBITDA margin will likely decline versus 17.3% in FY25. If FY26 EBITDA margin comes in around 16%, that gives roughly $575m of adjusted EBITDA.
Taking away around $70m of depreciation and around $10m of SBC / other adjustments gives adjusted EBIT of roughly $495-500m. Net finance cost of $125-130m gives PBT of roughly $365-370m. Assuming a normalized tax rate, adjusted PAT should be around $270m.
That gives adjusted EPS of roughly $0.195, or around HK$1.52/share. At a CMP of ~HK$14, that is roughly 9.2x FY26E earnings.
On our numbers, FY26 adjusted PAT would be down ~8% YoY versus FY25 adjusted PAT of ~$293m. Adjusted EPS would be down ~7% YoY, helped slightly by the $50m buyback.
On EV/EBITDA, the stock is around ~6x FY26E adjusted EBITDA. So the stock is cheap, but cheap for a reason: low underlying sales growth, wholesale softness, travel category decline, and the risk that higher marketing / DTC spend is now needed just to sustain low-single-digit growth.
6. Dual listing update was that there was no update.
Still planning to do it in FY26.
Final view
This was not a top-line collapse. Ex Middle East and India, growth was positive. DTC / e-commerce and lifestyle bags are working. Balance sheet and cash flow remain healthy.
But the quality of earnings was not ideal.
Sales growth was barely positive in constant currency, wholesale is still weak, travel declined, and EBITDA margin compressed sharply.
At ~6x EV/EBITDA and ~9x earnings, valuation is already pricing in a lot of disappointment, rightly so.
2
164
May 13
Constellation Software (CSU) Q1’26 deep dive 👇
$CSU $CSU.TO
IMPORTANT FRAMING (because CSU consolidates TOI LMN)
CSU consolidates 100% of both Topicus and Lumine (control via super voting). So CSU’s reported revenue / opex / cash / M&A includes TOI LMN fully, and economics are then split via NCI (and FCFA2S deducts NCI).
1) Growth: strong headline; “maintenance organic” is the clean signal
Revenue grew 20% YoY to $3,181m. Organic growth was 6% (or 2% FX-adjusted).
Cleanest read is maintenance & other recurring:
Maintenance 22% YoY and 9% organic (FX-adjusted 4%).
Licenses were -9% organic and hardware slightly negative organically, so don’t over-read those.
2) M&A: remember LMN TOI are inside CSU’s numbers
Total consideration for acquisitions in Q1 was $809m (cash at close $697m):
- Synchronoss (inside Lumine): total consideration $309m (contributed $22m revenue and ~$(2)m net loss in the partial quarter)
- “Additional acquisitions”: total consideration $500m = cash $388m holdbacks $91m contingent $21m
Cash flow bridge (to reconcile optics):
Cash paid at close was $697m, and then there was another ~$69m of post-acq settlement / holdback payments → “cash used in acquisitions” shows up as $766m.
CSU also acquired $77m of cash with the businesses.
Standalone CSU deployment (“ex TOI LMN” lens):
Topicus did €22.5m of total consideration in Q1 (~$25–26m), so standalone CSU consideration is roughly:
$809m – $309m – ~$26m ≈ ~$473m in Q1’26 (similar to Q4’25). TTM standalone consideration is ~ ~$1.5b → CSU is still chugging along on acquisitions.
Bonus: post-quarter pipeline
Subsequent to Mar 31, CSU completed / committed to $786m of acquisitions (cash $627m deferred $159m).
3) Operating leverage: roughly steady (Q1 staff is seasonally optically heavy)
Expenses grew 21% vs revenue 20% (expense ratio 75% → 76%).
Staff grew 19% YoY. CSU reminds Q1 staff % is seasonally higher due to payroll taxes tied to annual bonus payments in March.
Lumine had acquisition-related costs this quarter (not quantified at CSU level), so some staff-line noise is possible.
4) Below EBIT: lots of noise (don’t anchor on EPS without context)
- FX swung hard: $45m gain vs -$32m loss last year.
- IRGA liability revaluation swung from a $94m charge last year to a -$76m gain this year (non-cash).
Important nuance: the IRGA liability fell mainly because Topicus’ listed stakes (Asseco Sygnity) were lower, offset by Topicus’ trailing maintenance/recurring growth net profits.
- Asseco now shows up via equity-method income (~$10–11m this quarter, lagged).
- Finance costs were higher due to higher average debt outstanding.
5) Cash: CFO 9%;
my FCFAA math
My FCFAA variant: start from CFO, subtract interest/leases/capex, add acquired cash, deduct post-acq settlement cash.
In Q1’26:
CFO 897
less interest / leases / capex: 111
cash obtained from businesses: 77
– post-acq settlement payments: 69
FCFAA: ~795m in Q1 (up ~11% YoY)
On TTM basis (my calc):
OCF: 2,807m
less interest / leases / capex: 377m
FCF: 2,430m
cash obtained from businesses: 239m
– post-acq settlement payments: 339m
FCFAA: ~2,330m TTM
(Note: this includes 100% of Topicus Lumine, so be careful with valuation.)
6) Balance sheet / dry powder
Cash ~$3.01bn and total debt ~$3.99bn → net debt ~$0.98bn (ex leases).
Lease obligations are ~0.44bn → “incl leases” net debt ~1.44bn (~0.4x net debt / TTM EBITDA).
CSI Facility is $1.085bn and was undrawn at quarter-end (only ~$13m letters of credit).
Net-net: good organic (especially maintenance), steady M&A machine, and strong Q1 cash generation.
5
36
7,574
May 13
On Holding Q1’26 Deep Dive 👇
$ONON
On delivered a pretty good quarter.
Revenue grew 26% ex-FX but the bigger surprise was profitability: gross margin expanded to 64.2% and adjusted EBITDA margin hit 21.0%, despite tariff headwinds and continued brand investments. Full-year revenue guidance was maintained, but margin guidance was raised materially.
1) Overall growth: strong, broad-based, but FX masked the reported number.
Net sales were CHF 832m, up 14% reported and 26% constant currency.
FX ate almost 12ppt of growth, especially in the Americas. CHF/USD averaged ~1.28 in Q1’26 versus ~1.11 in Q1’25, implying the CHF strengthened by ~15%. Given the Americas were ~54% of Q1 sales, that alone explains most of the reported-vs-constant-currency gap.
CHF also strengthened against the EUR and RMB, with average rates up ~3% and ~9%, respectively. At current spot rates, I estimate the Q2 FX headwind should still be ~5ppt, but should reduce to ~2–3ppt in H2’26.
So the reported growth number looks optically muted, but the 26% ex-FX growth tells you underlying demand remains strong across regions, channels and product categories.
2) Channel: DTC continues to grow faster, but wholesale is still very strong. DTC grew faster at 16% reported / 29% ex-FX, while wholesale grew 13% reported / 25% ex-FX.
On a TTM basis, DTC is now ~42% of sales. The DTC proportion is seasonal, and was ~39% of sales in Q1’26 versus ~38% in Q1’25. Management reiterated its goal of increasing DTC mix by 100–200 bps per year.
Wholesale is still very healthy. Management said they are deliberately embedding slower wholesale growth later in the year because they want clean inventory at wholesale partners.
3) Region-wise: APAC is becoming material now
Americas revenue was CHF 450.7m, up only 3.1% reported, but 17.1% constant currency. The huge FX gap reconciles with the USD weakening versus CHF. Awareness in the US crossed 30% for the first time, and management also called out younger and more female consumers entering the brand.
EMEA was CHF 207.1m, up 23% reported and 25.6% ex-FX. Germany stayed healthy, and the UK saw strong momentum.
APAC was the standout, though it is no longer doubling like it was a few quarters ago. Sales were CHF 174.0m, up 44% reported and 61.4% constant currency, and APAC is now more than 20% of global sales in Q1’26. Greater China grew above the regional average, while South Korea more than tripled YoY, though that is likely off a very low base.
4) Product categories: still footwear-led
Shoes are still the core: CHF 763.7m, up 24.0% constant currency, and ~92% of revenue.
Apparel remains small but grew 45% reported and 57.5% constant currency. More importantly, apparel is starting to become a real entry point into the brand, especially through DTC.
LightSpray also seems to be moving from innovation theatre to actual commercial product. The LightSpray Cloudmonster Hyper sold out quickly across several channels, and management said they are already selling several hundred pairs a day through DTC. This matters because On needs differentiated, premium-priced product innovation to justify its brand positioning.
5) Gross margin: this was the biggest positive surprise
Gross margin expanded from 59.9% to 64.2%, up 430 bps YoY. This is a huge move for a company already positioned as premium.
On’s gross margin is now moving into luxury-like territory, rather than looking like a typical sportswear peer.
Management attributed the gross margin expansion to three things:
Around 250 bps from supply-side actions, 150 bps from full-price selling, ~100 bps FX tailwind, likely helped by sourcing/import contracts being dollar-linked while On reports in CHF.
This was partly offset by around 100 bps tariff headwind.
This was not just a one-off FX/freight benefit. COGS grew only ~2% YoY while gross profit grew ~23% YoY. Management explicitly said this new gross margin level is not a one-time peak and now sees 64.5% gross margin as the full-year baseline.
6) Operating profit: strong leverage, but they are still reinvesting
Opex grew 16% YoY. But distribution expenses, selling expenses and G&A combined grew only ~9% YoY, so there was clear operating leverage.
Marketing grew 35% YoY to 13.1% of sales. Management guided marketing to remain around 13.0–13.5% of sales for the full year. Their framing is simple: awareness has increased, traffic is stronger than revenue growth, and they now need to convert that awareness into premium customers.
SBC grew 46% YoY, but this item keeps fluctuating QoQ. On a TTM basis, SBC was ~CHF 69m, broadly the same as the TTM ending Q1’25.
EBIT was CHF 117.5m, up 53% YoY. Adjusted EBITDA was CHF 174m, up 45.5% YoY, with margin at 21.0%, versus 16.5% last year.
7) Cash flow and balance sheet: clean enough
Operating cash flow was CHF 29.1m versus an outflow of CHF 12.1m last year.
Working capital was still a drag, mostly because receivables increased, but inventory was actually a source of cash in the quarter. Inventories were CHF 406.0m, down from CHF 419.8m at year-end. Cash remained above CHF 1bn.
Inventory days were ~123 days, same as Q1’25, broadly in line with recent quarters and lower than the long-term history.
For a premium footwear/apparel company, inventory is usually where problems show up first. Here, inventory looks under control despite 20% constant-currency growth.
8) Guidance: revenue maintained, margins raised
On maintained full-year guidance for at least 23% constant-currency revenue growth, implying reported net sales of at least CHF 3.51bn at current spot rates. They still expect DTC, APAC and apparel to outperform.
So Q2–Q4 reported revenue growth embedded in guidance is ~17% (~21–22% ex-FX growth minus ~4–5ppt FX headwind)
Gross margin guidance moved to at least 64.5%, and adjusted EBITDA margin guidance moved to 19.5–20.0%.
9) TTM valuation
On a TTM basis, EBIT is roughly CHF 418m. Interest expense is largely offset by financial income. I am ignoring the volatile non-cash FX/finance line, so PBT is roughly CHF 417m.
Accounting taxes are optically low/volatile, so using cash taxes paid of around CHF 68m on a TTM basis seems more sensible. That gives PAT of roughly CHF 350m, or around $450m, which works out to about $1.34 EPS on A-share-equivalent fully diluted shares.
At $33.8, the stock trades at roughly 25x TTM earnings.
Now let’s estimate FY26 EPS.
At CHF 3.51bn of sales and 19.5% adjusted EBITDA margin, FY26 adjusted EBITDA should be around CHF 683m.
Remove roughly CHF 150m of D&A and CHF 70m of SBC, and EBIT should be around CHF 463m. Let’s call it CHF 460m PBT, excluding all the volatile non-cash FX noise.
Assuming a 16% tax rate, PAT would be roughly CHF 386m.
At ~1.28 CHF/USD, that is around $495m of earnings. On A-share-equivalent fully diluted shares, that works out to roughly $1.45 EPS.
At $33.8, the stock is trading at around 23x FY26 EPS.
For a business that is still growing 20% organically, running 60% gross margins, expanding DTC/APAC/apparel, and still has a long runway in sneakers/lifestyle, that does not look expensive.
10) What the market may worry about
The obvious pushback is: why not raise revenue guidance after such a strong Q1?
I think there are three reasons.
First, management is being careful with wholesale inventory and not over-shipping into the channel.
Second, the macro is still uncertain.
Third, there is a leadership transition, with the founders stepping in as co-CEOs, Martin moving to advisor, and Frank Sluis joining as CFO.
But I think the key message is that they are not chasing growth at any cost. For On, protecting full-price selling, premium positioning and clean distribution matters more than squeezing out a few extra points of near-term wholesale growth.
1
489
May 6
Lumine Group Q1’26 deep dive 👇
$LMN $LMN.V
1) Growth: headline organic looked weak, but the core recurring line was fine.
Revenue grew 17% YoY to $208.3m. Headline organic was 0% (or -2% FX-adjusted), but that gets distorted by the noisier buckets (licenses/hardware).
Cleaner read: maintenance & other recurring (highest-quality bucket) posted 6% organic (~ 3% FX-adjusted) and was 27% reported on acquisition contribution. Recurring base is still growing; weakness was more in the lumpy lines/timing.
Of the $29.6m YoY revenue uplift in Q1, ~$22m came from Synchronoss post-close. The remaining ~$7–8m uplift is mostly carryover from FY25 acquisitions (Vidispine Datafusion) rather than true organic — my estimate is ~$8–9m combined.
2) M&A:
Synchronoss closed Feb 13, 2026.
Cash consideration paid: $309.3m
Cash acquired: $34.3m → net cash paid ≈ $275m
Synchronoss contributed $22.0m of revenue in Q1 and would have contributed ~$20m more if owned from Jan 1.
Implied pro-forma Q1 revenue ≈ $42.4m, annualized ~$170m (lines up with Synchronoss’ last run-rate/guidance range $169–$172m).
So the cash multiple ≈ 1.62× sales. Versus Lumine trading around ~5× P/S, you’re seeing the platform buy at ~1.6× and trade at ~5× — that “arb gap” is the point.
Synchronoss was funded via cash on hand a $160m draw on the Lumine Facility; bank debt rose to ~$372m while cash fell to ~$248m, putting LMN at ~$124m net debt (ex leases) vs ~$140m net cash at Q4’25. Even post-deal, that’s still low net leverage (~0.5× net debt / EBITDA), leaving meaningful balance sheet capacity for further acquisitions.
3) Operating income = EBITA; margin compressed
Lumine’s “Operating income” is effectively EBITA (net income before tax, amort, bargain items, and finance/other).
EBITA was $57.9m vs $59.5m (-3%), but costs rose faster than sales: expenses 26% vs revenue 17% → expense ratio 67% → 72%.
Staff was the big line: staff 37% YoY. They disclosed $2.755m of Synchronoss transaction costs in staff/pro fees — but even adding that back, staff growth still looks too fast, suggesting other integration/roll-in costs not separately itemized (or a true step-up in the cost base).
4) Cash optics: CFO / FCFA2S collapsed (mostly WC taxes)
CFO: $19.8m vs $40.1m
FCFA2S: $15.3m vs $35.0m
CFO drop was mainly to (i) worse working capital (~$14.5m) and (ii) higher cash taxes paid (~$4.4m).
Working capital drag was largely payables receivables timing. A reasonable explanation (not explicitly stated) is post-acquisition cleanup — settling vendor/professional fee accruals and other payables around Synchronoss, plus normal billing/collection timing — which would show up as payables down / receivables up and hit CFO in Q1. Q2 will be the check on whether this mean-reverts.
1
4
41
4,004
May 6
Topicus Q1’26 deep dive 👇
$TOI $TOI.V
1) Growth: 23% headline with healthy organic
Revenue grew 23% YoY to €435.7m. 5% was organic, implying ~17–18ppt came from acquisition contribution over the last ~4 quarters. 5% organic is strong for a VMS roll-up.
Key quality signal: maintenance & other recurring (70% of revenue) delivered ~7% organic, 1ppt vs Q4’25 (6%). This is the line to track; licenses/hardware are noisy.
2) M&A: quiet quarter (normal for serial acquirers)
Q1 acquisitions were light: ~€22.5m total consideration (~€15m cash).
Biggest deal in the last 4 quarters was Cipal (closed Jun 2, 2025). My estimate: Cipal has been contributing ~6–8% to reported revenue growth. That boost laps from Q3’26 onward (Q3’25 was the first full quarter with Cipal), so reported growth could mechanically step down ~6–8ppt if new deals don’t refill the base.
Q2’26 still benefits (Q2’25 had only ~1 month of Cipal).
Q3’26 is the clean “lap” quarter.
3) Operating leverage: opex grew slower than revenue
Opex grew ~20% YoY, slower than revenue (~23%) → expense ratio improved. Staff cost (largest line) grew ~20%; amort of acquired intangibles also rose ~20% (bigger acquired base).
Net: EBITA-like profit (rev – opex, pre-amort) grew ~32% YoY.
4) Below EBIT: multiple items need normalization
Interest expense higher YoY (higher average debt: acquisitions Asseco financing). QoQ decline mainly reflects revolver paydown (not necessarily a “slow M&A” signal).
~€9m income from Asseco (one-quarter lag) supports reported FY26 PAT.
Prior-year one-off: €32.8m day-1 gain on initial Asseco stake in Q1’25.
Derivative MTM: €4.6m in Q1’25 vs -€5.5m in Q1’26 — PAT headwind YoY, no cash impact.
5) Adjusted earnings
On my adjusted view (tax-effecting amort removing below-EBIT noise), Adj PAT/EPS ~55% YoY, or ~39% YoY excluding Asseco income. That ~39% is basically ~32% EBITA-like growth tax/timing.
6) Cash: FCFAA / FCFA2S
Q1 is structurally Topicus’ biggest cash quarter (annual maintenance billing upfront).
CFO was €280.5m, ~3% YoY, mainly because working-capital contribution was lower than last year. WC can swing meaningfully quarter to quarter due to timing (billing/collections/payments), and Topicus doesn’t provide more granular color (no calls / limited disclosure).
Despite strong Q1 cash generation, Topicus used a large chunk to de-risk:
Net decrease in revolver: €245.0m in Q1’26.
2
26
2,677
May 1
Unlike Visa and AmEx, Mastercard did not show acceleration in reported U.S. GDV growth. But this was distorted by the Capital One debit migration. Excluding that, U.S. debit GDV would have grown 7% in Q1 versus 1% reported, while U.S. credit accelerated to 8%. So on an ex-CapOne basis, Mastercard’s U.S. growth likely accelerated as well, broadly consistent with the spend trends seen at Visa and AmEx.
$MA $V $AXP
1
98
May 1
“This quarter, we accelerated the pace of our share buybacks given current valuation levels and our strong conviction in our long-term growth potential.”
Rare to hear a business of this quality explicitly cite valuation as a buyback rationale. $MA
May 1
Mastercard $MA Q1 FY26 Earnings Deep Dive 👇
Strong quarter. Net revenue grew 16% YoY to $8.4bn, or 12% currency-neutral, while adj EPS grew 23% YoY to $4.60. Underlying spend was healthy, VAS continued to scale, and the company delivered strong operating leverage.
Starting with volumes: total GDV grew 12% reported / 7% ex-FX, with U.S. GDV up 4% and ex-U.S. up 15% reported / 8.6% ex-FX. Purchase volume grew 13% reported / 9% ex-FX, while cross-border volume grew 21% reported / 13% ex-FX.
The U.S. number needs context. Mastercard’s U.S. credit GDV grew 8%, but debit grew only 1% because of the Capital One debit portfolio migration from Mastercard to Discover. Excluding that, U.S. debit GDV would have grown 7%. So the softer U.S. GDV growth versus Visa was not really a broad consumer-spend issue.
This also explains part of the Visa vs Mastercard gap. Visa’s U.S. payments volume grew 8%, with credit up 10% and debit up 7%. Mastercard’s U.S. credit was not far behind at 8%, but its reported debit growth was depressed by the Capital One migration.
Now connecting volumes to revenues: domestic assessments grew 9% reported and cross-border assessments grew 23% reported. On a combined basis, these two lines grew around 16%, versus total GDV growth of 12%. That implies a mix benefit, as higher-yielding cross-border grew meaningfully faster, plus some pricing/yield benefit in international markets.
Processing was also strong. Switched transactions grew 9% to 43.8bn, but transaction processing assessments grew 20% to $4.2bn. That implies processing revenue per switched transaction was up meaningfully, helped by pricing and favourable mix, partly offset by lower FX volatility. Similar dynamics to Visa.
VAS is cleaner for Mastercard than Visa because it is reported separately. Value-added services and solutions revenue grew 22% reported / 18% cc to $3.45bn, now ~41% of total net revenue. Growth was driven by security solutions, digital/authentication, business and market insights, consumer acquisition/engagement services and pricing.
The big offset was rebates and incentives, and that is not unusual for Mastercard. Payment Network rebates and incentives grew 23% reported / 19% cc to $5.64bn, faster than the main gross network revenue lines, due to higher key drivers plus new and renewed deals.
This is the key difference versus Visa this quarter. Visa’s net revenue growth was helped by incentives growing slower than gross revenue because of timing/performance adjustments. Mastercard had the opposite dynamic: rebates grew faster than gross network revenues, so Payment Network net revenue grew only 12% reported / 8% cc despite strong gross assessment growth.
Add VAS, and total net revenue grew 16% reported / 12% cc to $8.4bn.
GAAP OpEx grew 13%, but this included a $202mn restructuring charge from a strategic review. Mastercard says the savings are intended to fund reinvestment into long-term growth opportunities. Since this was a one-time restructuring charge, I would adjust for it, but still mention it clearly.
Adjusted OpEx grew 11% reported / 9% cc to $3.29bn, mainly due to investments in infrastructure, geographic expansion, products/services and FX-related expenses.
Adjusted EBIT grew 19% reported / 13% cc to $5.1bn, with adjusted EBIT margin expanding 150bps to 60.8%. On a GAAP basis, after the restructuring charge, EBIT was $4.9bn and margin was 58.4%.
Below EBIT, adjusted other expense was only $28mn versus $89mn last year, helped by government grants. Adjusted PBT was roughly $5.1bn, adjusted PAT grew 20% to $4.1bn, and adjusted EPS grew 23% to $4.60, helped by buybacks.
FCF was solid at roughly $2.7bn, with $3.0bn of operating cash flow and $335mn of capex/capitalized software. Mastercard also returned a lot of capital: $4.0bn of buybacks and $777mn of dividends in Q1, plus another $1.7bn of buybacks through April 27.
Guidance: For FY26, Mastercard marginally raised reported revenue guidance while keeping currency-neutral revenue and OpEx guidance broadly unchanged. Reported net revenue growth is now expected at the high end of low-double-digits to low-teens, helped by FX, while currency-neutral growth remains at the high end of low-double-digits. Adjusted OpEx is expected to grow low-double-digits, and the non-GAAP tax rate should be 20–21%.
Q2 is expected to be softer, with revenue growth at the low end of low-double-digits on a currency-neutral ex-inorganic basis, mainly because of Middle East-related cross-border travel headwinds. Management said that excluding this conflict impact, Q2 growth would have been broadly in line with Q1.
Valuation: At around 25x forward EPS, Mastercard is not optically cheap, but it still trades significantly below its own recent history.
141