
📊 Statistician || 📈 Data Analytics || 👨💻 Building, learning & sharing || 🔥Lover of Christ ✝️ || Chess ♟️
Joined July 2024
- Tweets 1,554
- Following 194
- Followers 145
- Likes 3,231
129 Photos and videos


Pinned Tweet

May 3
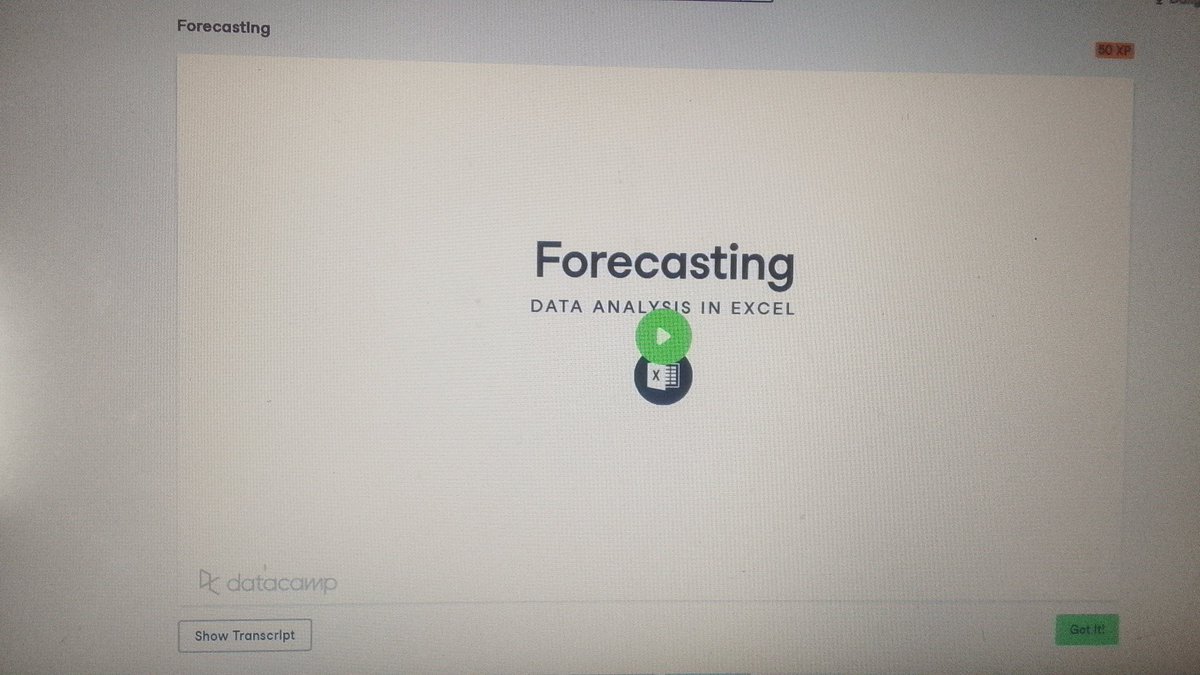
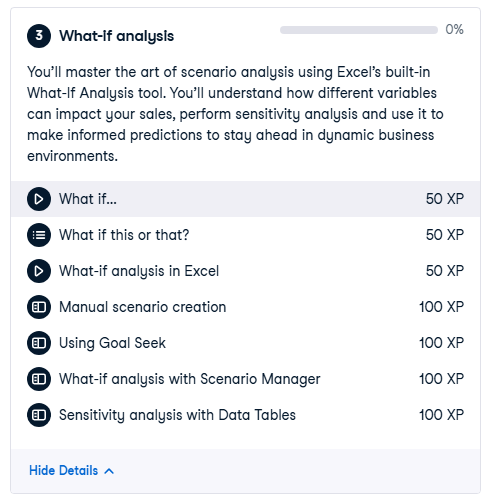
From learning Excel… to actually using it for analysis 📊
Completed the Data Analysis in Excel course on DataCamp.
Worked with:
• Pivot Tables
• Logical Functions
• What-If Analysis
• Forecasting
But the real shift:
Not just how tools work…
But when and why to use them.
4
1
25
605
Dev Prince 📊 retweeted
May 11
Why do most data people reach for Python over R? 📊
R was literally built for statistical computing.
Vectorized operations come out of the box.
In Python, you reach for NumPy first.
And before someone says “libraries”…
R has a rich ecosystem too.
So what made Python win?
1
1
32


May 29
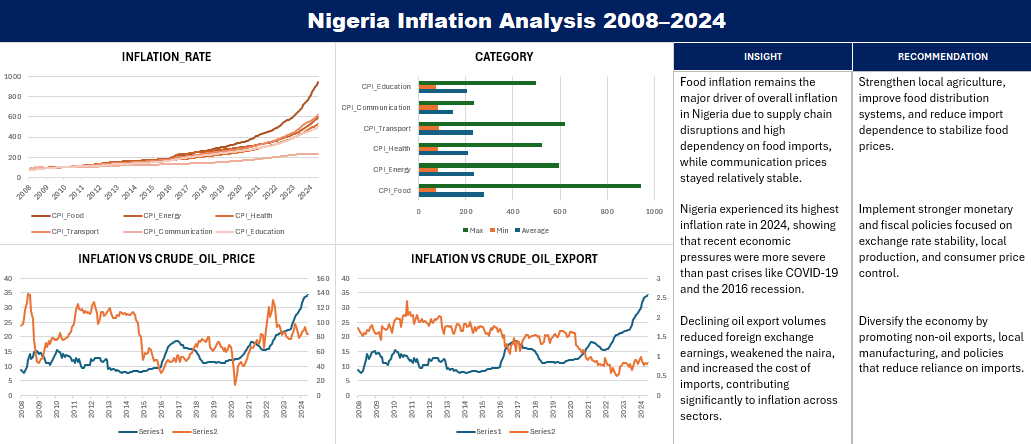
If food drives inflation the most…
then is Nigeria’s inflation problem really monetary
or structural? 🤔
May 29

Contrary to popular opinion 📊
The data suggests crude oil price alone may not strongly explain Nigeria’s inflation trend.
But crude oil exports show a clearer relationship.
Around 2020, exports declined while inflation started peaking.
#dataanalysis
1
57
May 29
Contrary to popular opinion 📊
The data suggests crude oil price alone may not strongly explain Nigeria’s inflation trend.
But crude oil exports show a clearer relationship.
Around 2020, exports declined while inflation started peaking.
#dataanalysis
1
4
87
May 29
Another strong signal:
Food inflation drove most of the pressure, while communication remained relatively stable.
3
19
May 12
Chess feels like a growing tree ♟️🌳
Every move creates more possibilities.
The middle game becomes chaos.
Then pieces disappear…
and the tree starts shrinking.
Until only one path remains:
Checkmate.
1
44
May 12
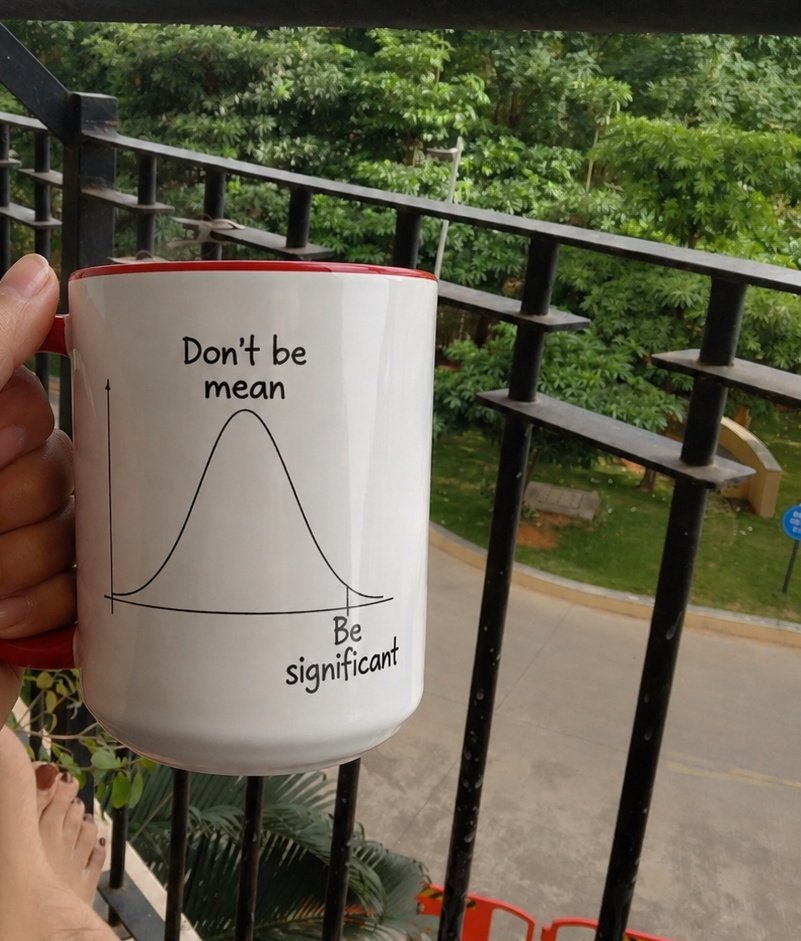
Life is full of differences 📊
Different people. Different outcomes. Different groups.
But statistics asks a deeper question:
Are those differences truly significant…
or just random chance?
That’s the idea behind ANOVA and the F-test.

1
1
25

Dev Prince 📊 retweeted

May 12
You’ve made it through days you thought you wouldn’t.
Don’t forget that when things feel heavy again.
GM, especially to those who say it back👀
4
2
12
88
Dev Prince 📊 retweeted

May 11
Data Analytics X has some of the most disciplined learners I’ve seen
People spending hours learning SQL, fixing dashboards, cleaning datasets, and improving every single day.
4
3
32
468
Dev Prince 📊 retweeted

May 11
Data minds,
I don't know who needs to hear this but your Analysis does not always have to end as a Dashboard. It could be a report
Let's talk about it 🧵👇
Retweet for others
2
8
29
1,293
May 10
How did you build your analytical mind and intuition? 📊
How long did it take?
What did you do…
or stop doing?
I want to know everything 🥹
1
26