
Joined December 2023
- Tweets 2,374
- Following 67
- Followers 5,547
- Likes 7,715
980 Photos and videos


Jun 12
bitcoin:native
Don't think we get much action outside of this little range going into the weekend.
Don't let your impatience put you in a bad spot here, it's totally fine to sit through this PA if you don't have a system to trade it with.
1
29
689
Jun 11
It's a market for SDCA enjoyers, imo.
More confluence to keep placing those bids.
3
49
508
Jun 9
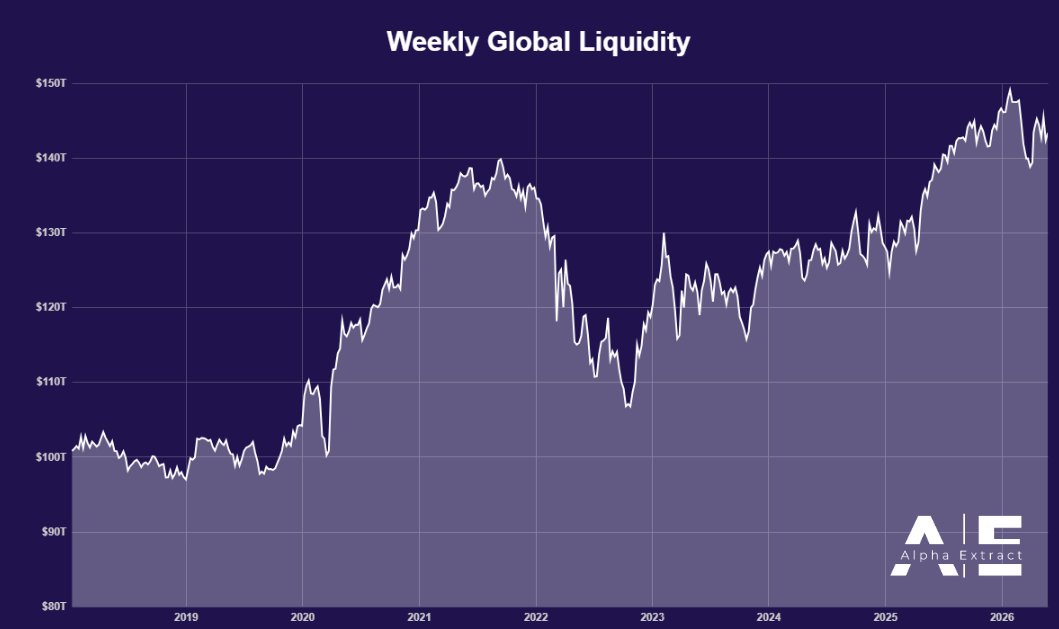
Bitcoin continues to struggle to keep up.
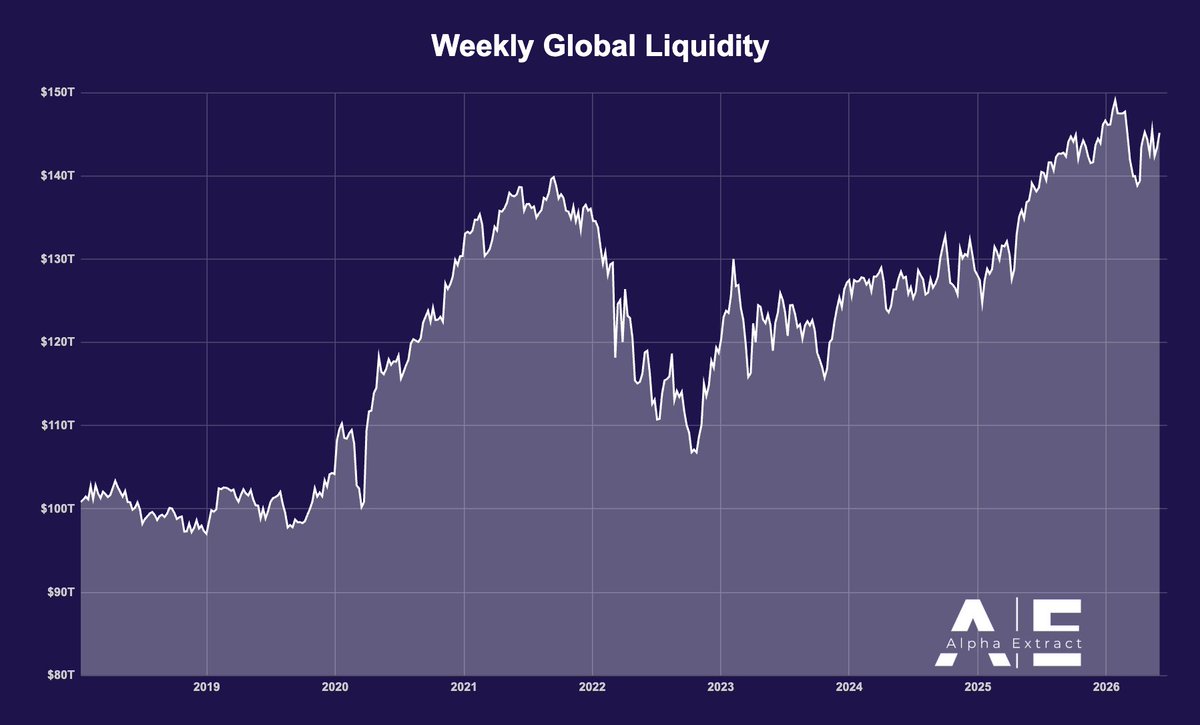
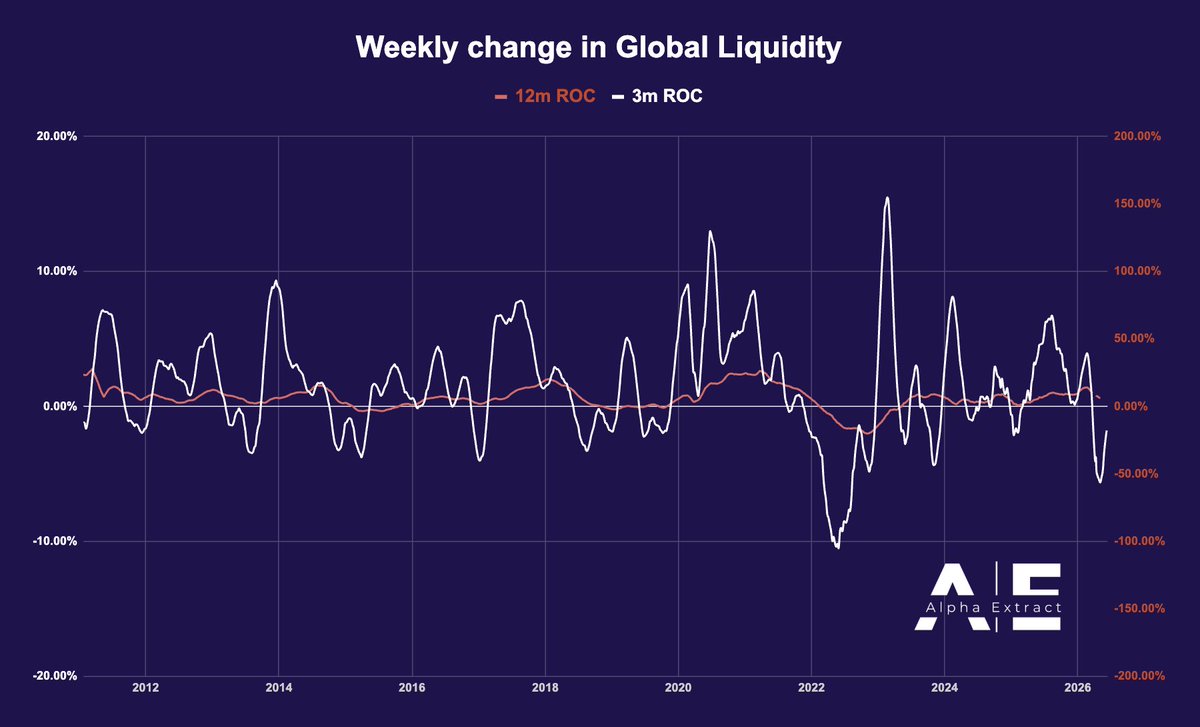
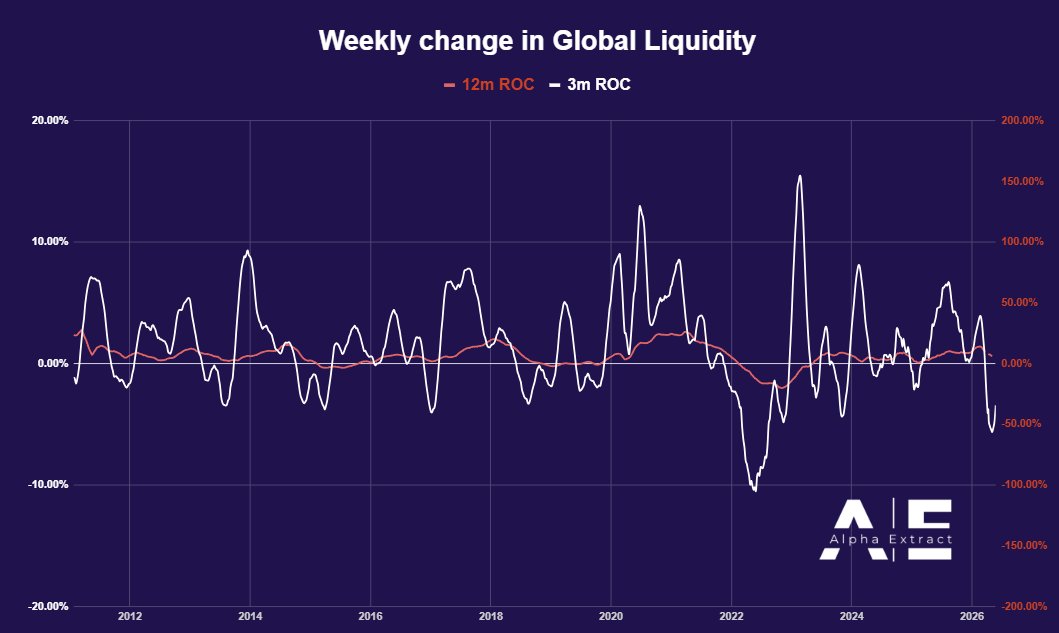
While global liquidity momentum is still improving slightly, a positive cross has yet to occur, leaving markets without the acceleration typically seen during stronger risk-on environments.
Liquidity itself remains elevated, but levels alone rarely drive markets forward.
What matters is whether liquidity is expanding fast enough to fuel risk-taking, and so far that tailwind remains absent.
As a result, rallies may continue to be short-lived, volatility elevated, and sentiment fragile.
The global liquidity trend isn't dead, but the fuel needed to sustain it hasn't fully returned.
Global Liquidity declined by ~$0.49T (-0.34%) this week.
1
5
57
1,033
Jun 8
Both Liquidity Fair Oscillators (medium and long-term) sent a buy signal yesterday.
Still thinking we go lower before we go higher, but either way - both of these firing at the same time usually leads towards a reversal over a longer duration.
In short, more signs for potential base forming.

2
4
61
918
Jun 7
$BTC failed to close below the yearly low at 60.2k on the 4H timeframe.
That's a constructive sign.
As mentioned in the previous post, I still think we see lower prices before this is over.
Nevertheless, this is another data point suggesting a base may be forming.
We've already endured a prolonged downtrend, and from my POV, every move lower improves the risk/reward for an asymmetric upside trade.
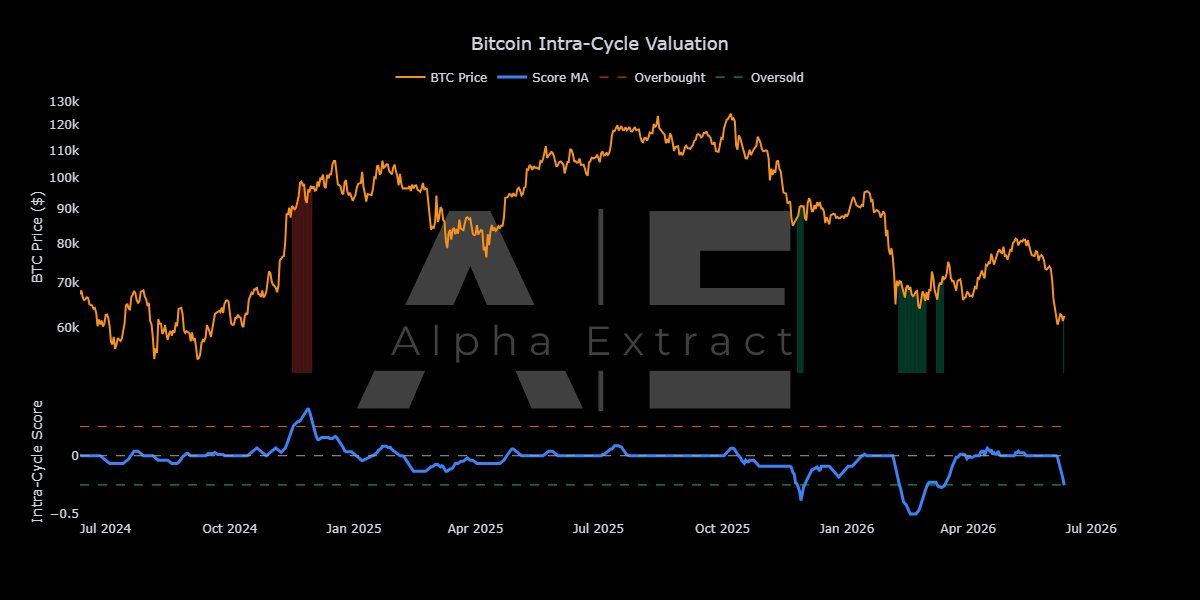
On that note, Cycle Bands just flashed an oversold signal for the first time since 2023.
2
2
41
2,789
Jun 5
This is exactly what I tell my friends, when they start complaining before even scratching the surface, and it's crazy how difficult those two sentences are to absorb.
But it genuinely doesn't get more accurate than this.
You don't need big capital to learn how to trade. In fact, not starting with a big account is an advantage in itself.
Pick an approach and study it.
Build a rule-based system around it.
Backtest it and calculate its EV.
If negative: change it and backtest again
If positive: forward test it with a ~$100 test account.
You only bring meaningful capital once you confirm its EV is positive in real time.
I'm writing this and laughing at the thought of it. Trading is not easy, but it really is this simple.
Jun 4

A bigger account just makes your bad habits more expensive.
Fix your discipline at $100 or lose everything at $100,000.
22
1,061
Jun 5
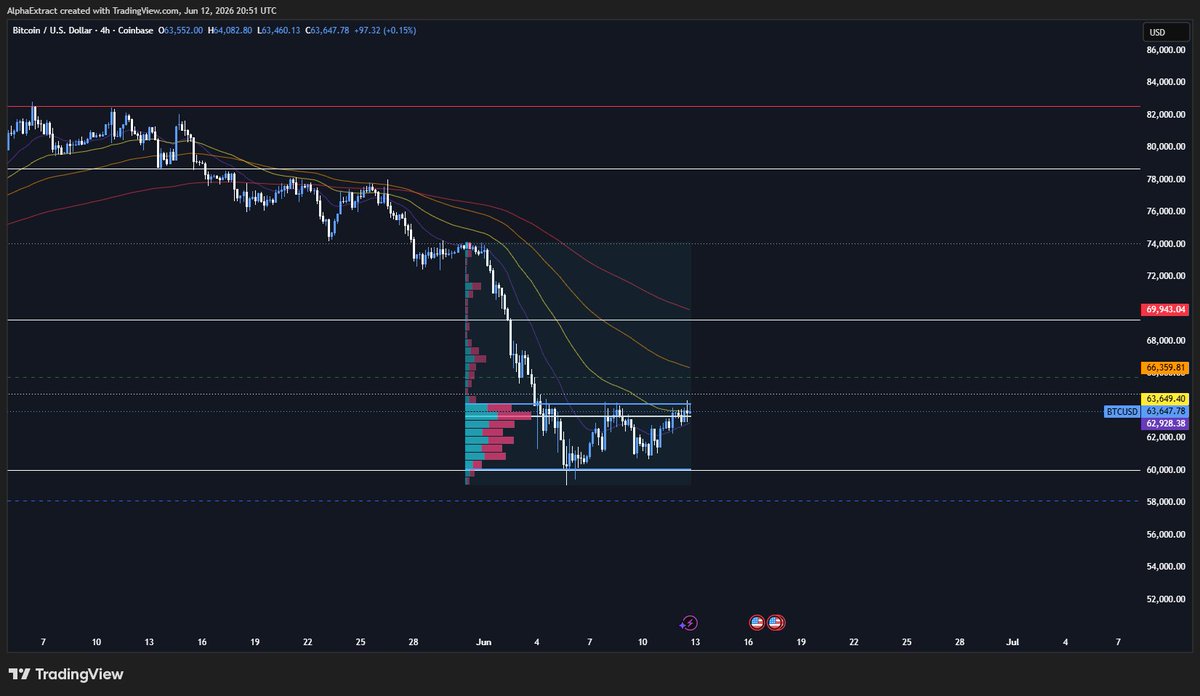
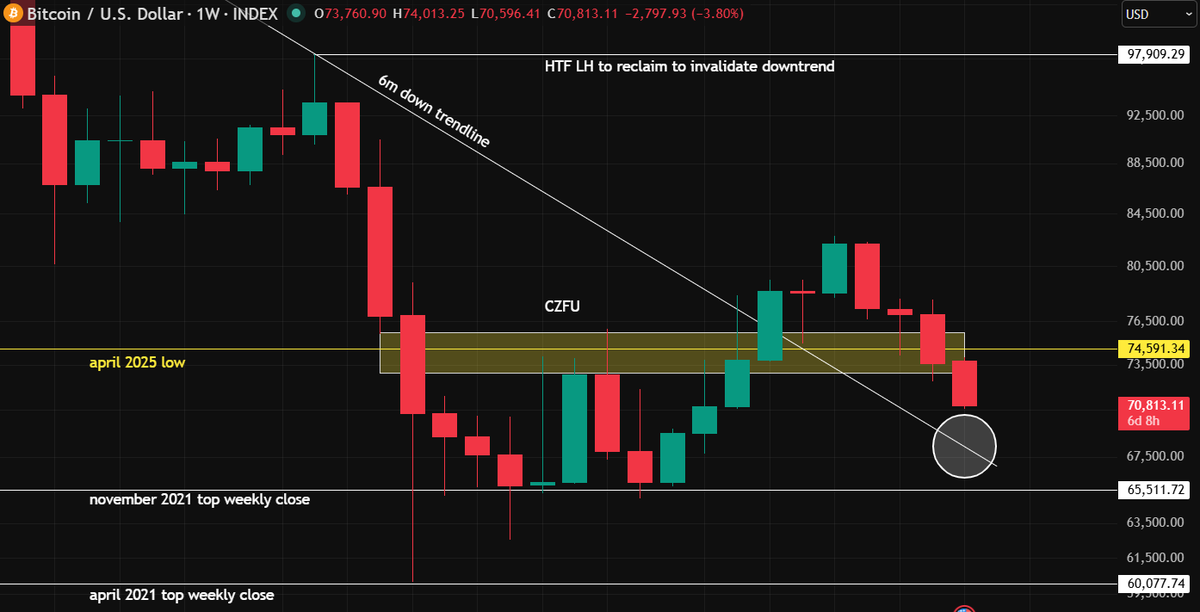
Yearly low swept.
The question now is simple: do we start building a base here, or do we continue lower?
This is where you look for signs of seller exhaustion.
You don't blindly long a falling market trying to catch the exact bottom.
While a V-shaped reversal is always possible, it's far more common for price to spend some time building a base before any sustained move higher.
Personally, I'd like to see one more push lower into the next major S/R zone around 58k, followed by a reclaim back into the range.
That's often the type of sequence that creates a high-probability mean reversion setup, targeting a move back toward the middle of the range and range highs (image 2).

6
4
60
2,114
Jun 3
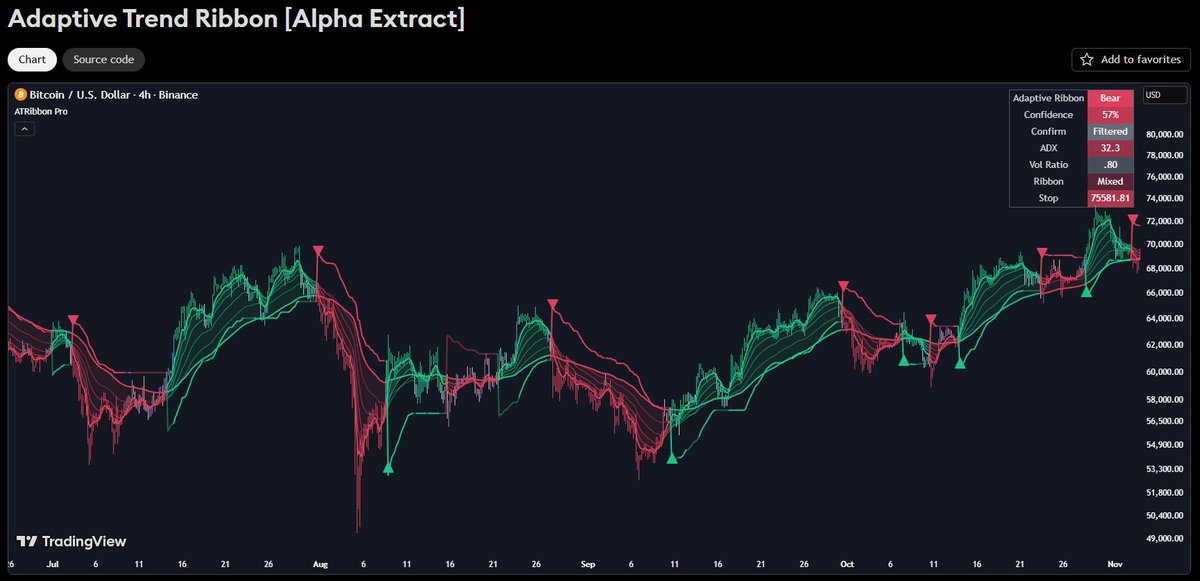
We've published another TradingView indicator:
- Adaptive Trend Ribbon
Link below.
2
2
35
778
Jun 3
No respect shown for 200 EMA band on the weekly TF for $BTC, and although we're seeing buyers step in around the 65.8k level - don't think this is the end of the downtrend.
From my pov, this significantly increases the odds of a 60k test now.
Not interested in longs here until we start seeing a proper base form.
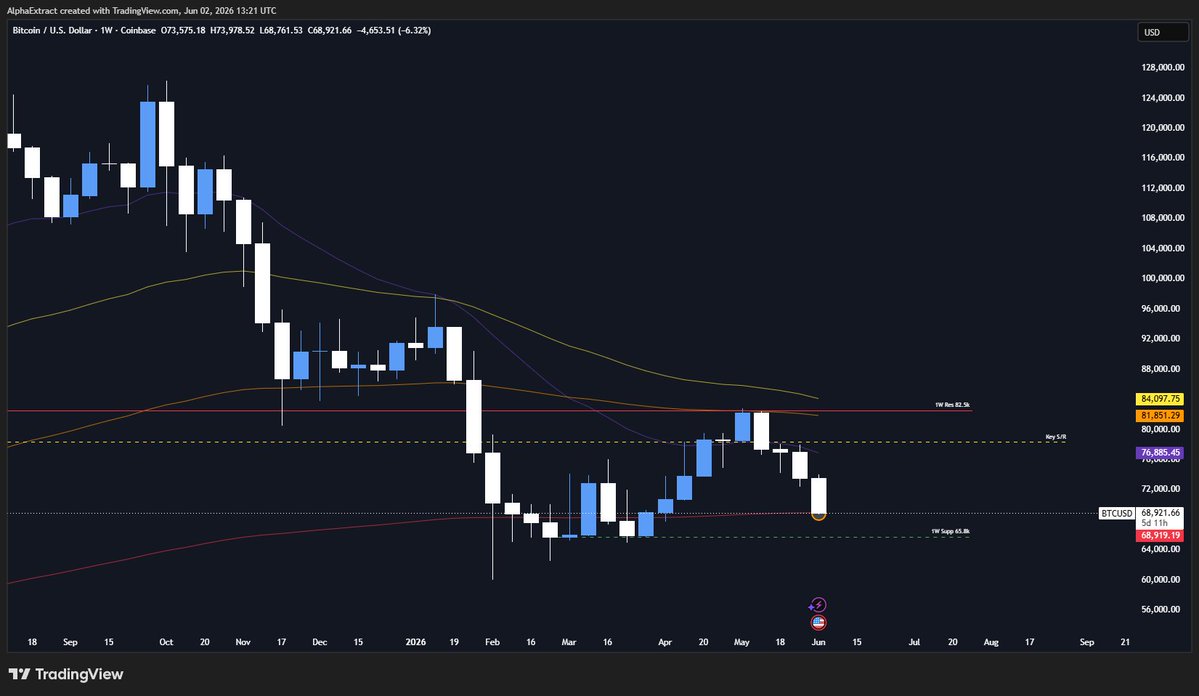
Jun 2

Important area for a bullish $BTC reaction, imo.
From a macro standpoint, still think there are several boxes left to check before expecting a sustained move higher.
That said, a lack of bullish response here would likely add further pressure to market sentiment.
2
26
905
Jun 2
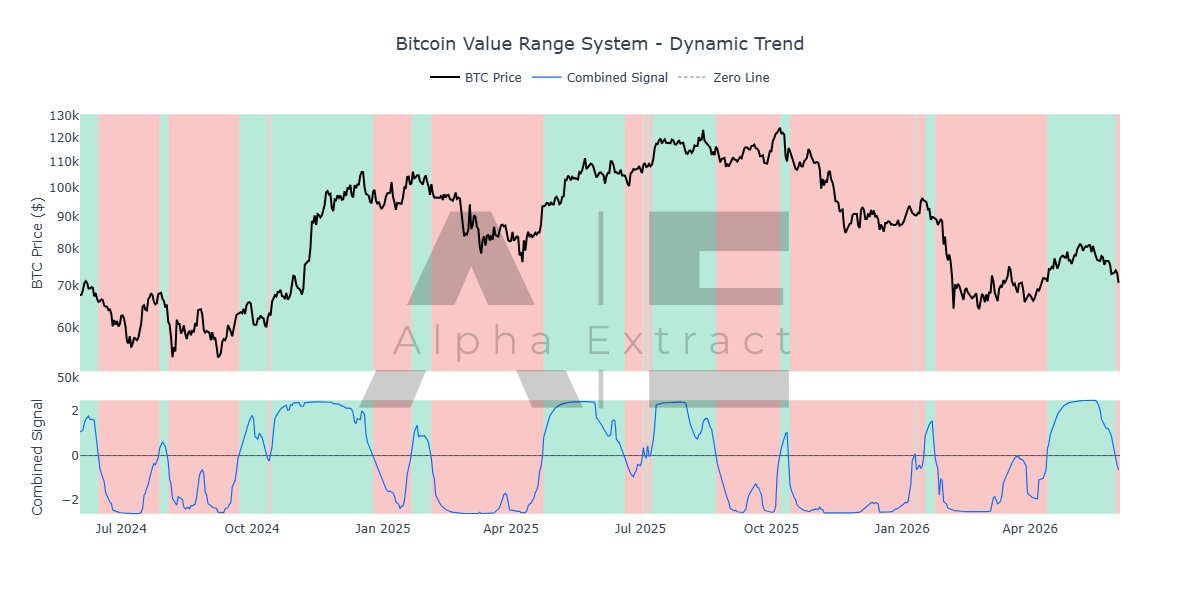
On another note, that's a sell signal from our BVRS - Dynamic Trend model.
1
37
613
Jun 2
Important area for a bullish $BTC reaction, imo.
From a macro standpoint, still think there are several boxes left to check before expecting a sustained move higher.
That said, a lack of bullish response here would likely add further pressure to market sentiment.
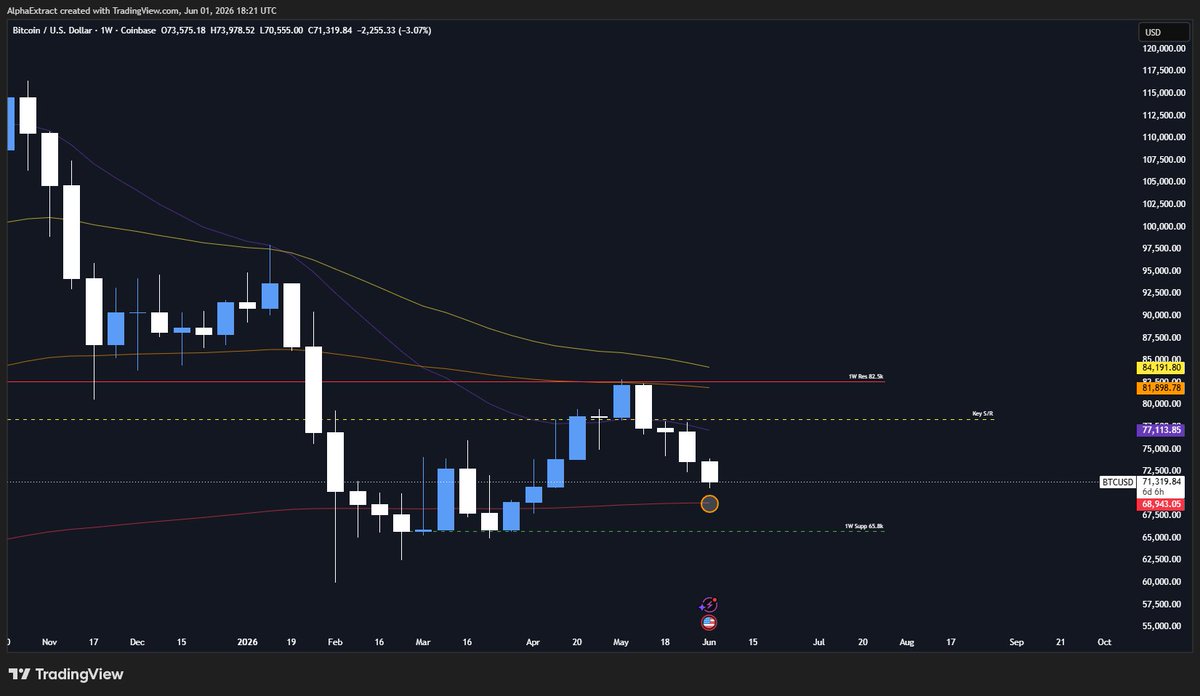
Jun 1
Similar take here - really want to see a test and reaction off the weekly 200 EMA band, right around the 68.9k level.
24
1,646
Jun 1
Global liquidity momentum continues to improve, and stocks are reflecting that accordingly. Bitcoin, however, continues to struggle a bit.
The latest ISM PMI data points to a stronger US economy.
While that sounds bullish on the surface, stronger economic activity can also pull liquidity away from financial markets.
That said, Treasury issuance remains focused on the short end of the curve, which continues to support liquidity conditions.
One thing worth noting is that liquidity momentum has improved much faster than Bitcoin's price performance.
Historically, these divergences tend to resolve eventually - either through stronger asset prices or weaker liquidity momentum.
As mentioned in the previous update, this still looks more like the early stages of reacceleration than a fully established expansion phase.
Momentum is improving, but the indicator has yet to trigger a long signal.
For now, the trend is moving in the right direction. We're simply waiting for confirmation.
Global Liquidity increased by 1.24% ($1.78T)

1
1
50
979
Jun 1
Similar take here - really want to see a test and reaction off the weekly 200 EMA band, right around the 68.9k level.

$BTC Weekly
If current level is not defended with strong immediate reaction Price will go retest the 6M descending trendline at /- 68K
That would be great to see
However my short term outlook is kind of bearish. See my next post about the Monthly TF to understand why
3
3
31
2,821
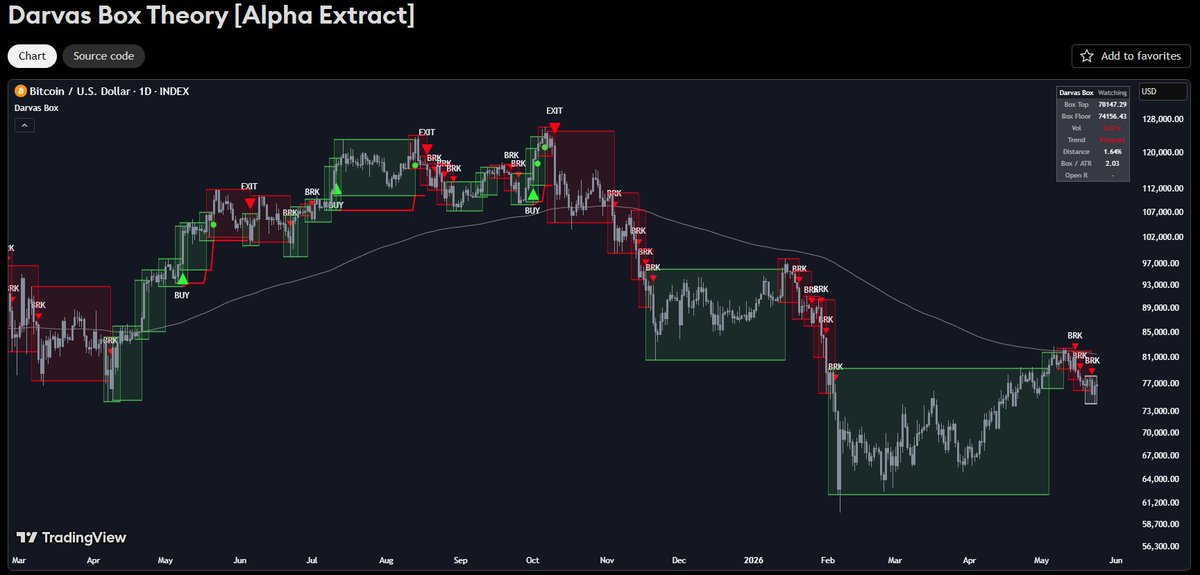
May 31
We published another TradingView indicator last week, forgot to share:
- Darvas Box Theory
Direct link below.
PS - thank you for the love you're showing us on TV!
3
1
32
1,268
May 30
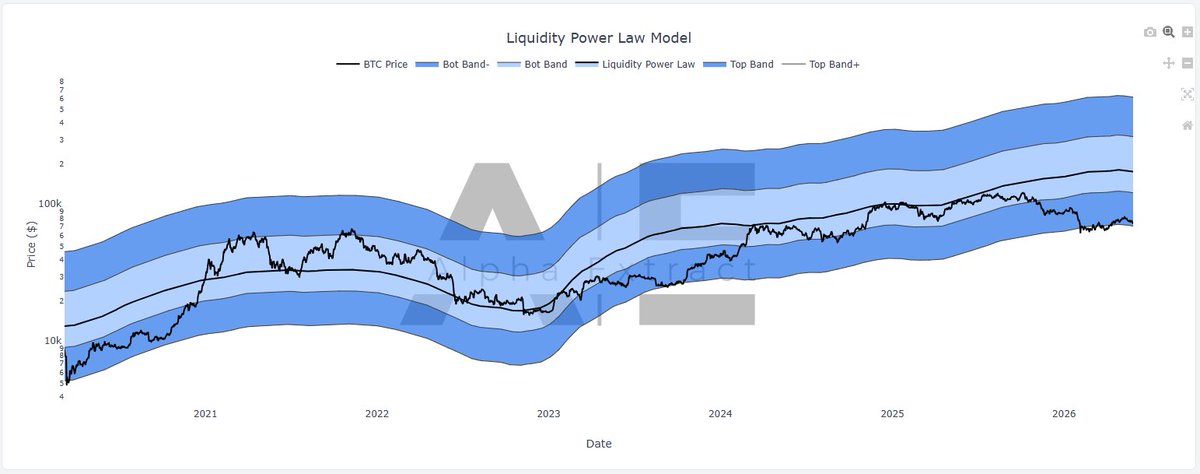
BTC has now spent more than four consecutive months trading near the lower band of the Liquidity Power Law.
Historically, that's an exceptionally rare occurrence.
The last comparable period was in late 2023, which was followed by a significant expansion higher.
Past performance doesn't guarantee future results, but conditions like these have often coincided with periods of asymmetric opportunity.
From a statistical perspective, Bitcoin remains deeply compressed relative to its long-term trend.
What's even more interesting is that the Liquidity Power Law currently projects a bitcoin:native price of roughly $176k under a bullish liquidity-driven scenario.
Given Bitcoin's historical sensitivity to global liquidity cycles, that target doesn't look unrealistic over the next couple of years.
Taken together, prolonged compression near the lower band and the valuation implied by the Liquidity Power Law suggest that the current risk-to-reward profile may be considerably more attractive than prevailing sentiment would have you believe.
3
5
61
3,690
May 26
Global liquidity increased by roughly ~$1 trillion this week, rising from ~$142.4T to ~$143.4T ( 0.75%).
More importantly, momentum continues to strengthen.
Our RoC chart is now showing a clearer shift higher after the recent period of stalling and volatility.
What makes this interesting is the backdrop.
Over the past week, bond markets remained under pressure with long-duration yields pushing higher again, while markets continued pricing in the possibility of structurally higher rates over the next 12 months.
Normally, this would create a much more difficult environment for liquidity-sensitive assets.
Yet despite that, liquidity conditions still improved.
Part of that likely comes from continued DXY stabilization around the critical 100 level after months of weakness.
A softer dollar generally eases global financial conditions and tends to support liquidity expansion globally.
At the same time, risk assets have remained surprisingly resilient despite elevated geopolitical tensions and ongoing uncertainty around inflation and refinancing conditions.
For now, the key takeaway remains the same:
Liquidity momentum is improving again, which is constructive for risk assets - but this still looks more like the early stages of reacceleration rather than a fully established expansion regime.
1
9
62
2,687
May 26
Took a short break from charts and spent most of it on the beach enjoying this.
Back now and ready to lock back in.
Funny enough, judging by the charts - it does not look like I missed much lmao.

3
19
666
May 20
Market Strength Trend has now officially flipped bearish.
One of the faster and simpler models in our playground - but a model nonetheless.
Personally, stopped looking for aggressive longs after the $BTC weekly close below 78.5k, so this further reinforces the current bias: defensive approach outside of spot bags.

1
37
973