
Joined June 2021
- Tweets 2,014
- Following 253
- Followers 11
- Likes 2,207
28 Photos and videos


andersoncode42 retweeted

Jun 13
If you want to actually understand memory allocation, read this by @TheGingerBill.
A series so damn good.
gingerbill.org/series/memory…

2
105
975
32,715
andersoncode42 retweeted
Jun 6
the db primer
cstack.github.io/db_tutorial…

Jun 6

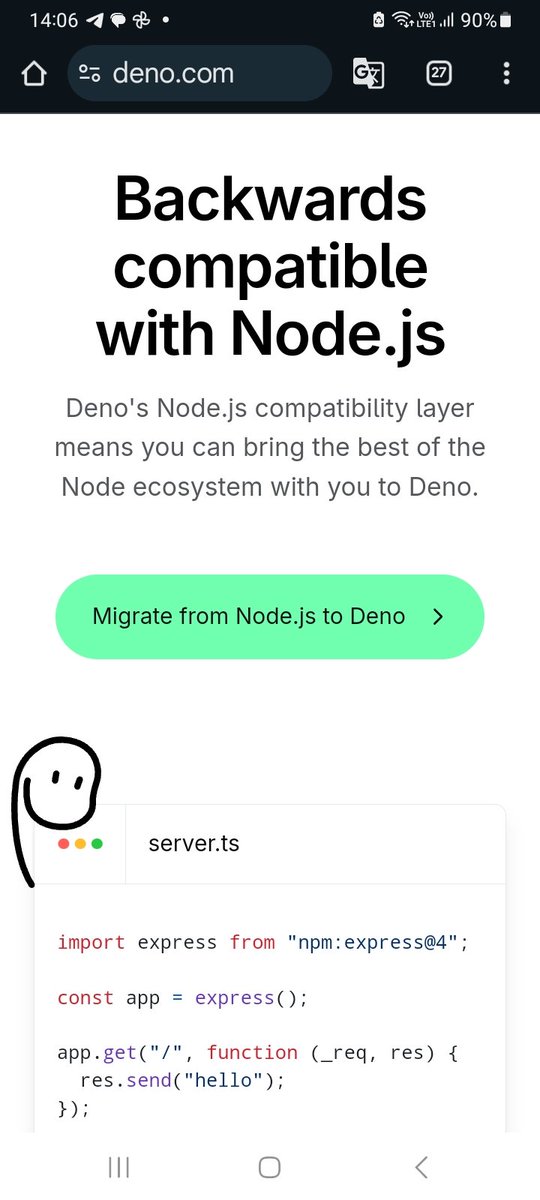
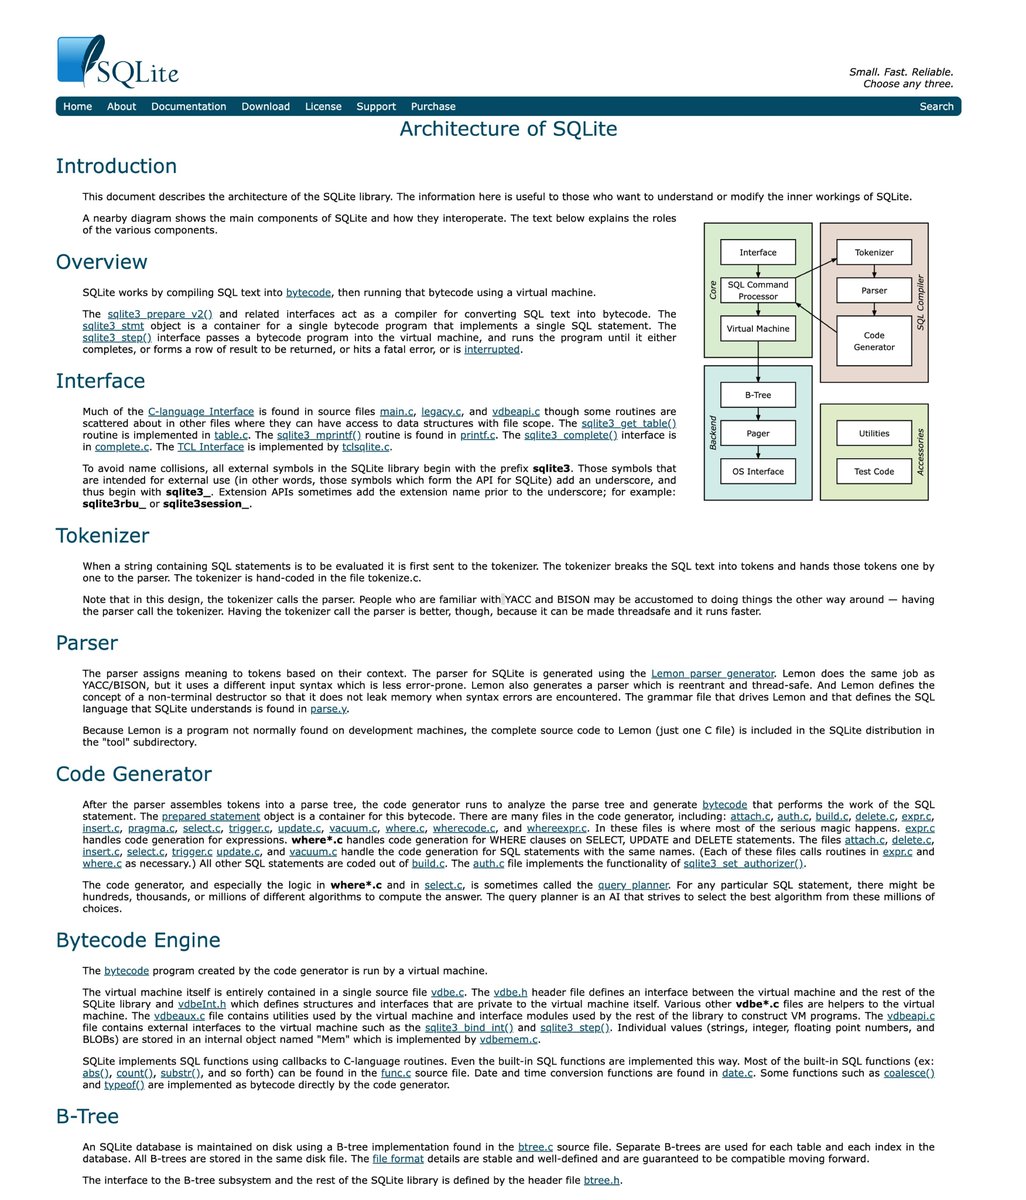
SQLite is used in many browser engines for efficient storage, such as bookmarks and history.
The official doc explains the architecture, how it uses the bytecode engine, and how the query processing engine works under the hood.
2
42
283
19,832


A must read
0xkato.xyz/how-llms-actually…
15
183
1,929
169,359

🎁 Giveaway alert: Win a ZimaBoard 2 and start your homelab for FREE.
We're teaming up with @ZimaSpace to give away a one-of-a-kind It’s FOSS × ZimaBoard 2 1664 Edition. And yes, only ONE exists.
Powered by Intel N150 with dual 2.5GbE networking and PCIe expansion, it's perfect for:
✅ Self-hosting
✅ Docker & Homelab projects
✅ NAS & Media Servers
✅ Linux experiments
How to enter:
1️⃣ Follow @ZimaSpace
2️⃣ Follow @ItsFOSS
3️⃣ Like and repost this post
📅 Giveaway runs from June 3 to July 3, 2026
🎲 One winner will be selected at random and contacted via DM on July 7
🌍 Open worldwide
Good luck, and may the odds be in your favor! 🚀

42
246
321
14,075
andersoncode42 retweeted

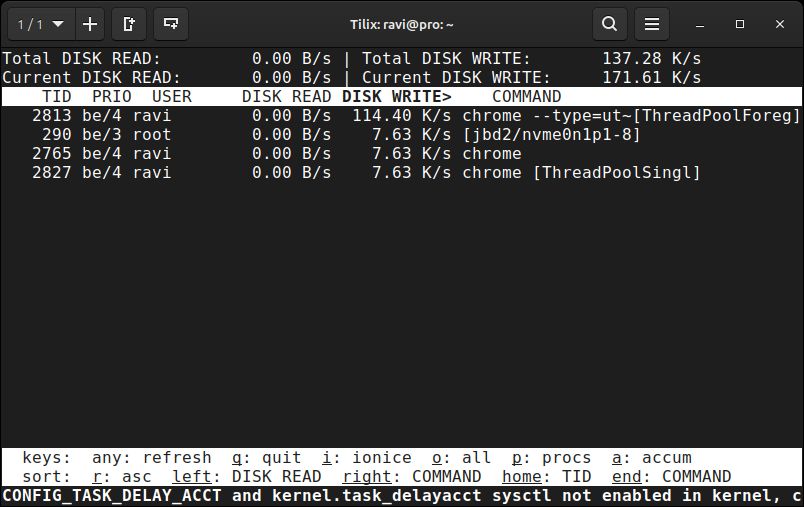
💡 Quick Linux Tip #1
Need to find which process is eating all your disk I/O right now?
Use:
$ iotop -o
It shows only the processes actively reading or writing to disk, updated in real time.
The -o flag filters out idle processes so you're not hunting through noise.
One glance tells you exactly which service is hammering your disk before your storage team calls you first.
Follow @tecmint for more #Linux tips
5
38
161
5,480
andersoncode42 retweeted

May 25
"Understanding systems".
by Christoffer Stjernlöf
entropicthoughts.com/underst…
1
6
69
3,758
andersoncode42 retweeted

Apr 21
📦 How Containers work? Deep dive into Containerization.
Read full article here: open.substack.com/pub/cloudh…

19
134
5,777
andersoncode42 retweeted

Apr 15
Java эволюционировал.
Ваш код тоже может.
javaevolved.github.io/ru/
3
12
56
2,776
andersoncode42 retweeted

Apr 7
For two decades, S3 has been an object store, but today it's something broader. S3 Files lets you mount any bucket as a filesystem—no copies, no sync scripts, no choosing between file and object. @andywarfield tells the full story, including the "filerectories" that almost made the cut. allthingsdistributed.com/202…
24
248
1,257
321,159
andersoncode42 retweeted

Apr 6
Explain inode exhaustion. How can a disk show free space but still refuse to create new files?
2
9
1,325
andersoncode42 retweeted

Apr 6
You run EXPLAIN ANALYZE on a query.
You see "Seq Scan" instead of "Index Scan"
even though the index exists.
What does that tell you?
2
3
22
6,647
andersoncode42 retweeted

Apr 6
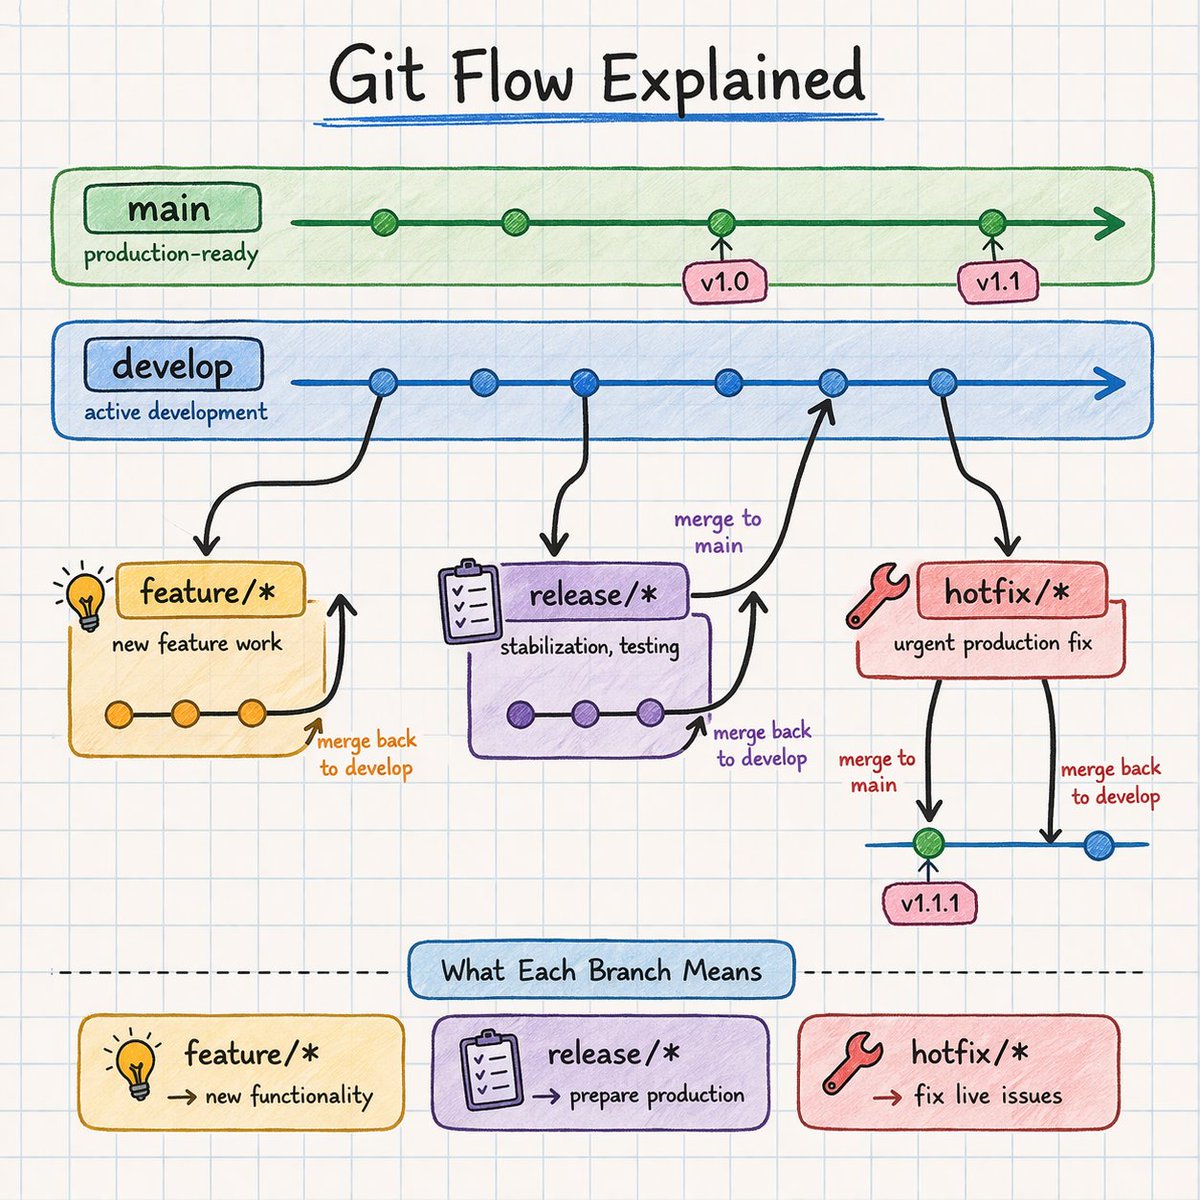
Git Flow - Finally makes sense 🔁
main → production
develop → working branch
feature → build
release → stabilize
hotfix → fix production fast
Most people memorize Git.
Top engineers visualize it.
12
126
724
40,069
andersoncode42 retweeted

Apr 4
Anthropic says Claude Code subscribers will need to pay extra for OpenClaw support techcrunch.com/2026/04/04/an…
23
18
89
24,813

andersoncode42 retweeted

Mar 29
Stop guessing which queries are slowing your DB down. This dev walks through using pg_stat_statements to see which queries consume the most total CPU time — and how to tell the difference between a slow query and one that's just called too often.
{ author: Labeeb Ahmad }
dev.to/labeeb-ahmad/finding-…
1
17
89
6,683
andersoncode42 retweeted

Mar 28
Here’s a cheat sheet with common uv commands for developers
uv.pydevtools.com/
7
33
2,508
andersoncode42 retweeted

Mar 23
Postgres tip: Autovacuum includes a table ANALYZE but a manual vacuum does not.
VACUUM removes dead rows. ANALYZE refreshes statistics for query plans. If you have to run a manual VACUUM, it generally makes sense run a VACUUM ANALYZE so you get both.
4
26
991
andersoncode42 retweeted

Mar 20
Lambda memory is directly tied to CPU allocation. Bumping from 128MB to 512MB often makes functions run 4x faster, and costs the same or less because you're paying for duration × memory.
Always run Lambda Power Tuning before assuming your config is optimal.
2
3
33
2,720
andersoncode42 retweeted
Mar 22
CloudWatch Logs default retention: Never Expire.
Every team forgets to set this. 6 months of Lambda, ECS, and VPC Flow Logs sitting forever, at full price. Set a retention policy per log group. 30-90 days covers 99% of debugging needs.
3
46
4,403