
Lithe
Joined July 2017
- Tweets 183
- Following 66
- Followers 668
- Likes 3,651
96 Photos and videos


Pinned Tweet

Apr 8
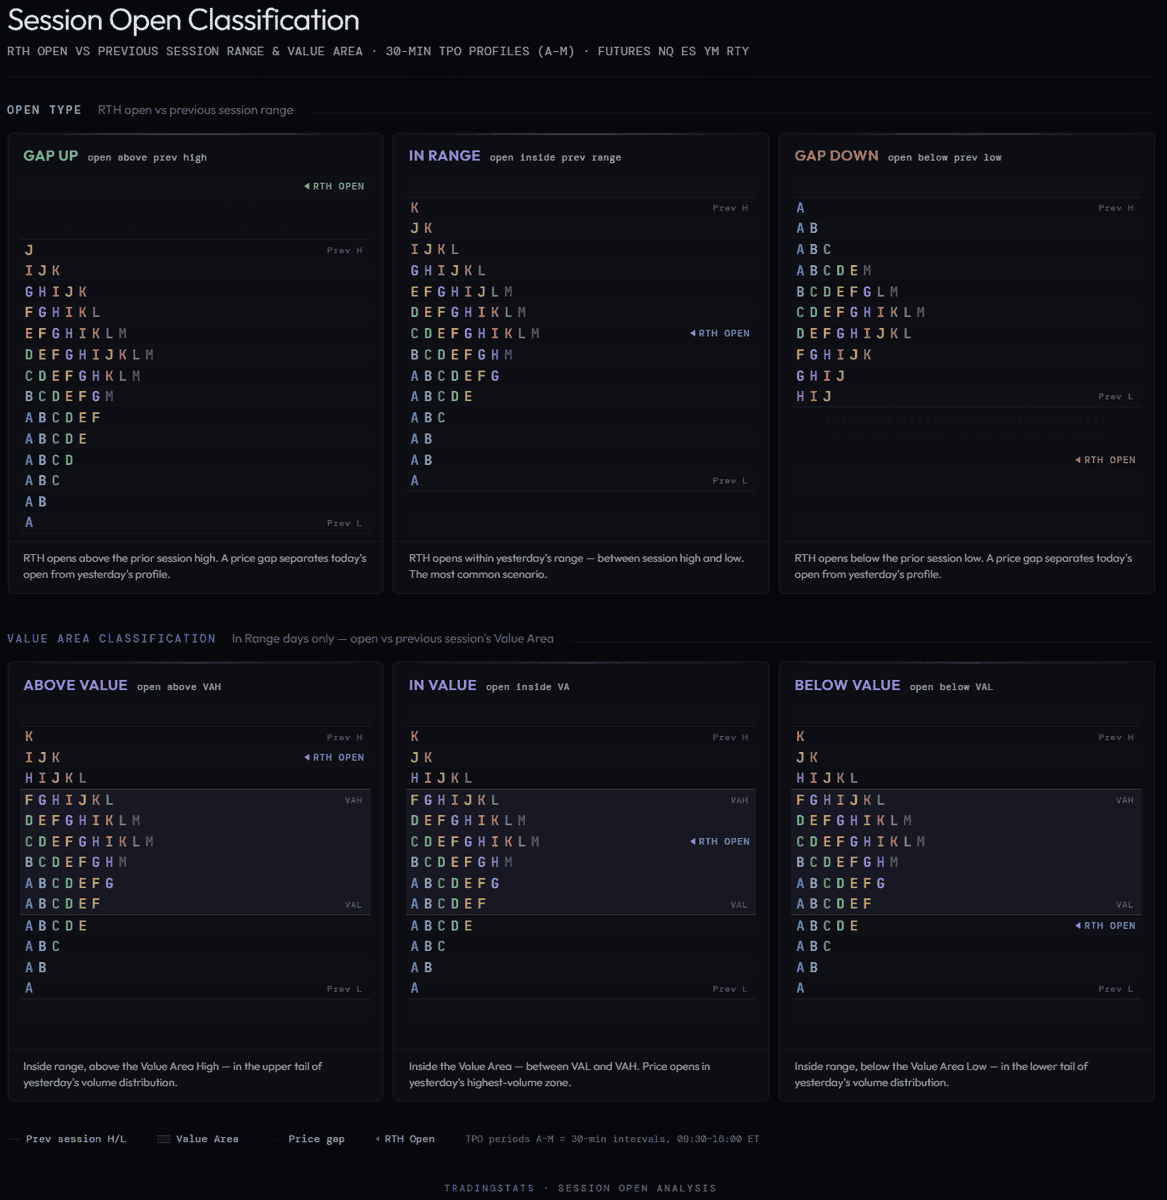
Gap Up, Gap Down, or In Range — What Happens Next? (12,390 Sessions Analyzed)
Every trading day begins with a single print on the tape — the RTH session open. That first price relative to the previous session’s range sets the tone for everything that follows. But how exactly does opening type — gap up, gap down, or in-range — influence intraday behavior?
We analyzed 12,390 trading days across four major futures contracts to answer these questions:
How often does each open type occur, and is the distribution stable?
Which previous-session levels are most likely to be touched based on opening type?
Does opening within vs outside the Value Area change the day’s character?
When price touches one Value Area boundary, how often does it reach the VPOC?
How does gap size affect the probability of revisiting the prior range?
The results reveal that opening type is not merely descriptive — it carries measurable statistical weight. In-range opens show 71-73% probability of touching the previous close, while a touch of the prior VAH or VAL leads to 81–84% probability of also reaching the VPOC.
Data and Methodology
This research covers minute-level RTH (09:30-16:00 ET) data for four CME futures contracts:
#NQ (Nasdaq-100) — 3,116 days
#ES (S&P 500) — 3,042 days
#YM (Dow Jones) — 3,116 days
#RTY (Russell 2000) — 3,116 days
The dataset spans from February 2014 through March 2026 — over 12 years of market history covering multiple regimes including low-volatility bull markets, COVID-era extremes, and the 2022-2023 rate hiking cycle.
Classification Definitions
Open Type is determined by comparing the RTH open price to the previous session’s high and low:
Gap Up — RTH open above previous session high
Gap Down — RTH open below previous session low
In Range — RTH open between previous session low and high (inclusive)
Touch means the level fell within the current day’s RTH traded range (session low ≤ level ≤ session high). No specific sequence or timing is required — only that the level was traded through at some point during the session.
Value Area sub-classification applies only to In Range days and uses the previous session’s TPO-derived Value Area High (VAH), Value Area Low (VAL), and Volume Point of Control (VPOC).
1
1
9
747
Jun 7
The Week-1 Tell: How Index Futures (#NQ_F #ES_F Behave Around the Prior Month’s High and Low
Why monthly highs and lows matter
The previous month’s high (PMH) and low (PML) are among the most-watched higher-timeframe levels in the index-futures complex. A plausible reason — consistent with, though not proven by, this data — is that money is managed on a monthly cycle: funds report exposure, P&L, and risk monthly, so stops, trailing logic, and month-end rebalancing tend to concentrate around last month’s extremes. Whatever the cause, price interacts with these two levels — sweeps them, reverses off them, returns to them — with enough regularity that the behavior is measurable. That’s what this study measures.
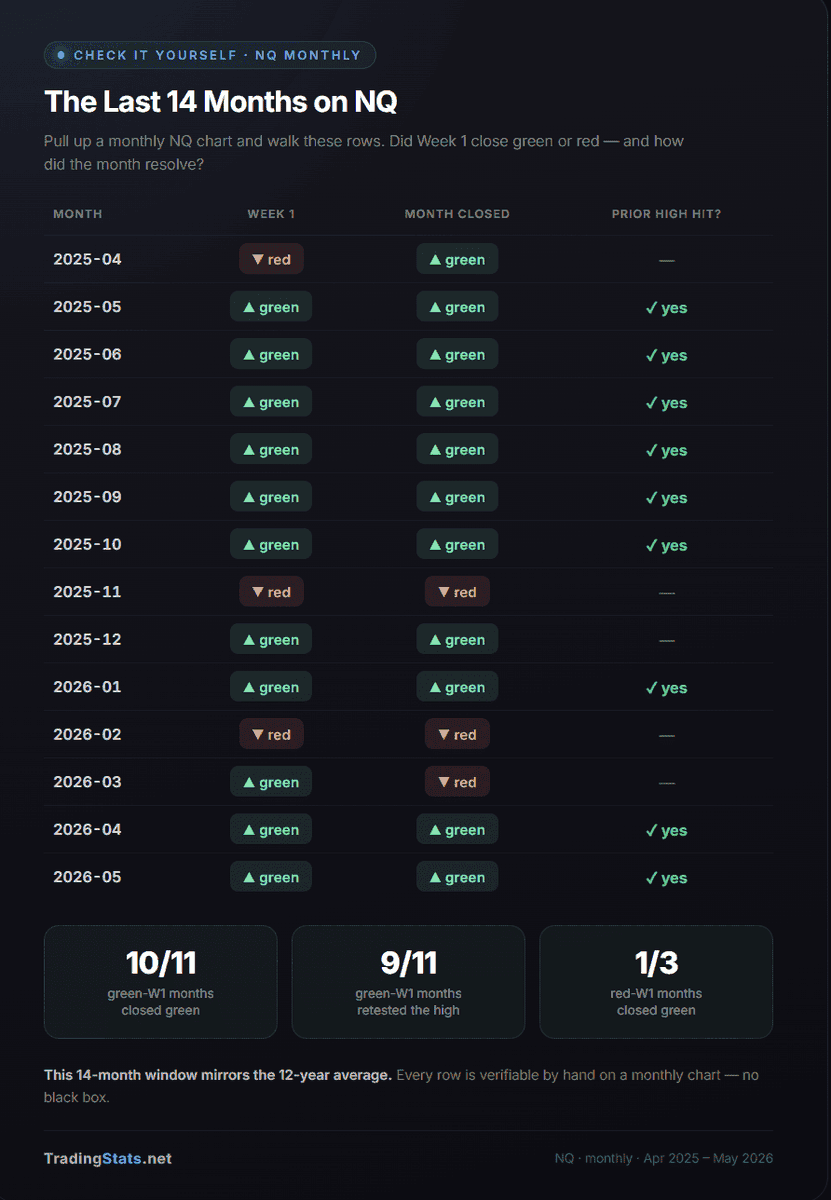
The question this study answers is practical: given only what you know by the end of the first week, what are the odds the month closes green — and that it returns to last month’s high before it’s over?
We pulled twelve years of full-session futures data and tested every common claim about monthly behavior. Several popular ones collapsed under the data. A few quiet ones turned out to be the strongest signals we found. Here’s all of it.
The baseline (read this first)
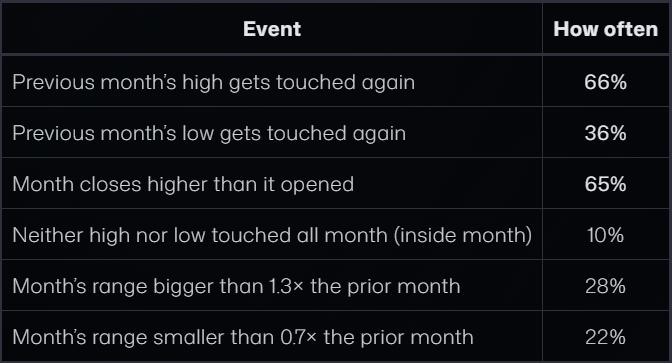
Before any conditions, across all 587 months, these are the raw frequencies. Every number later in this article should be measured against them — a “75% setup” only matters if the baseline is 60%.
The headline here: the prior high gets retested nearly twice as often as the prior low (66% vs 36%). In a market that grinds upward over twelve years, last month’s high is roughly double the magnet last month’s low is. Keep that asymmetry in mind throughout.
1
3
6
396
Jun 7
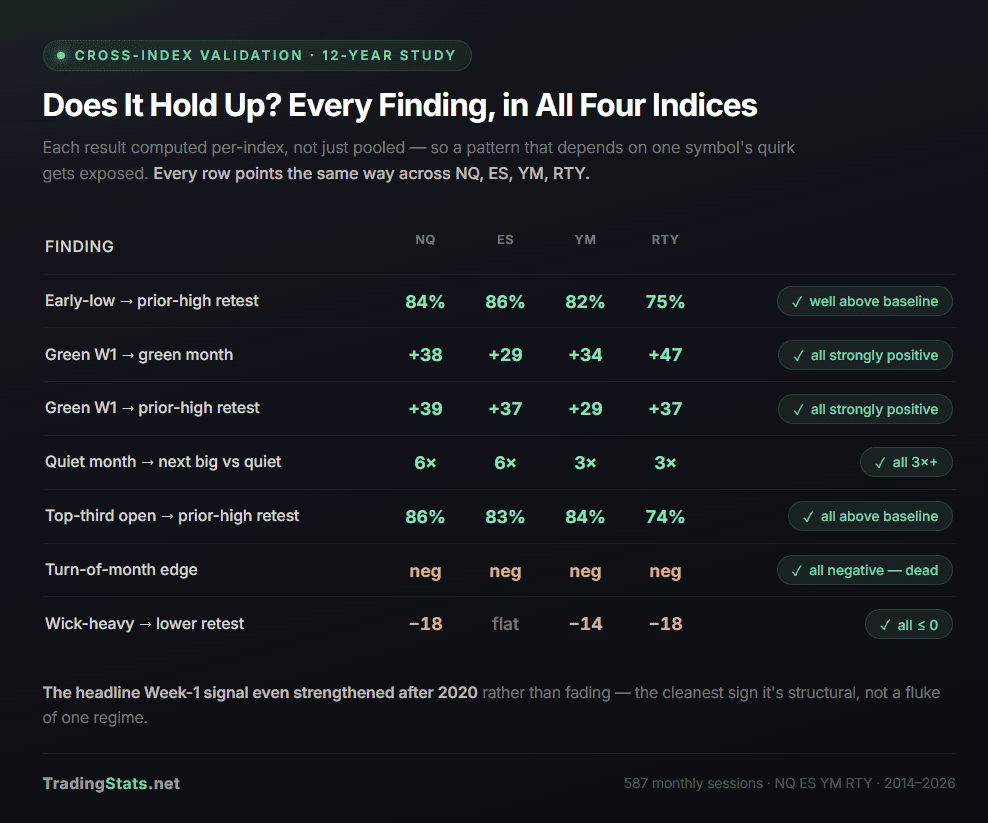
Putting it together — a month-open checklist
By the close of the first Friday each month, you can build a directional read from these checks, in order of strength:
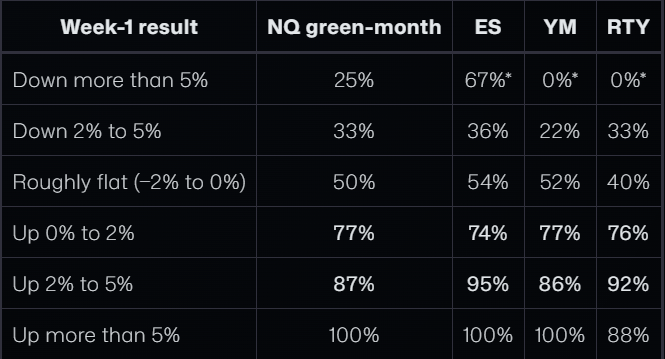
How did Week 1 close vs last month’s close? Green → ~80% odds of a green month, targeting the prior high. This is the dominant signal; bigger Week-1 moves mean more conviction.
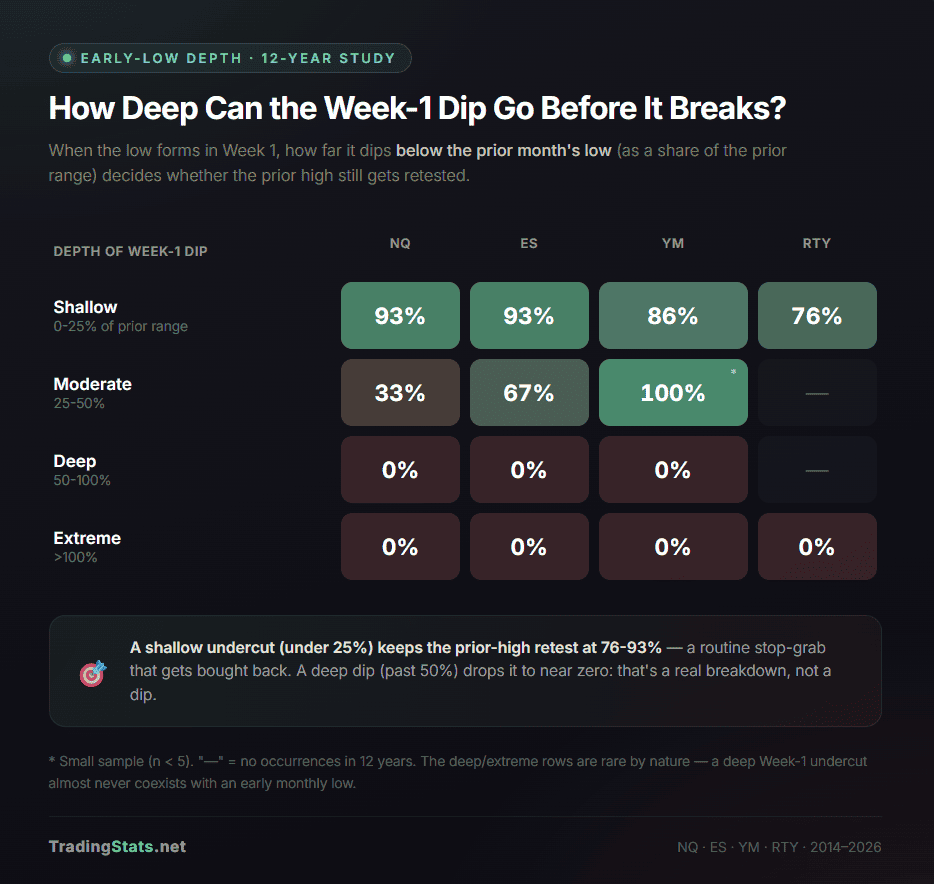
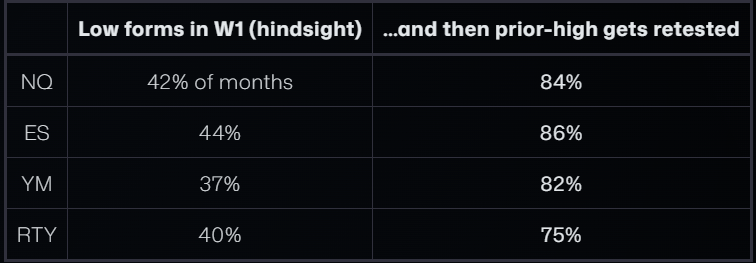
How deep did Week 1 dip below the prior low? (Known by Friday — no hindsight.) A shallow undercut (under 25% past the prior low) → 76-93% prior-high retest, usually by mid-month. A deep dip bottom-third open red prior month → stand aside.
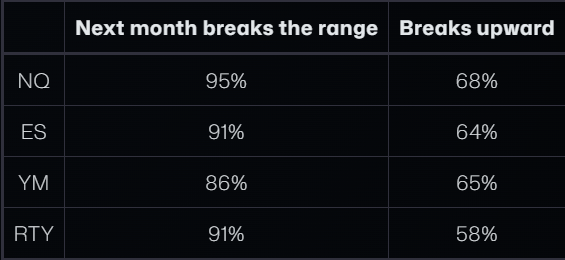
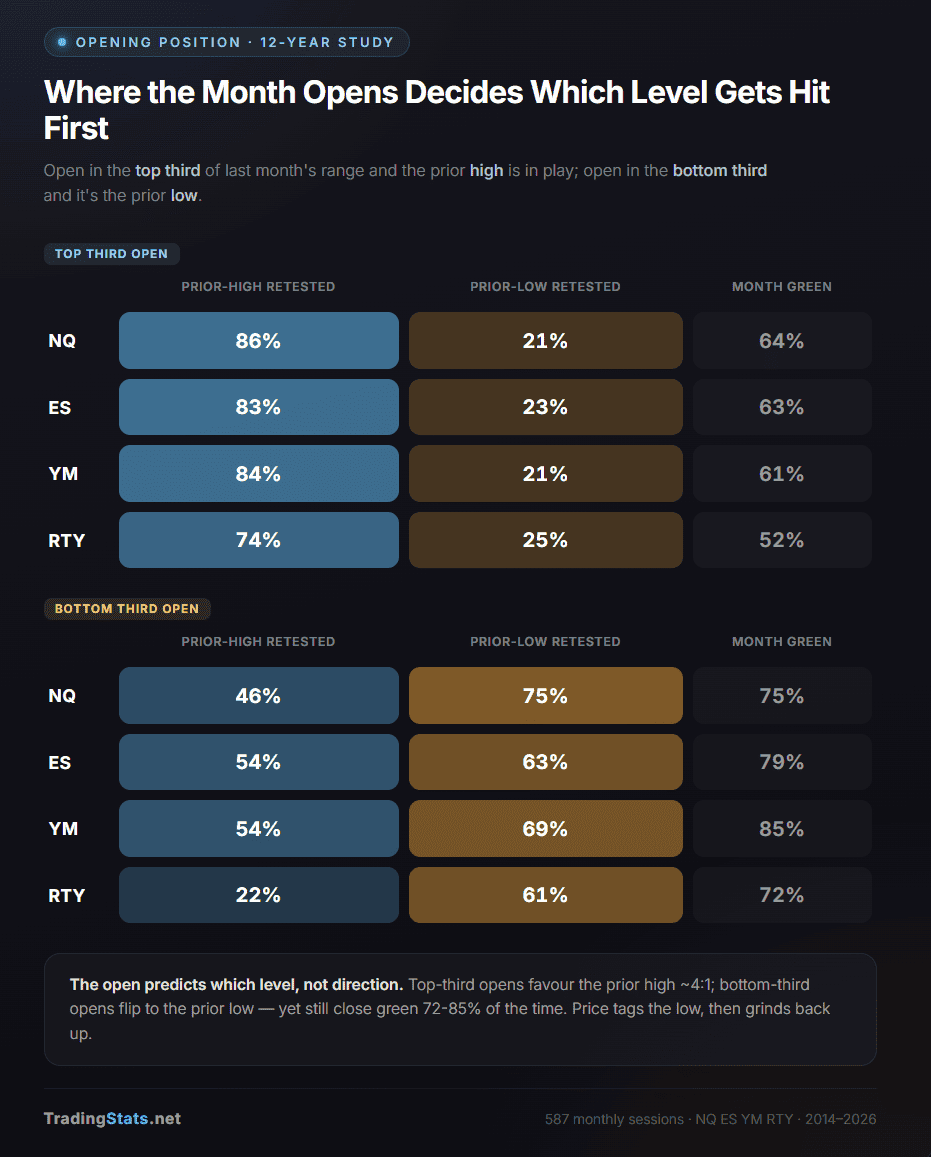
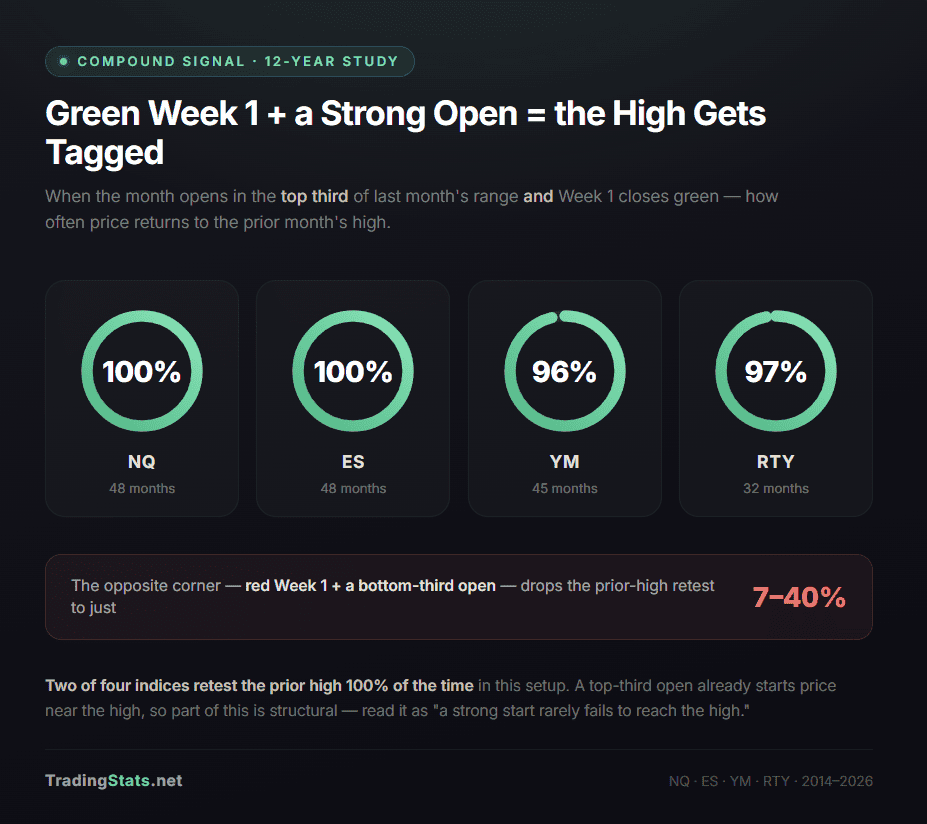
Where did the month open in last month’s range? Top third → prior high in play (near-certain when paired with a green Week 1). Bottom third → expect a tag of the prior low first, often a dip to buy.
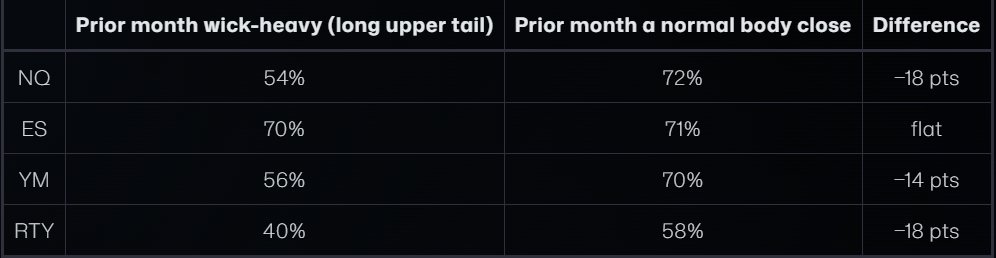
Was last month quiet or huge? Quiet → expect a bigger, bullish month; a 2×-range blow-off → fade continuation.
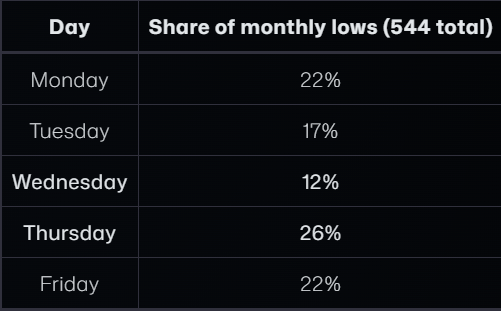
What weekday is it if you’re trying to call the low? A Wednesday breakdown is the least likely to be the real monthly low; a Thursday break deserves more respect.
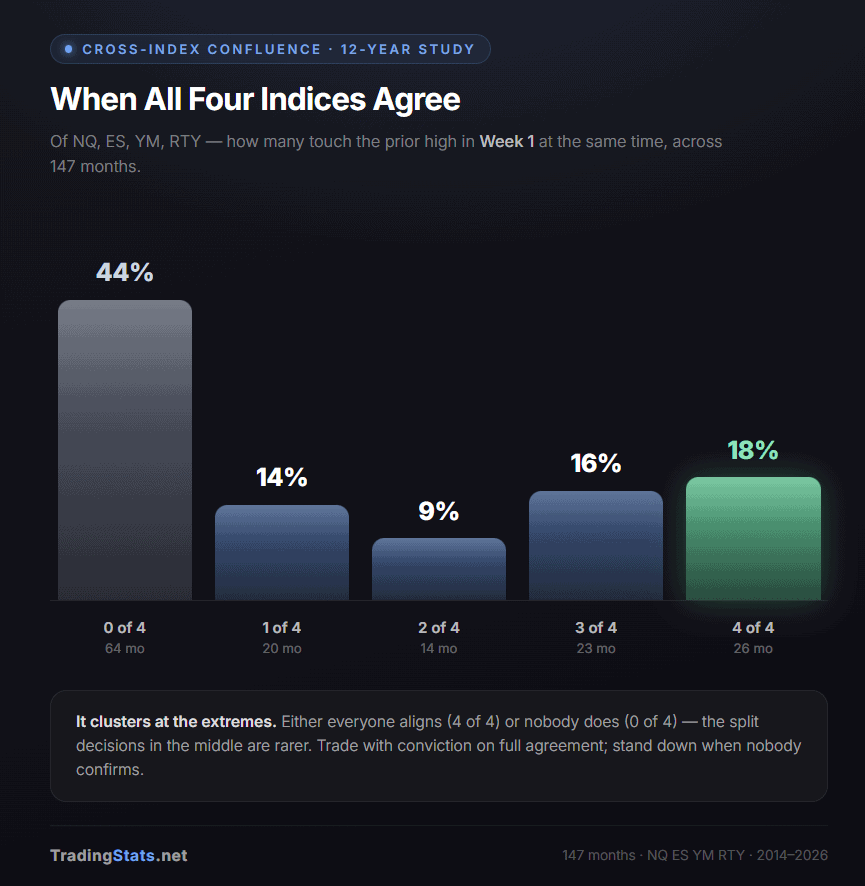
These overlap — a top-third open often comes with a green Week 1 and follows a quiet month — so weigh them together rather than as independent bets.
And skip the three that don’t work: the turn-of-month long, the wick-rejection short, and the NFP-volatility play. We tested them. They’re not there.
1
63
Jun 7
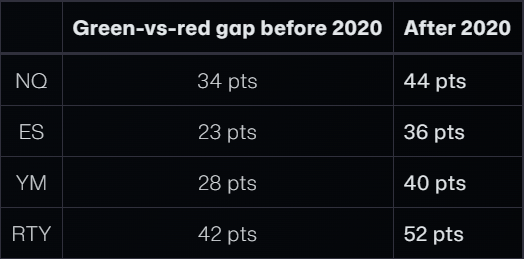
A note on method. Full-session (Globex) daily bars were aggregated to monthly OHLC, 2014-2026, across the four CME index futures, then conditioned and counted. Every percentage in this article is backed by its sample size; the headline findings were confirmed both per-index and pooled across all four, and re-checked on pre-2020 vs post-2020 splits to rule out a result that lives in only one regime. Where we call something “statistically decisive” we mean the probability it arose by chance is below 1 in 20 (and usually below 1 in 100). Caveats worth stating plainly: twelve years is a single, broadly bullish era with one brief 2020 interruption — the Week-1 signal in particular has never been observed through a long bear market — and the four indices move together often enough that they are not four fully independent tests. Past behavior is not a promise about any specific future month.
1
1
76